BME100 f2013:W900 Group15 L2
| Home People Lab Write-Up 1 | Lab Write-Up 2 | Lab Write-Up 3 Lab Write-Up 4 | Lab Write-Up 5 | Lab Write-Up 6 Course Logistics For Instructors Photos Wiki Editing Help | |||||||
|
OUR TEAM
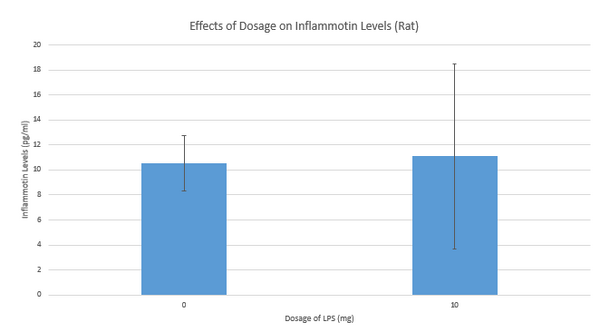
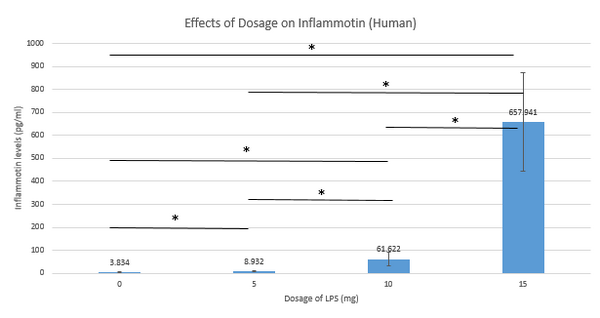
LAB 2 WRITE-UPDescriptive StatisticsExperiment 1 The first experiment testing to see if LPS was a good way of producing Inflammotin was done on rats. The control group was not given any amount LPS and showed on average 10.516 pg/ml of Inflammotin, with a variance of 2.2255 in both directions. The test group was given 10mg of LPS and showed on average 11.112 pg/ml of Inflammotin with a variance of 7.402 in both directions. Both groups had a total of 5 subjects each. Looking just at the averages between the groups it would seem that there is a slight difference that may be significant, but that cannot be said for certain until statistical test are run which will be discussed in a later section. Experiment 2 The Second experiment testing to see if LPS was a good way of producing Inflammotin was done on human subjects namley the elderly of an average age of 67.675 years. The control group was not given any amount LPS and showed on average 3.834 pg/ml of Inflammotin, with a variance of 1.523010177 in both directions. The first test group was given 5mg of LPS and showed on average 8.932 pg/ml of Inflammotin with a variance of 1.593931547 in both directions. The second test group was given 10mg of LPS and showed on average 61.622 pg/ml of Inflammotin with a variance of 30.11069386 in both directions. The third test group was given 15mg of LPS and showed on average 657.941 pg/ml of Inflammotin with a variance of 212.9429762 in both directions. Each and every group had 10 subjects. Upon quick glance there definitely seems to be some significant differences between the averages that will be analyzed later.
ResultsExperiment 1 (Rats) Experiment 2 (Humans)
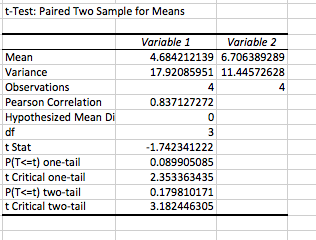
AnalysisExperiment 1 Because there were only two factors involved in the study with the rats, a t-test was used to confirm data. Because the t-test value is higher than the P-value(0.05), there is no significance with the rat study.
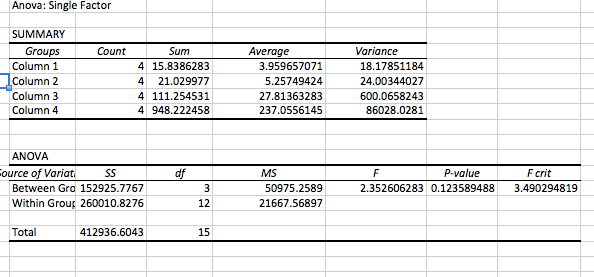
According to the one way Anova Test, the P-value is 0.124. In this situation, the initial P-value was less than the correlated P-value of 0.05. Therefore, we ran the Post-Hoc test to determine any further values. Because all the values were under P value of 0.00833, we can confirm that there is significance.
Summary/Discussion(Please discuss the results and statistical analysis from both experiments. State your conclusion.)
| |||||||


