BME100 f2013:W900 Group13 L3
| Home People Lab Write-Up 1 | Lab Write-Up 2 | Lab Write-Up 3 Lab Write-Up 4 | Lab Write-Up 5 | Lab Write-Up 6 Course Logistics For Instructors Photos Wiki Editing Help | |||||||
|
OUR TEAM
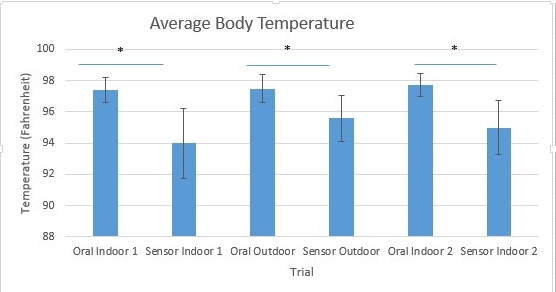
LAB 3 WRITE-UPDescriptive StatisticsThe objective of this lab was to test the reliability of the device, RAIIN, and its iPhone app. This topical device, the RAIIN, measured body temperature and sent the readings to the iPhone app which projected the current temperature reading. A second device was used which was an oral thermometer. The oral thermometer was used as a reference to determine the accuracy and precision of the RAIIN. Using both thermometers on single individuals, 15 independent tests were run collecting data from the inside, outside, and inside again. The data was then compiled into three sets: Inside, Outside, Inside. The descriptive statistics for these data sets are presented below. The average temperature for the oral thermometer for the inside, outside, and inside data, respectively, was 97.4, 97.5, 97.7 degrees Fahrenheit. The average temperature for the RAIIN thermometer for the inside, outside, and inside data, respectively, was 94.0, 95.6, 95.0 degrees Fahrenheit. The standard deviation for the oral thermometer data for the inside, outside, and inside, respectively, was 0.79, 0.90, 0.73. The standard deviation for the RAIIN thermometer data for the inside, outside, and inside, respectively, was 2.25, 1.48, 1.73. The endpoint number for three Inside, Outside, Inside were respectively 75, 180, 75. The standard errors, used for the error bars, for all of the data sets were calculated. The Inside, Outside, Inside standard errors for the oral thermometer were 0.09, 0.07, 0.08 respectively. The Inside, Outside, Inside standard errors for the RAIIN thermometer were 0.25, 0.11, 0.20 respectively.
ResultsThe graph above represents the average body temperature readings for the oral thermometer data and the sensor data in the three situations: Inside, Outside, Inside. The average temperature for the oral thermometer data was higher than the average for the sensor data in all three situations. The error bars of the oral thermometer data show less variance than the error bars for the sensor data in all three situations. In addition, there was a significant difference in average body temperature between the oral thermometer and the sensor in each of the three situations.
Analysis
After determining statistical significance of the data sets, a "Pearson's r Test" was ran to calculate the correlation coefficient (r). The test yielded the following values for the three sets Inside, Outside, Inside respectively: 0.160, 0.225, 0.060. These values reveal that there is a weak, positive relationship in the data points of the three sets. The three graphs plotting the data present a visual model that illustrate this weak, positive relationship. The points in the graphs do not seem to indicate precision nor accuracy.
Summary/DiscussionOur inferential statistics tell us that there is a significant difference between the data for tests. Since the two groups are made up of one (the temperature of an individual using an oral thermometer) and two (the same individual using the device), the correlation should be extremely large. If it was large, it would mean that the device was reporting correct body temperature. Since the t-test values are extremely low, it can be concluded that there is a significant difference between the two measuring tools used. Therefore, since the oral thermometer is known to be accurate, it can be concluded that the sensor was extremely inaccurate and is not reliable making it not a useful product for the market. Unfortunately, many flaws were observed with the product. The collected temperatures were improbable for most cases. For example, the device gave a temperature of 93 degrees Fahrenheit. Since the body would not function at such a low temperature, the device had to be inaccurate. Connecting the device to a cell phones wifi-network proved to be extremely difficult. The Wifi on some of the cell phones picked up signals from other devices within a certain radius, while other cell phones did not pick up signal at all. To connect our device, we had to pair up with another group whose wifi service picked up the signal from our device instead of theirs. The time wasted attempting to connect to the wifi was about 30 minutes. Another large flaw with the product, also regarding the wifi-connection, was the device's inability to stay connected to the wifi. When the wifi connection was dropped, the data was no longer reliable. When making a device, it must be one that the public will benefit from. The wifi connection issues caused using an oral thermometer to be both easier, more accurate, and more time efficient. For this product, which costs over one-hundred dollars, to sell it must work sufficiently better than any other temperature measuring device. This could only happen if the company found a way to make the data accurate, fix the connection problems, or maybe find a new way to connect the sensor to a cell phone.
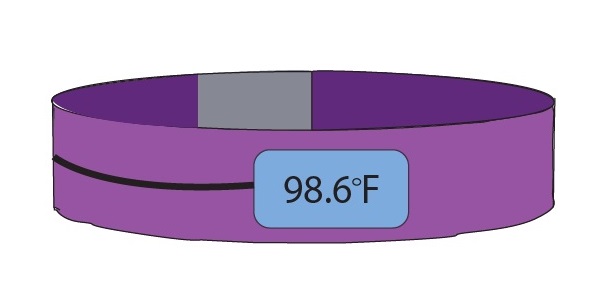
LAB 3B WRITE-UPTarget Population and NeedThe Target Population for this product is pregnant women seeking to monitor their body temperature in order to prevent any harm from coming to them or their unborn child as a result of high body temperature. The need for this product is to help prevent any harm from coming to an unborn child or the pregnant mother by giving an early warning of change in body temperature that could be potentially harmful.
Design
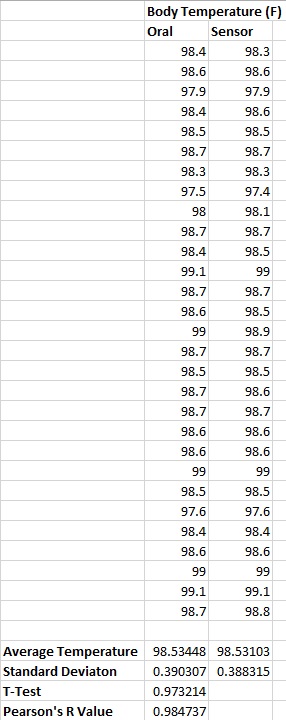
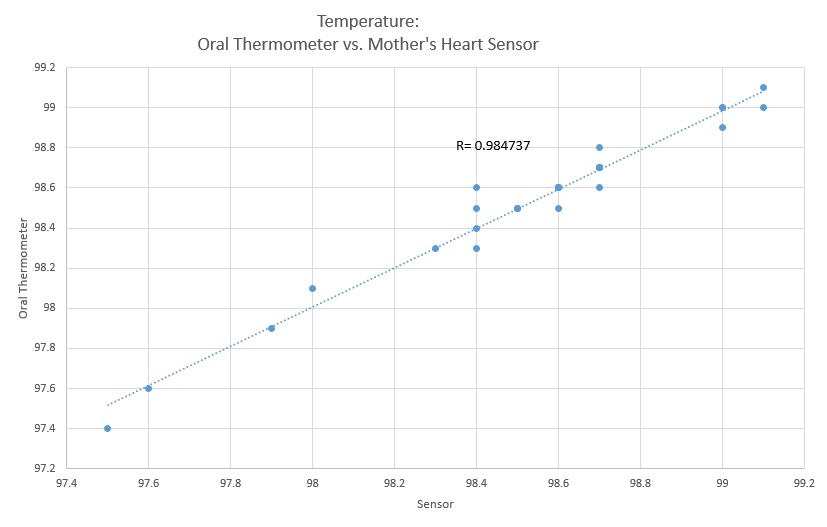
Inferential StatisticsThe data collected from the oral thermometer and the Mother's Heart arm band yielded a p-value value of 0.973214 from the t-test and an r-value of 0.984737, meaning that the data collected from the oral thermometer and the arm band are statistically similar to each other.
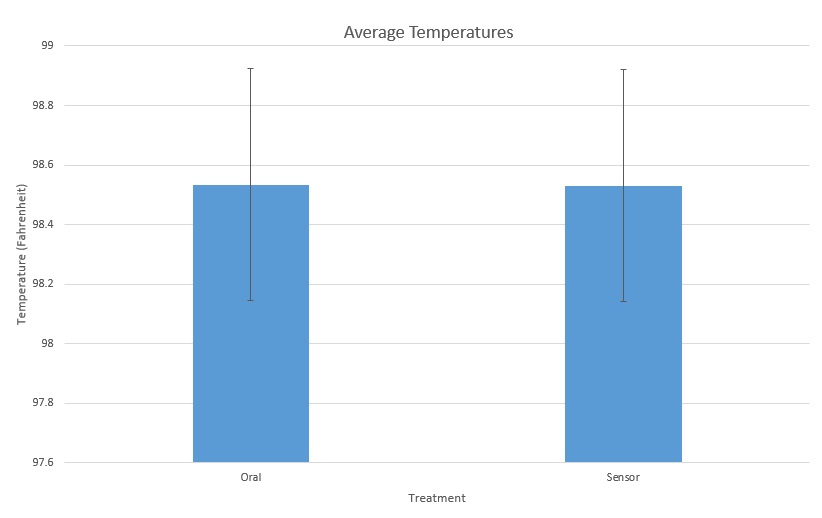
GraphThe above graph shows the average temperatures of both the oral thermometer and the Mother's Heart arm band. As shown above, the average temperatures are identical to each other. The above graph shows the relationship between the oral thermometer and the Mother's Heart arm band. The R-value signifies a positive correlation between the two data sets.
| |||||||


