BME100 f2013:W900 Group10 L2
| Home People Lab Write-Up 1 | Lab Write-Up 2 | Lab Write-Up 3 Lab Write-Up 4 | Lab Write-Up 5 | Lab Write-Up 6 Course Logistics For Instructors Photos Wiki Editing Help | |
|
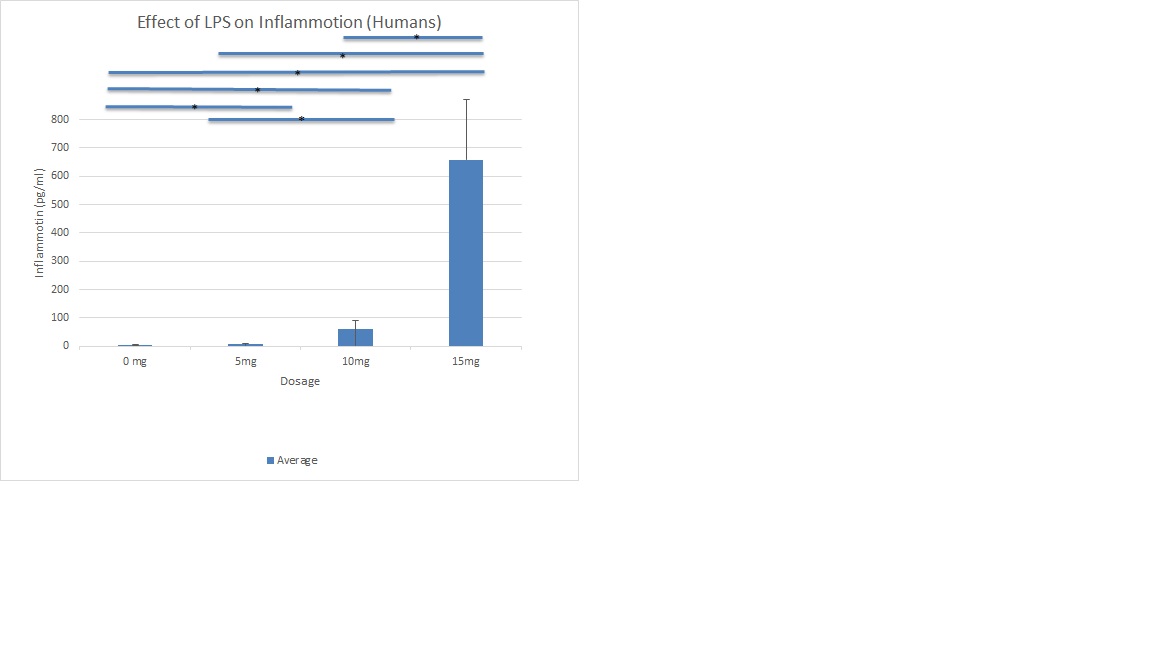
OUR TEAMLAB 2 WRITE-UPDescriptive StatisticsExperiment 1 TABLE 1: Results of data taken from human subjects representing the different inflammontin protein levels at four different dosage of lipopolysaccharide (LPS). TABLE 2: The mean and standard deviation of the inflammontin protein levels at dosage levels (0mg, 5mg, 10mg, and 15mg) of LPS. Column graph of the data is plotted below in Results.
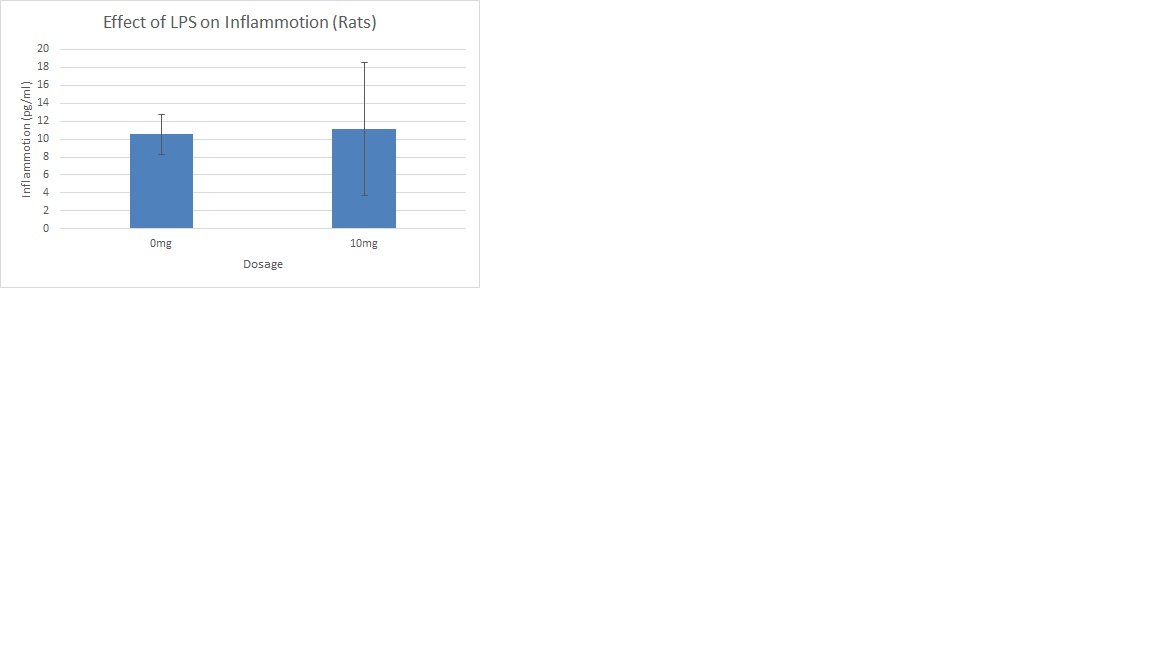
Experiment 2 TABLE 1: Results of data taken from rat study representing inflammontin protein levels the dosage of 0mg and 10mg of lipopolysaccharide TABLE 2: The mean and standard deviation of the inflammontin protein level from dosage levels of 0mg and 10mg of lipopolysaccharide. Column graph of data is plotted below in Results.
ResultsExperiment 1 Experiment 2
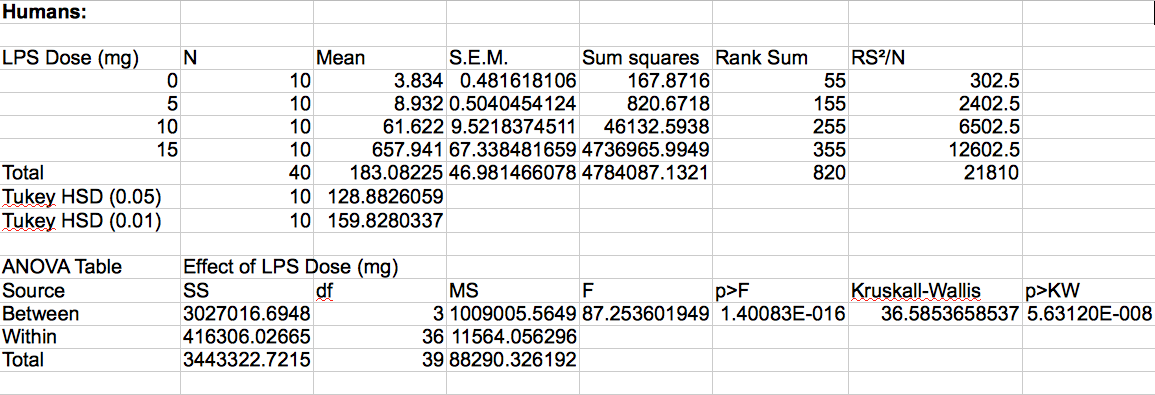
AnalysisExperiment 1 ANOVA: Post-Hoc test
T-Test:
Summary/DiscussionHuman Study: The analysis of the data shows a significant correlation between the dosage of lipopolysaccharide and the Inflammotin levels. The p-value from the ANOVA test shows that the largest within group variation is well within acceptable limits and the t-test shows a significant between group variation between all groups. Thus we can conclude that lipopolysaccharide does affect Inflammotin levels at all of the tested doses. Rat Study: The analysis of the data shows no correlation between the dosage of lipopolysaccharide and the Inflammotin levels. The t-test shows that there is no significance between group variation in the two dose groups. Therefore we have failed to disprove our null hypothesis and can say nothing about the correlation between lipopolysaccharide dose and Inflammotin levels in rats.
| |


