BME100 f2013:W1200 Group9 L3
| Home People Lab Write-Up 1 | Lab Write-Up 2 | Lab Write-Up 3 Lab Write-Up 4 | Lab Write-Up 5 | Lab Write-Up 6 Course Logistics For Instructors Photos Wiki Editing Help | ||||||
|
OUR TEAM
LAB 3A WRITE-UPDescriptive Statistics(Descriptive statistics for the data set)
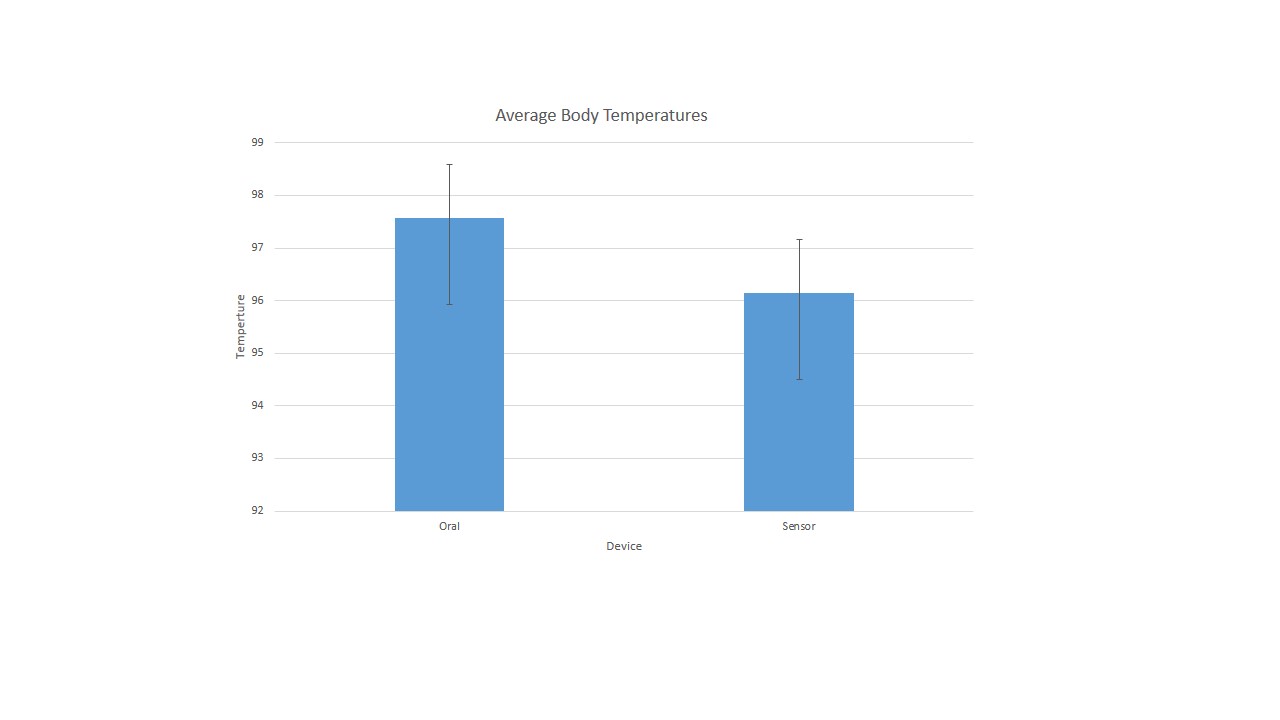
ResultsThe significance of the graph is to compare the average of the temperatures taken by the oral thermometer and the sensor device.
Analysis(Perform inferential statistics described in assignment.)
Summary/Discussion(Please discuss the results and statistical analysis. State your conclusion as well as design flaws and recommendations.) In this lab, we compared the accuracy of a sensor that measures body temperature with an oral thermometer. An oral thermometer is known as one of the most efficient ways to measure human body temperature so it was the best tactic to compare the sensor to. We took temperatures at two minute intervals indoors for ten minutes and then went outside and measured temperature every five minutes for an hour. After that, we returned to the lab and repeated the first round of testing. We collected the data for both the oral and the sensor thermometers and compared them with the rest of the class on one spreadsheet. After careful analysis of the data collected from the oral thermometer and the sensor, we were able to conclude that the sensor does not accurately measure body temperature in comparison to an oral thermometer. The P-value we calculated was <.05 which proves that the two sets of data are significantly different. At first glance, the data sets seem almost similar because the difference in average temperature was under two degrees. However, after doing a statistical analysis were able to come up with a more educated analysis. In conclusion, it was proven that the sensor device was not an accurate measurement of body temperature. Some design flaws would be the interference from other nearby sensors, as well as the need to be close to the Bluetooth source in order to have a recording. Another flaw is the attachment methods the sensor uses. The sticky pad that is used to adhere the device to the arm is flawed in many ways. It is painful to remove, can lose its adhesiveness and is limited to only one use. In order to fix these flaws, the device should come with individual codes, or name, so that when consumers try to connect to the sensor, it is ensured that they connect to the right one. To better the Bluetooth flaw, the device could have a larger range, or a direct way of communication from the device to the recording system.
LAB 3B WRITE-UPTarget Population and NeedThe target population is young, physically active adults and athletes although we will primarily target college students. The need is for a device that measures body temperature during physical activity and calculates a recommended amount of hydration the person should consume as compensation for the perspiration lost during activity. Depending on whether low impact or high impact activity is being performed, more or less ounces of hydration will be recommended.
Device Design
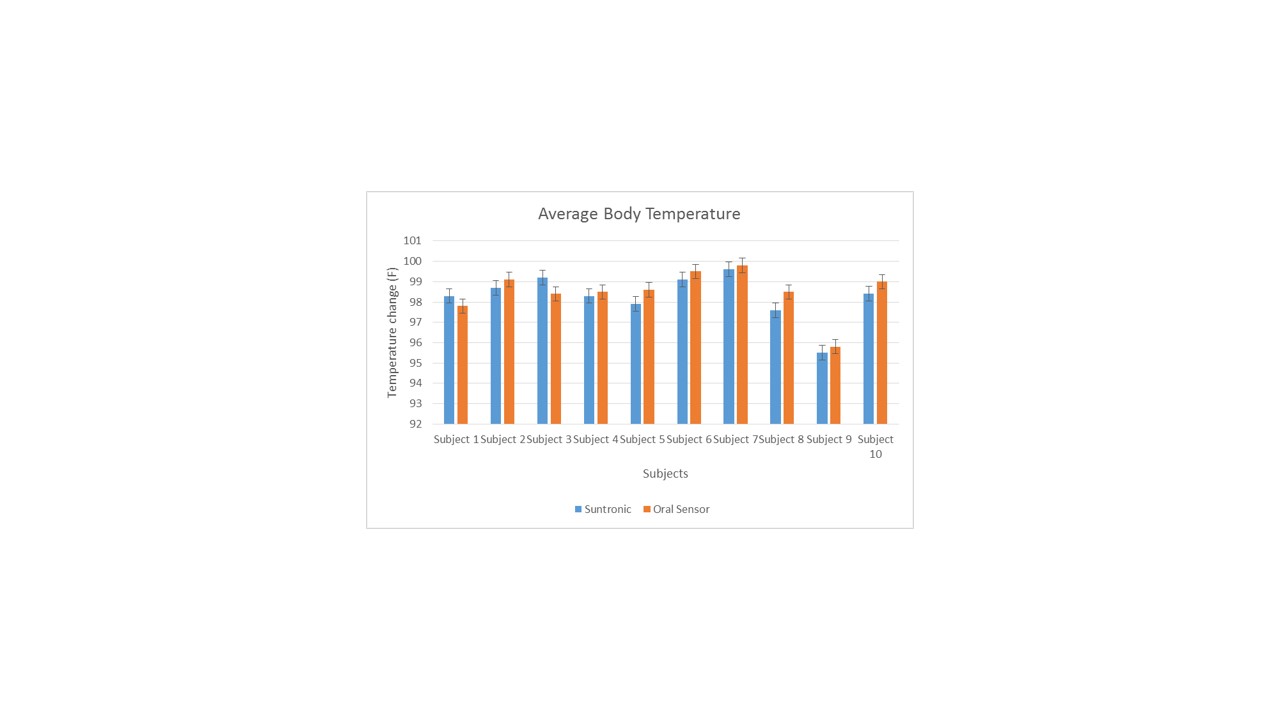
Inferential StatisticsThe Suntronic device seemed to accurately measure the temperatures when comparing the data of the device side by side with the oral thermometer, and when we found the average, standard deviation, and ran a Ttest, the p value ended up being greater than 0.05 proving that there is no statistical difference with the date collected. The new Suntronic deviced prove to be more accurate in measuring body temperature then the sensor we previously had tested. Not only is the new device accurate, but it is useful when working out and keeping yourself hydrated.
Graph
| ||||||


