BME100 f2013:W1200 Group7 L3
| Home People Lab Write-Up 1 | Lab Write-Up 2 | Lab Write-Up 3 Lab Write-Up 4 | Lab Write-Up 5 | Lab Write-Up 6 Course Logistics For Instructors Photos Wiki Editing Help | |||||||
|
OUR TEAM
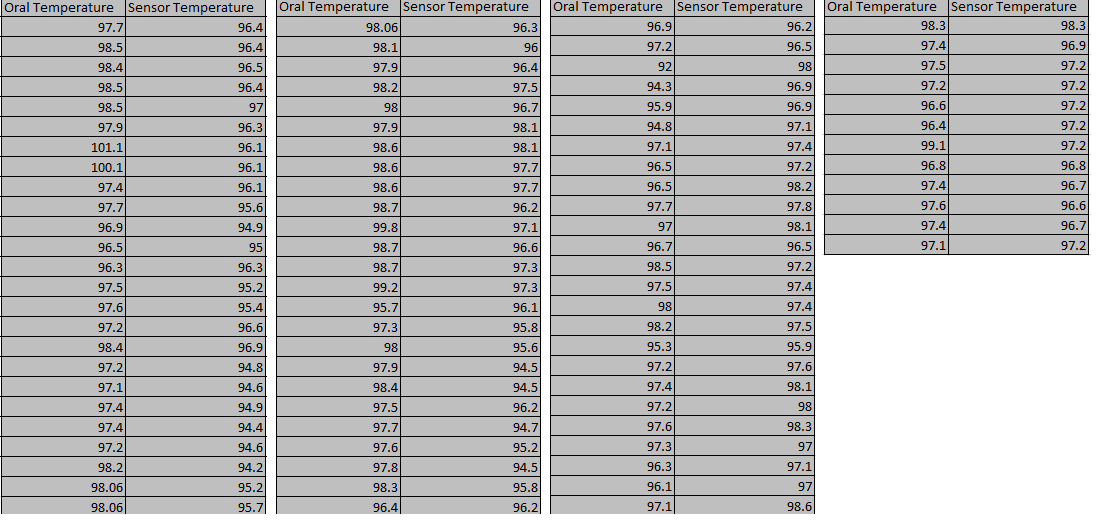
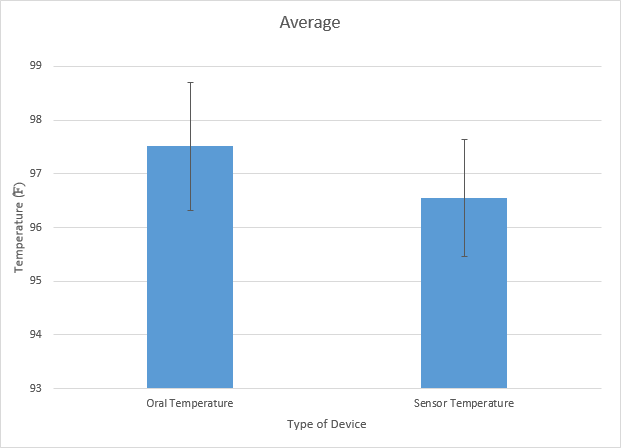
LAB 3A WRITE-UPDescriptive StatisticsOral Temperature and Sensor Temperature In the first experiment, we analyzed the temperature (oral and skin sensor app) of a human subject. The control (oral temperature of subject), had an average temperature of 97.51227273 and had a standard deviation of 1.19177037. The variable change (sensor temperature) had an average temperature of 96.55568182 and a standard deviation of 1.086157199. Both the groups had an endpoint of 88 The standard error that the control group had was 0.127043148 and the standard error the experimental variable had was 0.115784746. Also the Pearson r value came up as -0.082297737.
Results
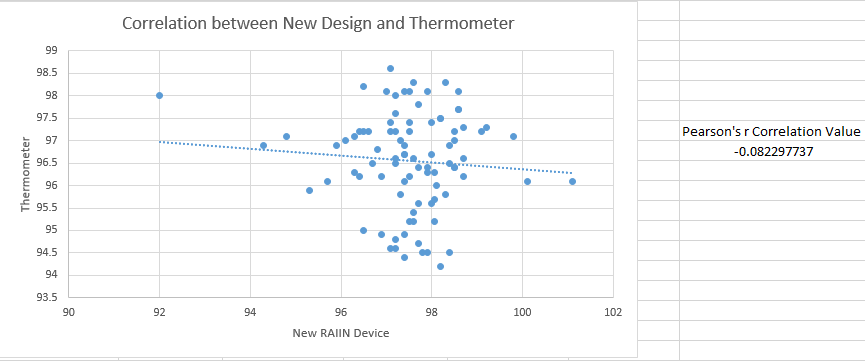
AnalysisAfter performing inferential statistics, we found that the new body temperature/sensor iphone app called Vitals Monitor with the RAIING device was not an effective product. Our experimental control was the measurement of temperature from the new device and our control was the oral thermometer. Since we had two variables to compare for accuracy, we performed the T-Test and got a p-value of 9.75162E-08. This p-value is less than 0.05 which means that the two data sets were statistically different. However, we wanted the p-value above 0.05 because then that would tell us that the data sets were close to each other indicating high accuracy of the new device. Since the p-value was less than 0.05, the temperatures readings were not close to the readings of the thermometer. Also, we found the Pearson's r correlation to be -0.082297737. This means the device readings and temperature readings were negatively correlated showing no similarities between the data sets. In order to know that the device was an effective product, the Pearson's r value should have been really close to 1.
Summary/Discussion
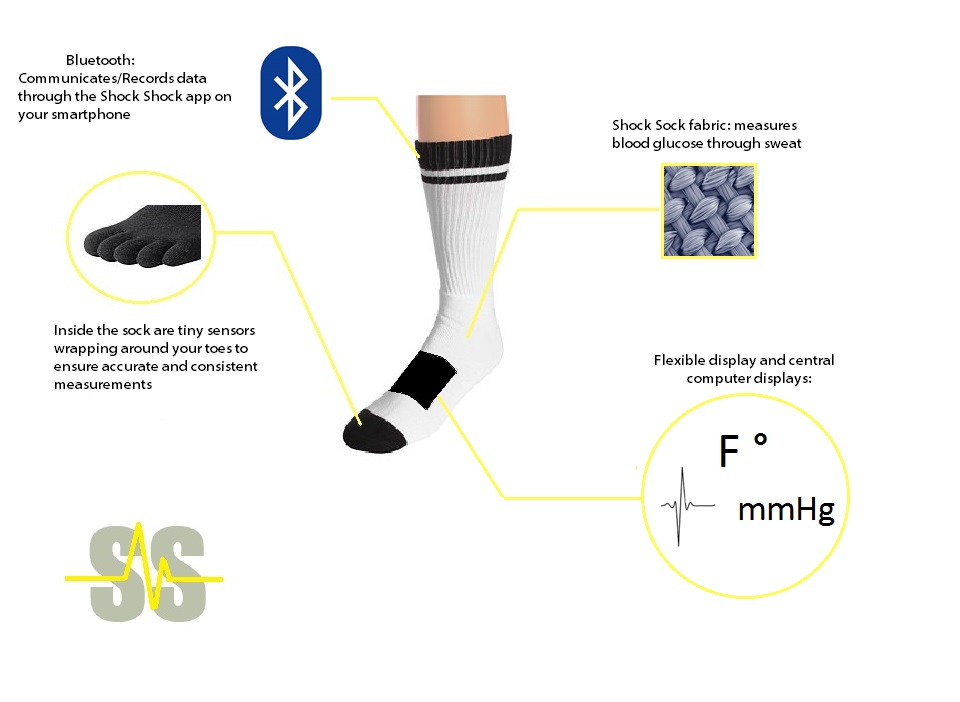
Flaws and Recommendations LAB 3B WRITE-UPTarget Population and NeedThe target population includes those who are interested in keeping better track of their general health (mainly adults), as well as those with any mild blood-pressure-related, cardiovascular, respiratory, and/or weight-related health issues. There are special modifications for the Shock Sock that are aimed specifically toward diabetics, the elderly, athletes, and infants. The main target population is the adults with health risks. The Shock Sock is focused on saving lives of all sorts of people. As said before it is good for athletic orientated people, infants, and adults. The Shock Sock is meant to provide an affordable, convenient way to measure vitals (and other possibly necessary things, such as speed and distance for serious athletes).
Device Design
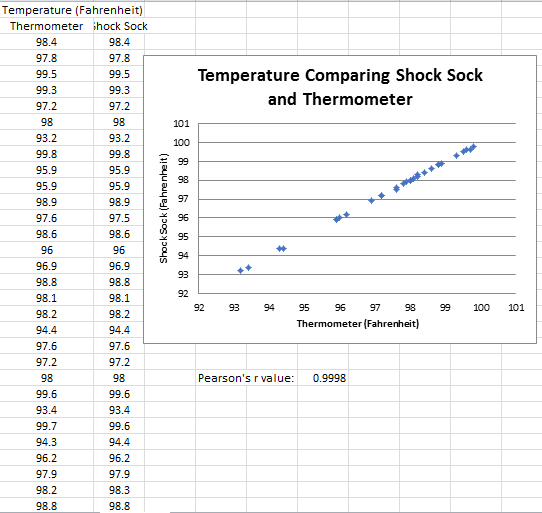
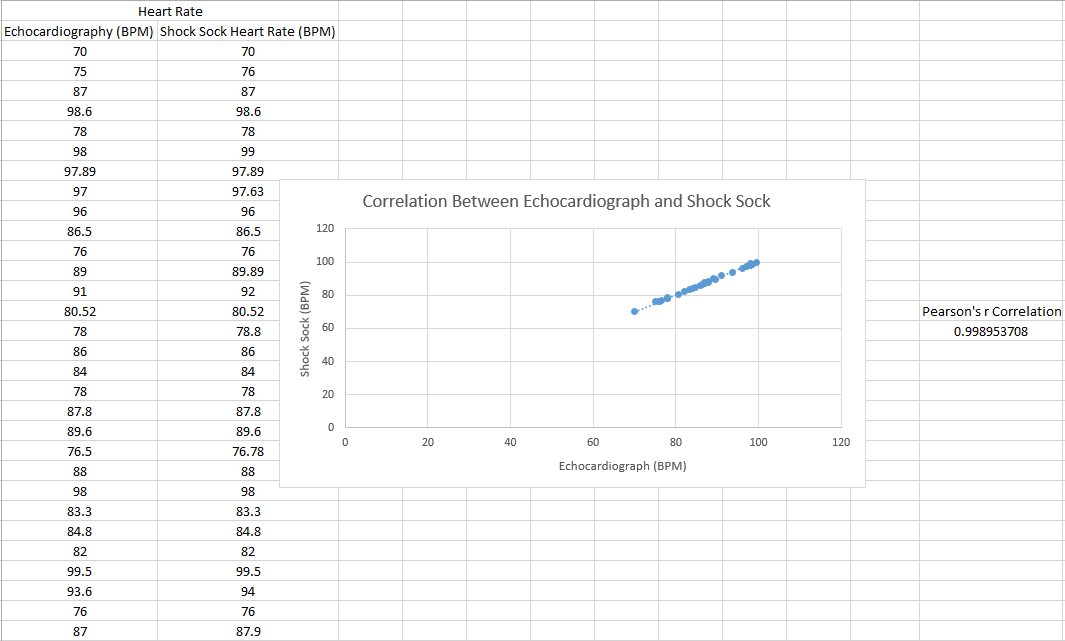
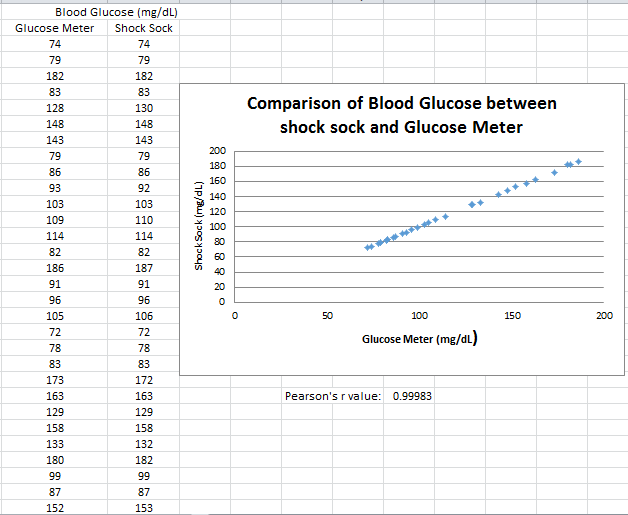
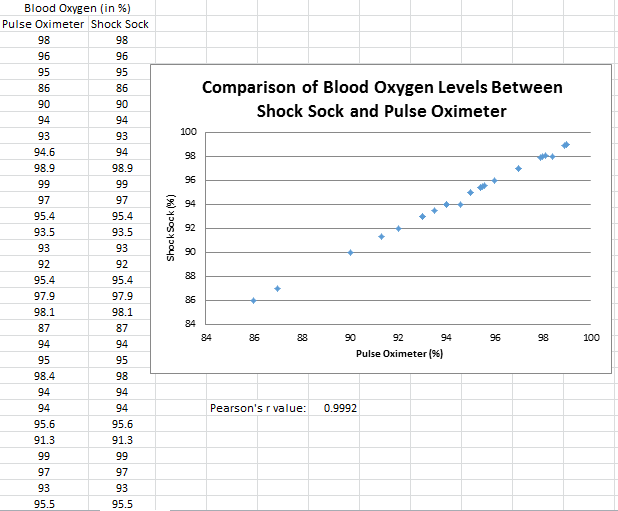
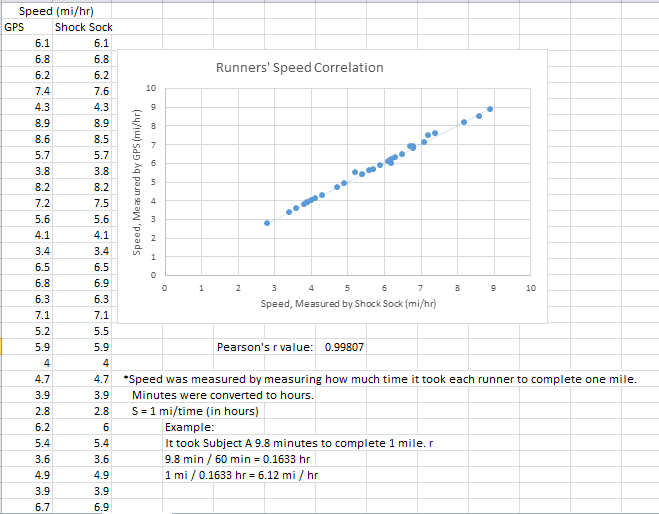
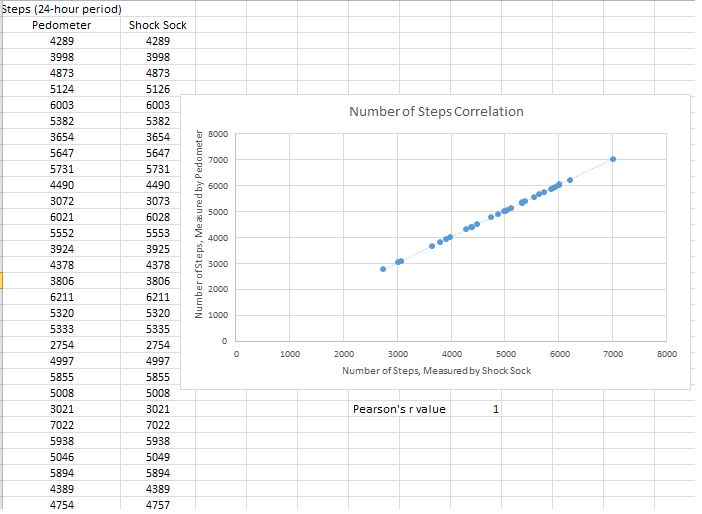
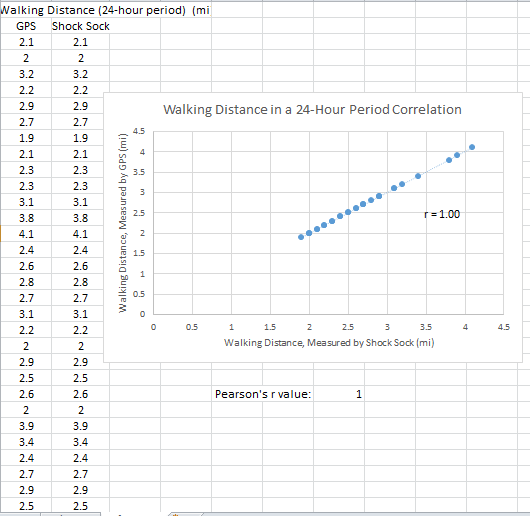
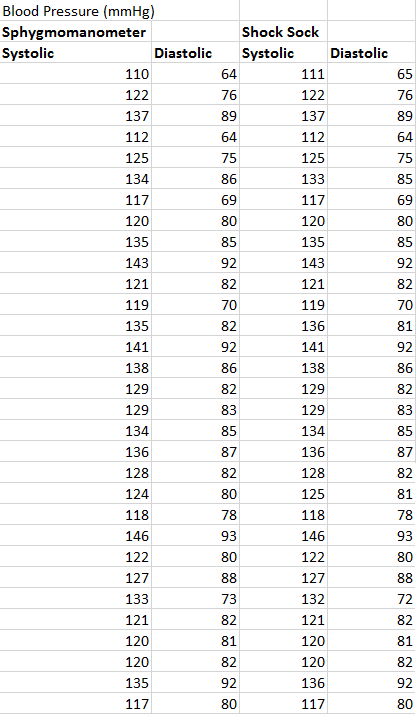
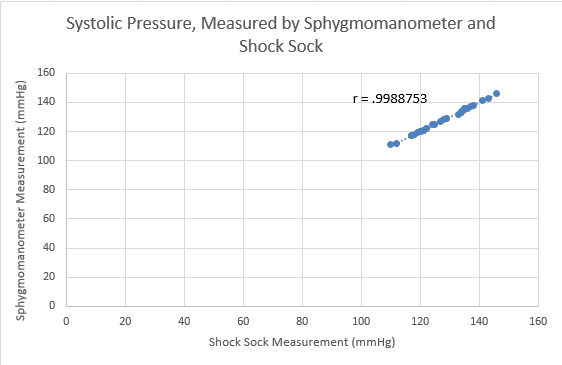
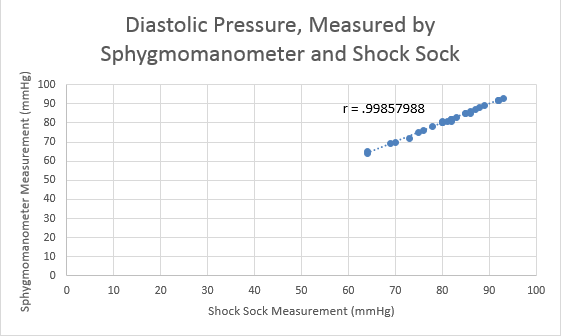
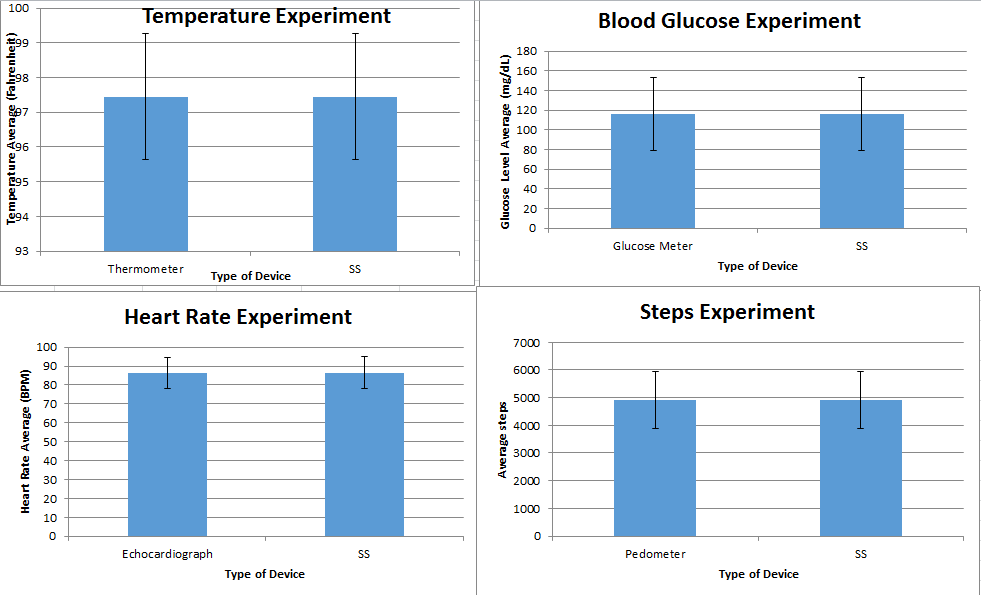
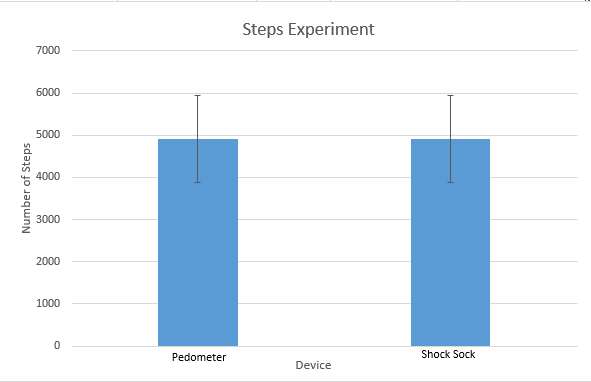
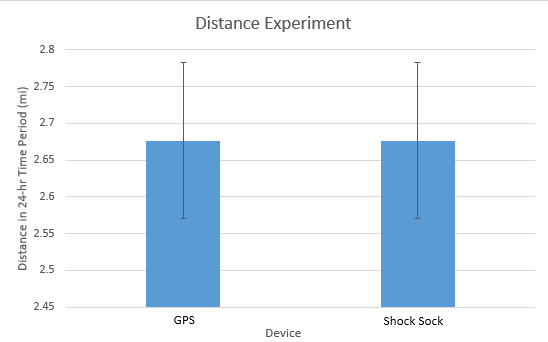
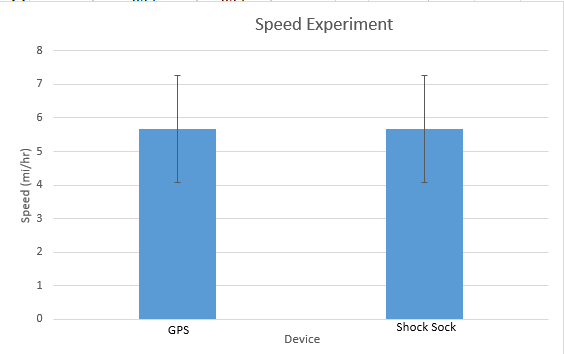
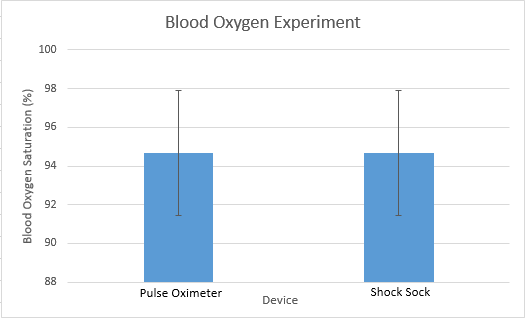
Inferential StatisticsThe inferential data above clearly shows that the shock sock is an effective product based on various experiments. The RAIIN device has no competition compared to our new product, the Shock Sock. From our data, we can see that our device not only measures temperature but all sorts of health tests. For every health test, we used the Shock Sock to compare to a device that was specifically designed to measure a health test (ex. Echo-cardiograph for heart rate or thermometer for temperature…). We then graphed scatter plots for all the different types of tests comparing our product with the other product and found the Pearson’s r value. For all of the comparisons, we got a correlation of 1 (or very close to one) which proves that the data provided by both products are the same and therefore confirmed that our product was accurate in measurement. We took the standard deviation of each data set and for each experiment, the standard deviation came to be same for both devices meaning there was little between group variance. We also performed T.Tests for every comparison and got a value that was greater than .05 which told us that there was no statistical difference between the two data sets. This again proved our product had high accuracy since the data was the same. Contributed by Carlee Farhar, Thalia Lebratti, and Ambar Khare
GraphContributed by Carlee Farhar, Thalia Lebratti, and Ambar Khare
| |||||||

