BME100 f2013:W1200 Group6 L3
| Home People Lab Write-Up 1 | Lab Write-Up 2 | Lab Write-Up 3 Lab Write-Up 4 | Lab Write-Up 5 | Lab Write-Up 6 Course Logistics For Instructors Photos Wiki Editing Help | ||||||
|
OUR TEAM
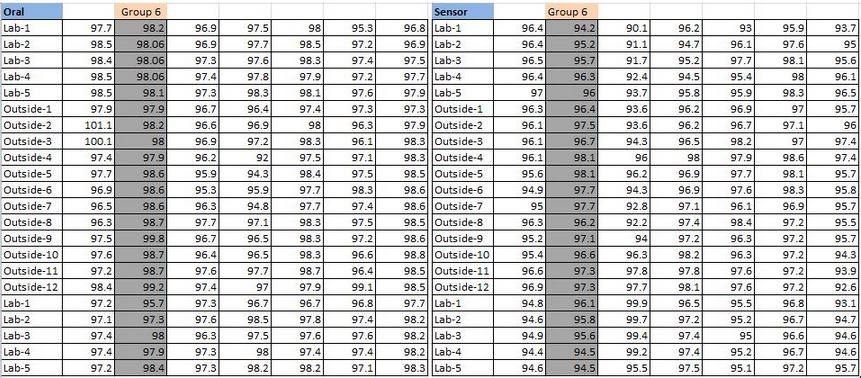
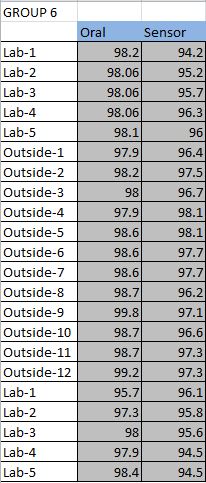
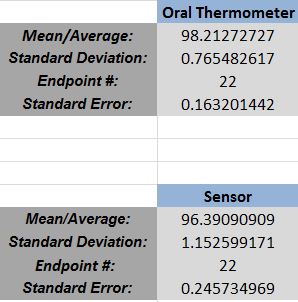
LAB 3A WRITE-UPDescriptive StatisticsBelow are temperature readings from the oral thermometer and RAIING device that were collected from 14 groups. Our group calculated the mean, standard deviation and standard error for both the oral thermometer and RAIING device. We also calculated the correlation coefficient (Pearson’s r) and t-test value between the two groups.
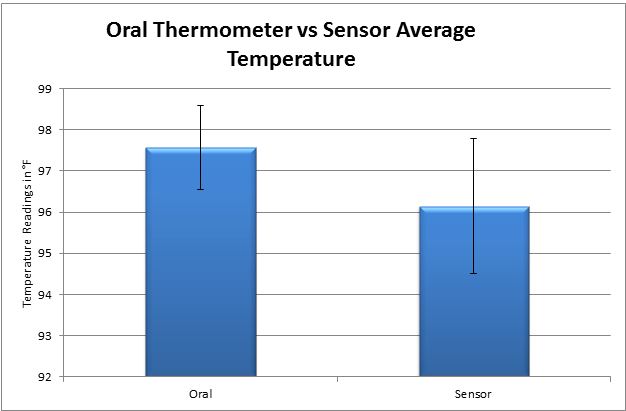
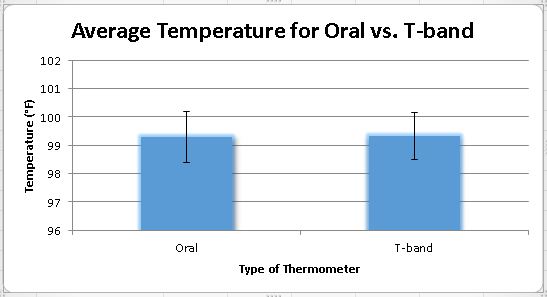
ResultsThe graph below illustrates the average temperature readings for both the oral thermometer and the sensor device. A standard error bar for each type of thermometer is also included. The error bar of the sensor device is higher in comparison to the error bar of the oral thermometer; this just proves that the sensor device gives inaccurate temperature readings.
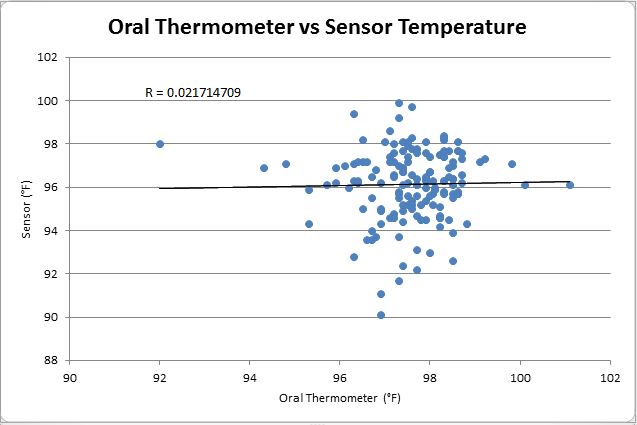
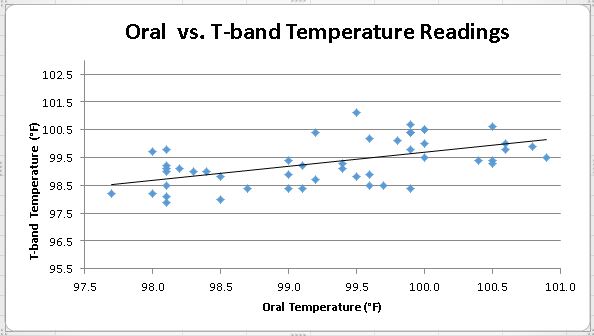
AnalysisOur group ran a T-test to determine if there is a statistical difference between the temperature readings of the oral thermometer and the RAIING thermometer sensor. The result of the T-test was a p-value of 8.04846E-18; this value is less than 0.05. Therefore, it can be concluded that there was significant difference between the temperature readings of the oral thermometer and the RAIING thermometer sensor. This shows that the RAIING thermometer sensor is not very accurate. Our group also calculated the Pearson's r-value to see if the two types of thermometer are directly linked, the Pearson correlation coefficient was 0.021714709. We created a scatter plot using this information, and as depicted below there is a weak positive relation between the temperature readings of the oral thermometer and the RAIING thermometer sensor.
Summary/DiscussionDesign flaws include the following: Recommendations on how we could improve the device: Overall, the RAIING sensor was shown to have a high standard error in relation to the oral thermometer. With a p-value less than .05, there is a significant difference between the actual and experimental values for the body temperature of our subjects. Furthermore, the sensor is not adequate technologically with the difficulty in connecting through bluetooth. There are some major design flaws that should be fixed and looked at for improvements.
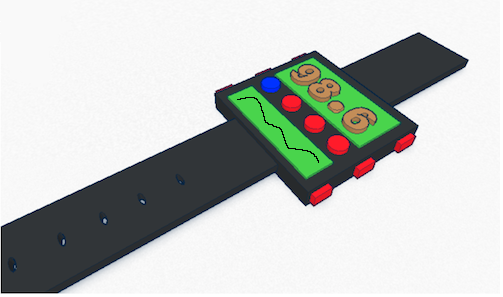
LAB 3B WRITE-UPTarget Population and NeedThe targeted population for our T-Band product is towards anybody that has the use to measure their temperature constantly over a period of time. Such as concerned parents who want to constantly measure the child's fever over night, to make sure it does not go over the precautionary limit. Also can be of use to anyone that works out and wants to have their body temperature measured so they do not overheat during their exercise.
Our product will be available in all sizes, including children's and adult's.
Device DesignSlogans:
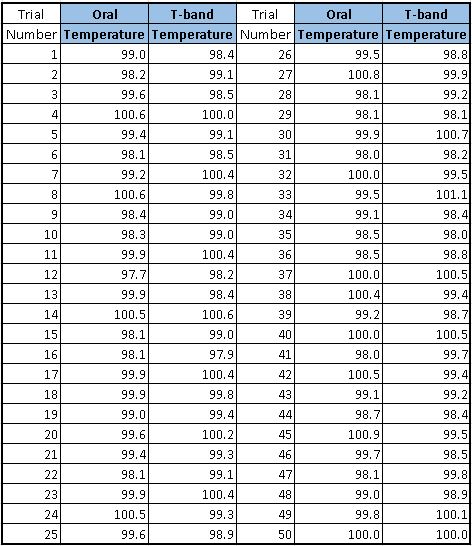
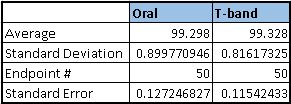
Inferential Statistics
Graph
The graph shows a linear relationship between the orally temperature and the T-band temperature. The R value of 0.55 confirms that there is a linear relationship between the oral and the T-band sensor's temperatures.
| ||||||

