BME100 f2013:W1200 Group4 L3
| Home People Lab Write-Up 1 | Lab Write-Up 2 | Lab Write-Up 3 Lab Write-Up 4 | Lab Write-Up 5 | Lab Write-Up 6 Course Logistics For Instructors Photos Wiki Editing Help | ||||||
|
OUR TEAM
LAB 3A WRITE-UPDescriptive Statistics
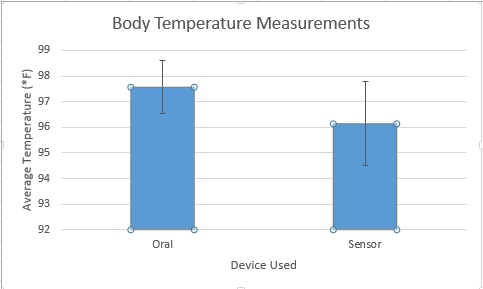
ResultsThe graph illustrates the comparison of the readings from the oral thermometer and the sensor and shows the accuracy of the product.
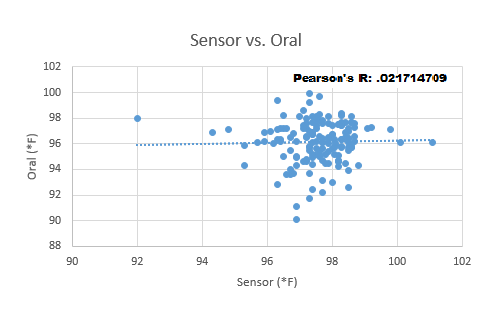
AnalysisCorrelation Coefficient: 0.021715 Pearson's R value is 0.021715 which is very close to zero. This means there is no correlation between body temperature measured by the sensor and body temperature measured my the oral thermometer. This shows that the sensor does not accurately measure body temperature over a period of time. The p-value is approximately 8.0486E-18. There is a statistical significance in this experiment because the calculated p-value is under 0.05. This shows that there is a difference between the body temperature measured by the sensor and body temperature measured by the oral thermometer. This shows that the sensor is not a reliable measure of body temperature.
Summary/DiscussionAfter a considerable struggle, we were successful in pairing the device with the app over bluetooth. Once paired, the device failed in relaying data information across the connection to the phone and gave no body temperature. We attempted to use a new device, but it was unable to even connect over bluetooth through the app on the phone. After some time trying to connect, the device no longer turned on and we were unable to collect data. The main system that the device is designed to function on, bluetooth, is inconsistent and unreliable. Improving the bluetooth connectivity, and the ability of the device to transfer data accross the connection is the biggest issue. The battery power and retention is also an issue that needs to be resolved for the device to be improved. The device is also large and uncomfortable to wear, therefore it is not practical for everyday use. This device is unreliable and doesn't produce the expected results. Not only was the product unreliable, even when it was functioning, it wasn't recording temperature accurately. The p-value was 8.0486E-18. This figure is less than 0.05, making it a statistically significant difference, and showing that the product is not a reliable source of information on a person's body heat.
LAB 3B WRITE-UPTarget Population and NeedHeats Headphones are an efficient and efficacious method of measuring body temperature using a tympanic sensor. The product is targeted towards anyone doing athletic activity, such as runners, hikers, skiers, snowboarders, students walking around campus, and anyone who stays outside in the heat or cold for long periods of time. A body temperature monitor is very necessary for those who love spending time outside, and many people also enjoy listening to music as they exercise. Earbuds containing body temperature readers provide a portable and convenient way to track one's body temperature, a necessity for people who are outdoors or performing athletic activity. It will allow the user to monitor their body temperature over long periods of time in hopes of avoiding dehydration or heat exhaustion. In 2001 alone, approximately 300 Americans died from excessive heat exposure because they're bodies couldn't compensate for the extreme conditions. If people were to monitor their body temperatures to avoid becoming hyperthermic or hypothermic, they could potentially avoid catastrophic and irreparable damage to their bodies.
Device DesignThe ear bud piece of the headphones would contain a sensor that measures body temperature. This will allow for a quick and accurate tympanic temperature reading. The information from the sensor would be transmitted to a small processor attached to the cord of the ear buds. This processor will display the current body temperature of the user. If the user's body temperature increases or decreases to a dangerous level, the processor sets of an alarm to inform the user they need to slow down, and cool off or warm up. An app is also available that can link with the processor and record body temperatures over a period of time. The user can then look at their body temperature trends and see a graph of their different body temperatures over an extended period.
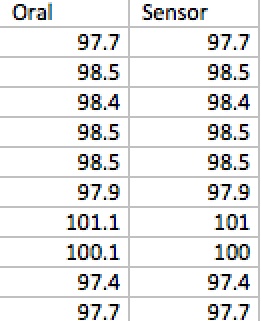
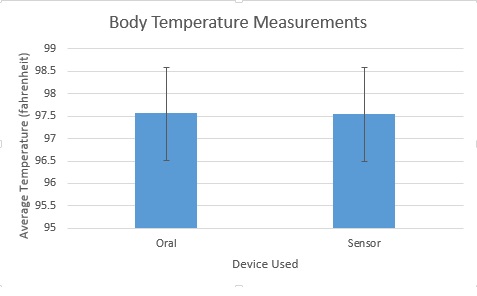
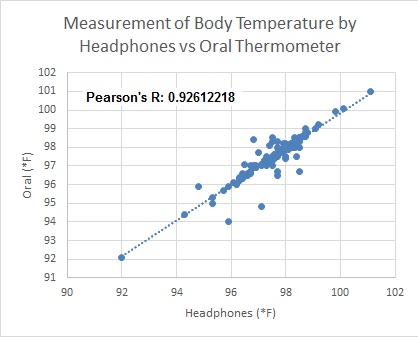
Inferential Statistics and Data SetSample of Data After running a T-test, the p-value was calculated to be 0.73024611. There is no statistical significance in this experiment because the calculated p-value is over 0.05. This shows that the headphone sensors measure body temperature very similar to the oral thermometer. This makes the headphones a reliable way to measure body temperature. Pearson's R Coefficient was calculated to be 0.92612218. This value is very close to 1 which means there is a positive correlation between body temperature measurements taken by the headphones and body temperature measurements taken by the oral thermometer. This shows that most of the time the headphones measure body temperature as accurate as an oral thermometer.
Graph
| ||||||


