BME100 f2013:W1200 Group2 L2
| Home People Lab Write-Up 1 | Lab Write-Up 2 | Lab Write-Up 3 Lab Write-Up 4 | Lab Write-Up 5 | Lab Write-Up 6 Course Logistics For Instructors Photos Wiki Editing Help | ||||||
|
OUR TEAM
LAB 2 WRITE-UPDescriptive StatisticsExperiment 1 - Human Study
Standard Deviation Values
Standard Error Values
Standard Deviation Values
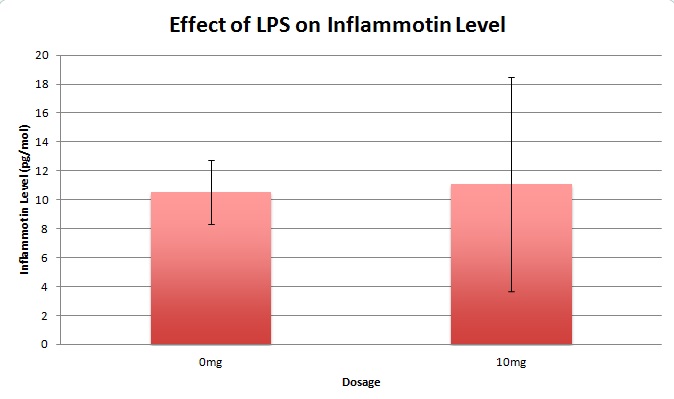
Standard Error Values The T-test results were insignificant because it was more than the the p-value of 0.05. The T-test results were 0.867. (Please report descriptive statistics for both experiments. Please calculate descriptive statistics in Excel.)
ResultsExperiment 1 - Human Study
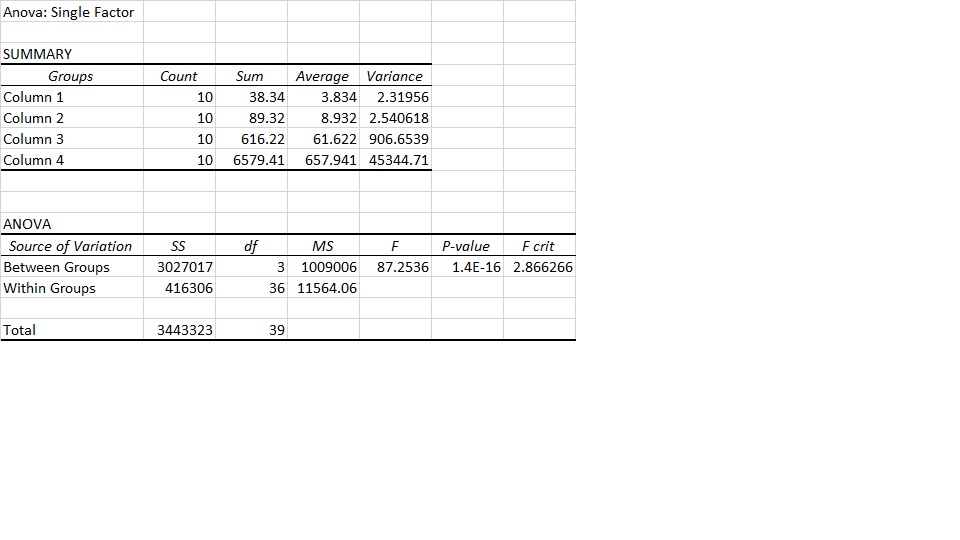
AnalysisExperiment 1 - Human Study Experiment 2 - Rat Study (Using inferential statistics, please determine statistically significant differences in the data.)
Summary/Discussion(Please discuss the results and statistical analysis from both experiments. State your conclusion.) - There is a great difference of the Inflammotin levels over a dosage of 10 mg in Humans.There is not much difference in between the dosages of 0 mg and 5 mg also in the Human Study.
| ||||||


