BME100 f2013:W1200 Group1 L3
| Home People Lab Write-Up 1 | Lab Write-Up 2 | Lab Write-Up 3 Lab Write-Up 4 | Lab Write-Up 5 | Lab Write-Up 6 Course Logistics For Instructors Photos Wiki Editing Help | ||||||
|
OUR TEAM
LAB 3A WRITE-UPDescriptive Statistics
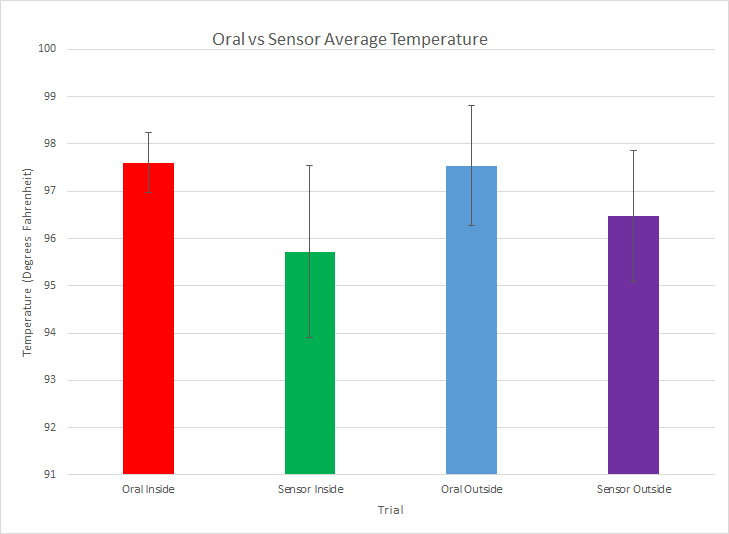
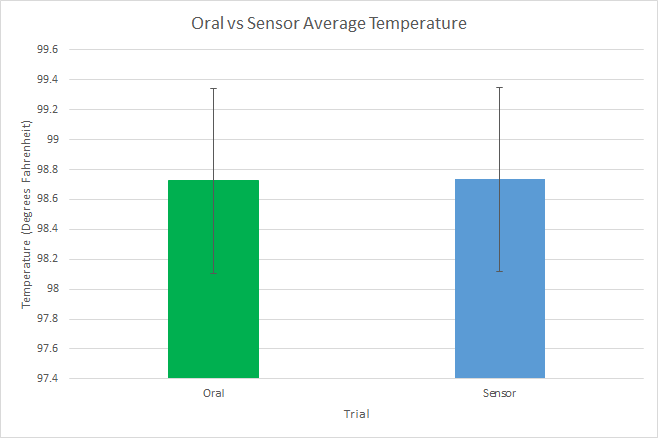
ResultsThe graph above shows the average temperature for the sensor and oral thermometer both in an inside and outside environment. As it is depicted with the error bar for each trial, there is a higher range for error in the sensor compared to the oral thermometer.
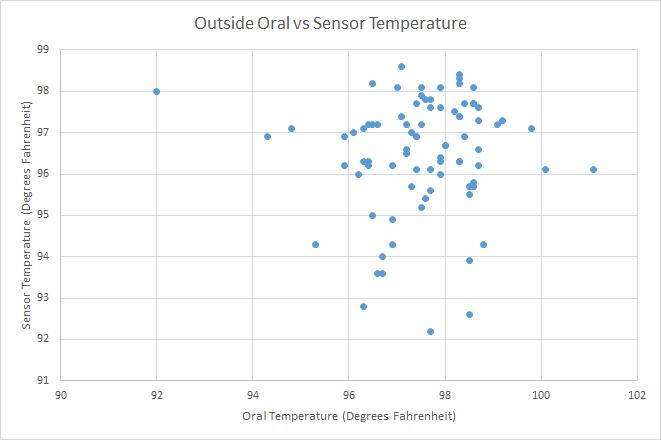
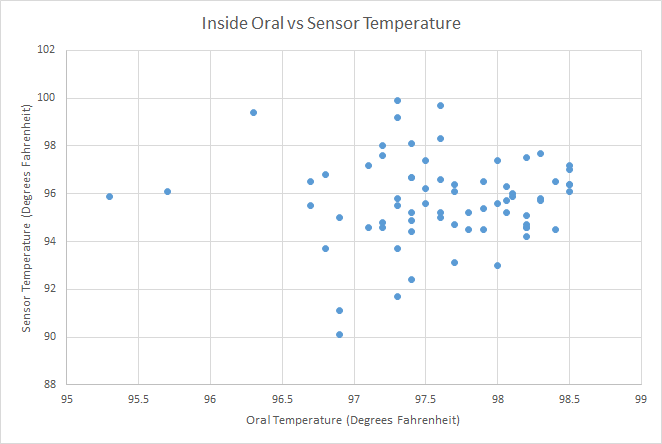
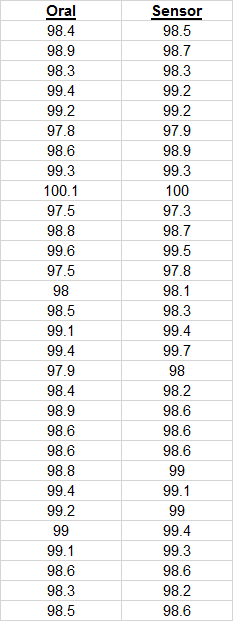
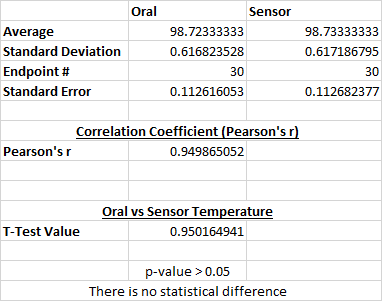
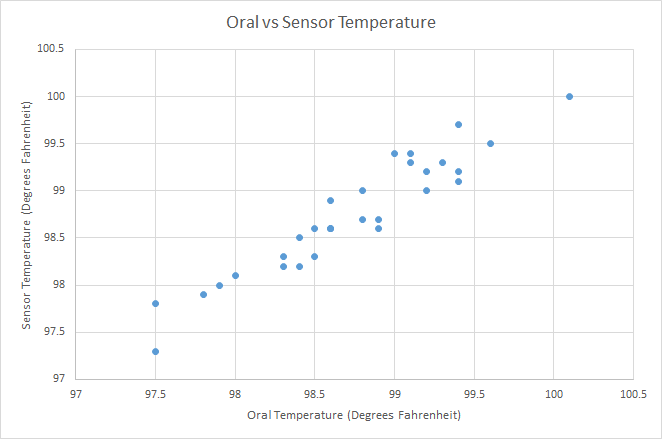
AnalysisIn order to compare the sensor directly to the oral thermometer, two scatter plots were created with the collected data from the trial. The first graph compares the sensor and oral thermometer in an outside environment. The second graph compares the sensor and oral thermometer in an inside environment. Both graphs do not show any direct correlation for the sensor and oral thermometer. In order to prove this, the correlation coefficient was calculated using the Pearson's r. The Pearson's r value for the inside trials came out to 0.03194358. The Pearson's r value for the outside trials came out to be 0.33009974. In addition, a T-Test was performed to compare the overall oral thermometer temperatures to the sensor temperatures. The p-value calculated from the T-Test was 8.04846*10^-18. Because this p-value is less than 0.05, there is a statistical difference between the data. Thus, the sensor does not seem to be accurate when measuring temperature.
Summary/DiscussionIn order to determine the accuracy of the underarm temperature monitor created by RAIING, the device was compared to an oral thermometer by being tested in differing conditions over the course of about an hour and a half. Five temperatures were taken inside the lab every two minutes using both the device and the oral thermometer at the same time. Then, twelve temperature measurements were taken every five minutes outside while walking around with both the device and oral thermometer. Finally, five last temperatures were taken back inside the lab every two minutes again with both the device and oral thermometer. Because two of the nine devices failed (sensors on the device didn't accurately work and they didn't correlate with the results from the oral thermometer), the calculations were only run on seven of the devices. After creating graphs to depict the data from the trials and running a Pearson's r correlation coefficient test and a T-Test, the oral thermometer can directly be compared to the sensor device in terms of accuracy. The p-value calculated from the T-Test was less than 0.05, which means that the device is not statistically accurate. In conclusion, the underarm sensors from RAIING are inaccurate and are not reliable. One flaw is that the sensor just is not accurate. It never recorded the same temperatures as the underarm thermometer. This may be because the sensor was not properly attached to the underarm. To solve this problem, an arm band, similar to an iPhone running band, would make it very easy to attach the underarm thermometer. Additionally, the Bluetooth transmission was not that good. There were too many devices in a close proximity to properly connect to the sensor and get accurate readings. A better data transmission technology, such as radio transmission, would improve the product by increasing range and reliability.
LAB 3B WRITE-UPTarget Population and NeedThe product will be marketed to parents of young athletes - specifically, to parents who are concerned about the health of their children. It will monitor the child's temperature by sending realtime data as he/she performs his/her athletic activity. Concerned parents who's children participate in athletics in hot climates will be able to monitor the body temperature of their kids, ensuring that their children do not experience heat stroke or heat exhaustion.
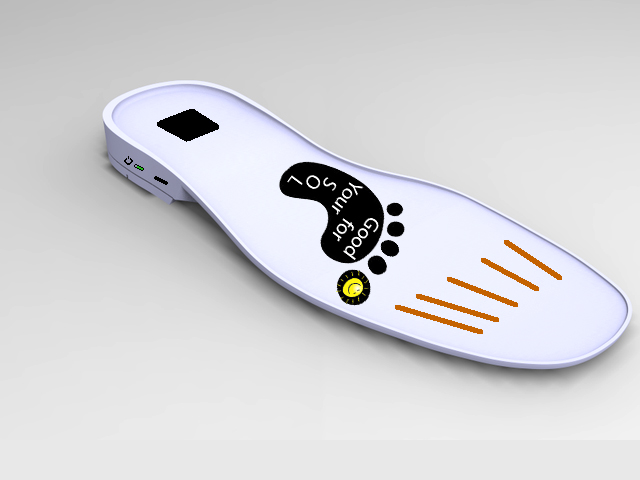
Device DesignThe device, which will resemble an ordinary shoe sole, will be comprised of mainly two parts. There is a small plastic box, which is inlaid (so the user does not feel it) into the rear of the sole that houses the battery and radio transmitter. There are also five thin copper sensors near the front of the sole that sense the temperature of the user. The sensors are connected to the transmitter by wires that run through the inside of the sole and are not externally visible. On the back right portion of the sole, there is a small power button that displays the battery percentage when the device is on. Next to the power button, there is also a charging port for the battery. The sole will be made of a high quality fiber infused with gel, ensuring that it is comfortable, durable, and strong. This device replaces the insole of the athlete's shoe and is easily installable and removable.
Inferential Statistics
Graph
| ||||||


