BME100 f2013:W1200 Group18 L3
| Home People Lab Write-Up 1 | Lab Write-Up 2 | Lab Write-Up 3 Lab Write-Up 4 | Lab Write-Up 5 | Lab Write-Up 6 Course Logistics For Instructors Photos Wiki Editing Help | |||||||
|
OUR TEAM
LAB 3A WRITE-UPDescriptive StatisticsInside #1: Outside: Inside #2:
Results(Well-labeled graph with error bars and significance)
AnalysisPearson's r Correlation
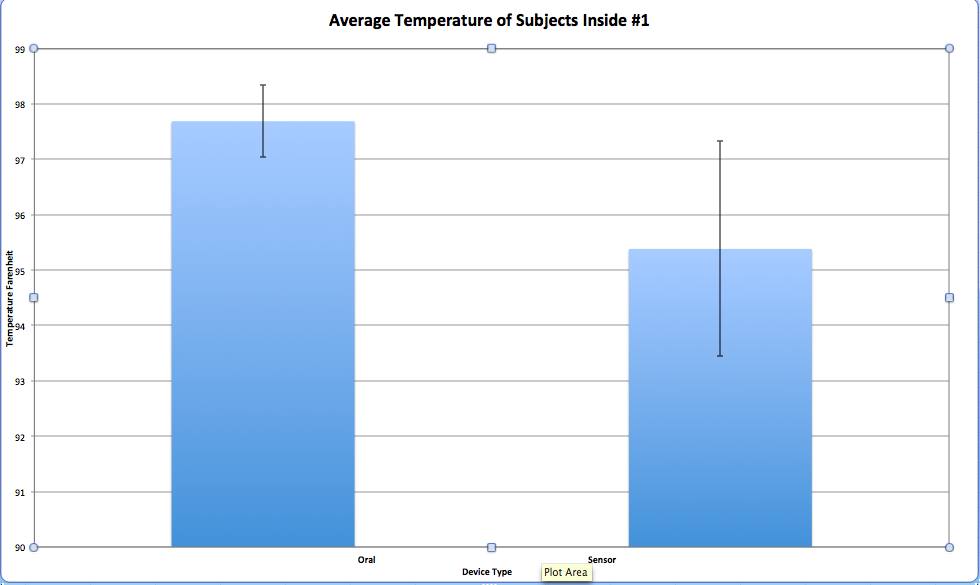
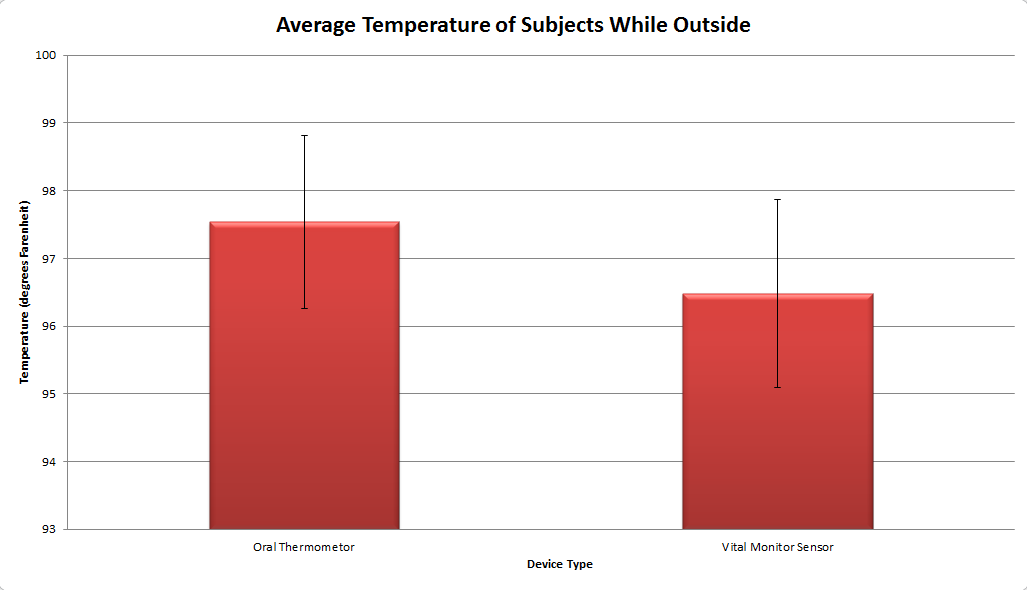
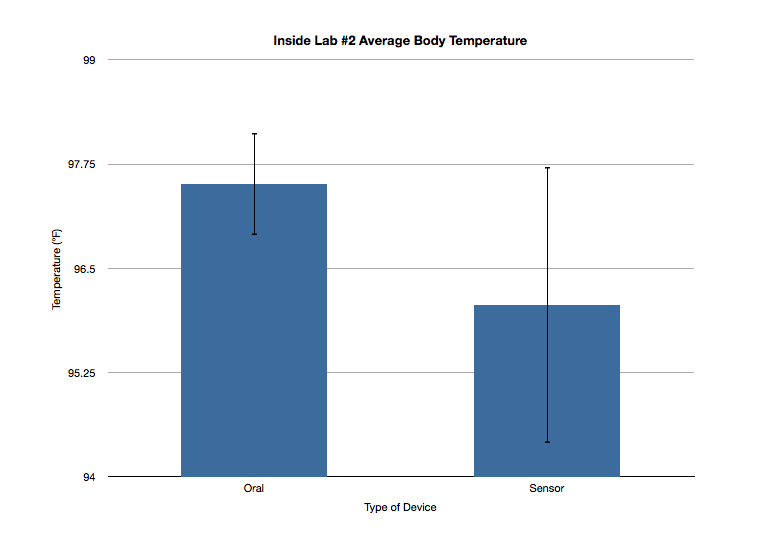
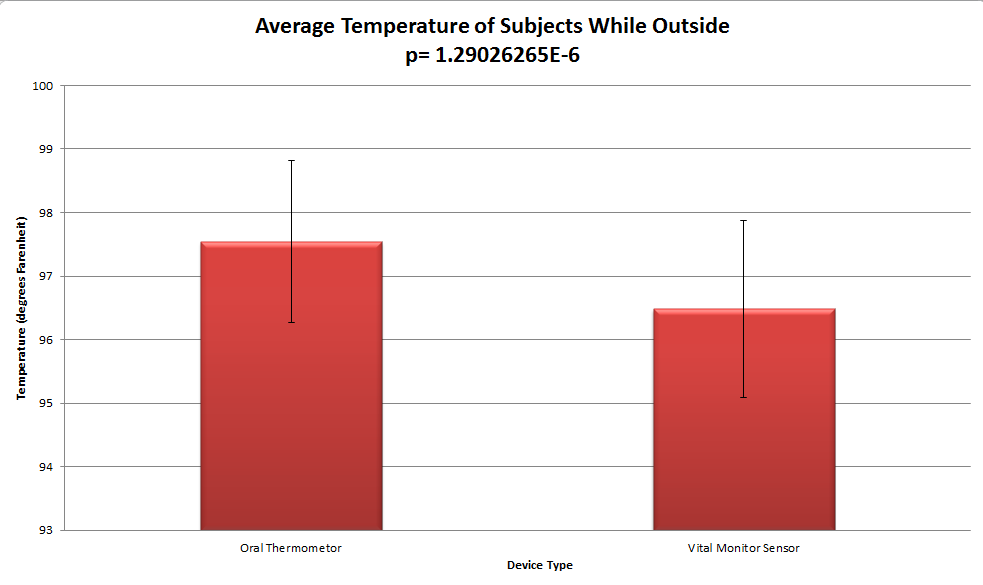
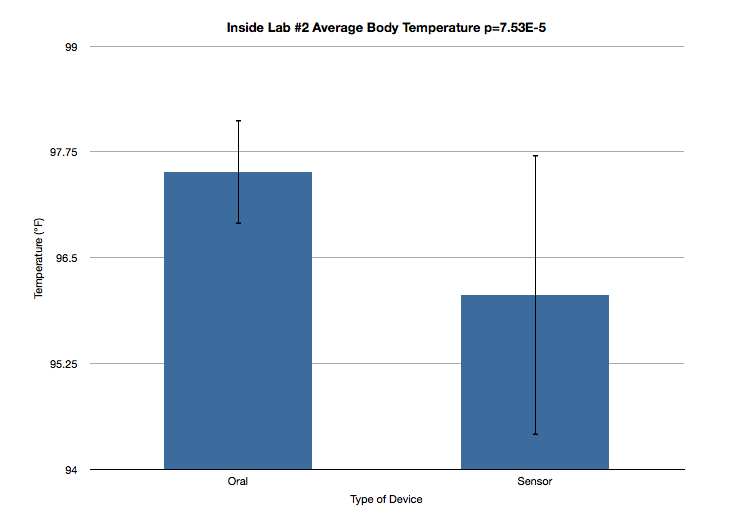
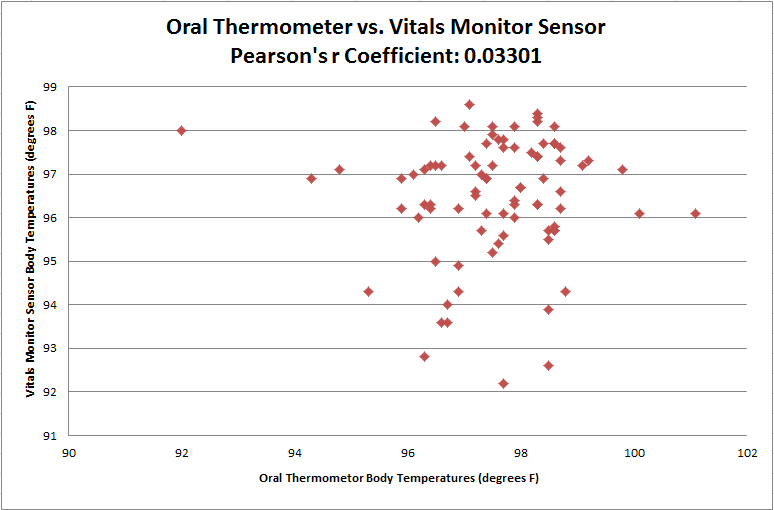
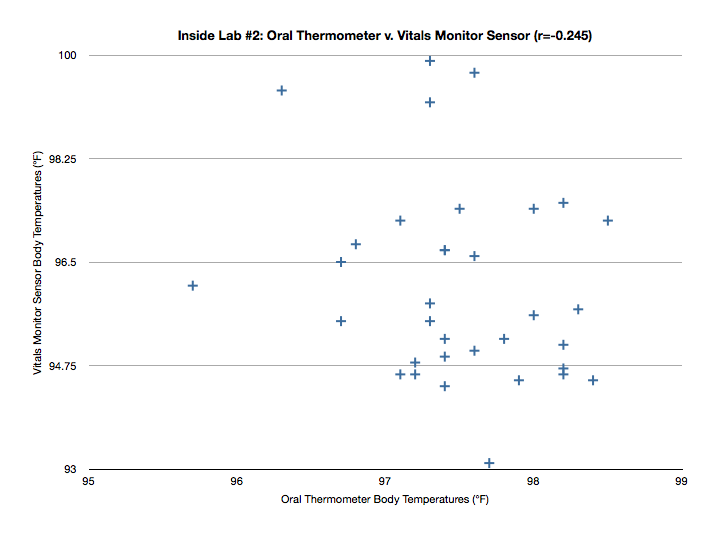
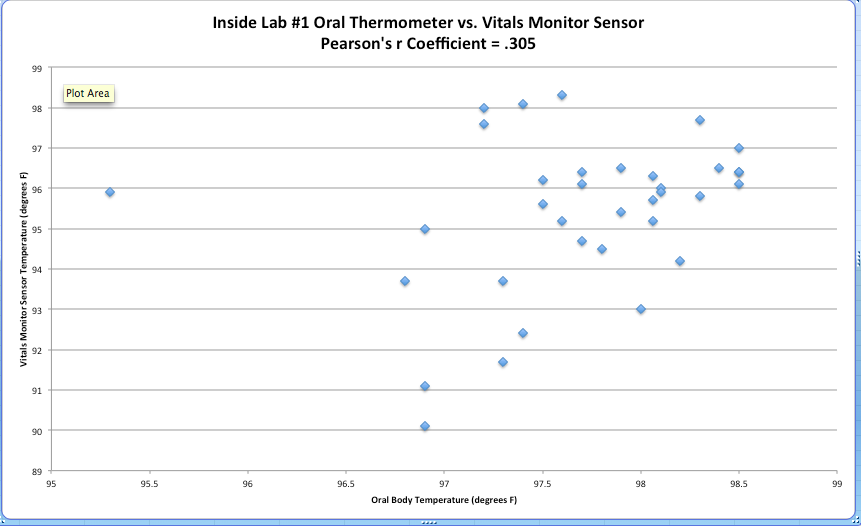
Summary/DiscussionA thermometer manufactured by Raiing claims to have the ability to measure temperature then wirelessly communicate the results to a smart phone with pristine accuracy(.1-2 degrees within the actual temperature). In order to test whether or not it's worth the eighty dollars to purchase and receive a correct reading, our group will test the measure of the sensor thermometer against the measure of an oral thermometer over a period of time. Testing the two simultaneously should reveal whether or not having a device like the wireless thermometer is even beneficial. If the two aren't showing the same relative reading, then it can be concluded that the sensor is not as accurate as Raiing claims it to be. According to results in the actual final measures, the sensor was not as effective as Raiin had claimed. The sensor was consistent, but was consistently several degrees off from the oral thermometer. As said before, had the sensor been within a tenth of a degree or so, spending the money on the device would be worth the price. When T-Tests were run to obtain P-Values for each difference in the average temperature, the values calculated were supportive of the faults in the sensor. Every P-Value calculated (Inside #1, Outside, and Inside #2) was significantly under 0.05 demonstrating a significant difference in the two devices. Additionally, the Pearson's r correlations for the inside trial #1, outside trial and inside trial #2 were respectively 0.305, 0.03301 and .245. For this experiment, the ideal Pearson's r is 1. Because the collected values deviated significantly from 1, it can be concluded that the correlation between the proven oral thermometer and the sensor is not nearly enough to trust the tested sensor device in place of the proven device. The sensor is not worth the money Raiing is asking nor is it effective. An observation frequent in this experiment was that the sensor actually stopped working and stopped communicating body temperature to the device receiving the sensor's readings. The fact that the device even failed reinforces our conclusion that it really isn't a valuable purchase. The first change we would make to the sensor would be its bulkiness. Having a smaller transmitter and a smaller thermometer would be easier to but in a spot in which a better reading is more possible. If that were the case, it could actually be placed in the armpit or behind the ear. Having a more sensitive sensor would also improve the reading that consumer would receive on their device; which is what the sensor is supposed to and should be doing in the first place. The final most important piece of the design that could be changed to increase the efficiency, is the strength of the transmitter to the receiving device. Better communication can really do no wrong.
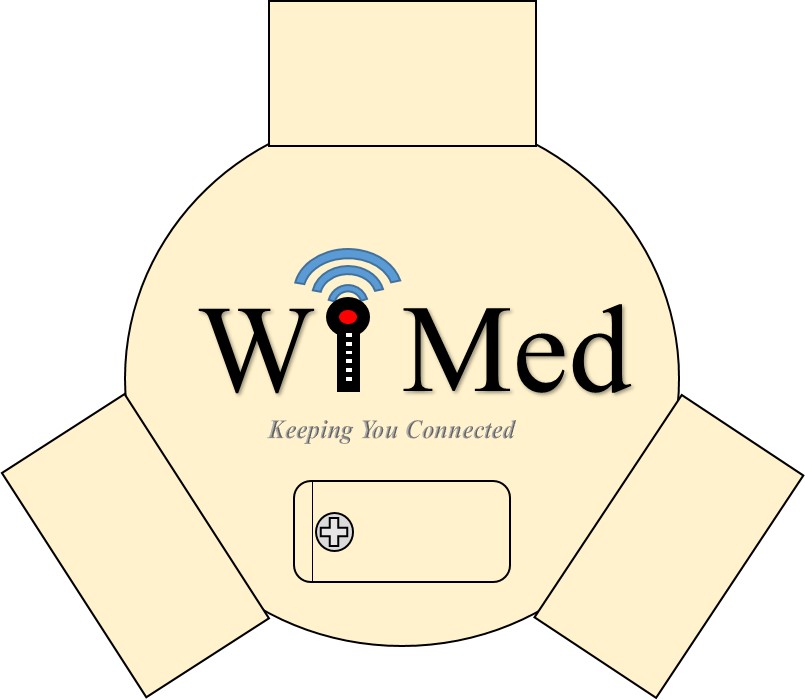
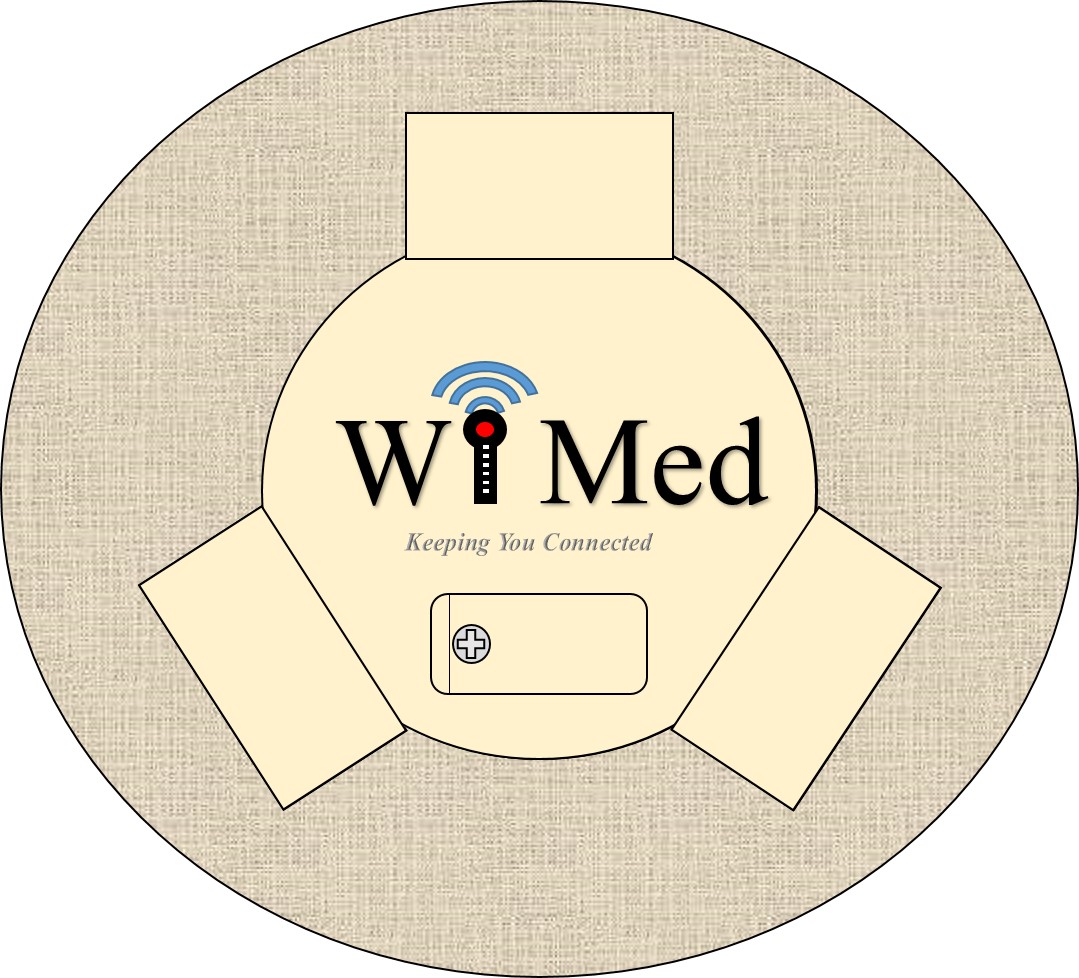
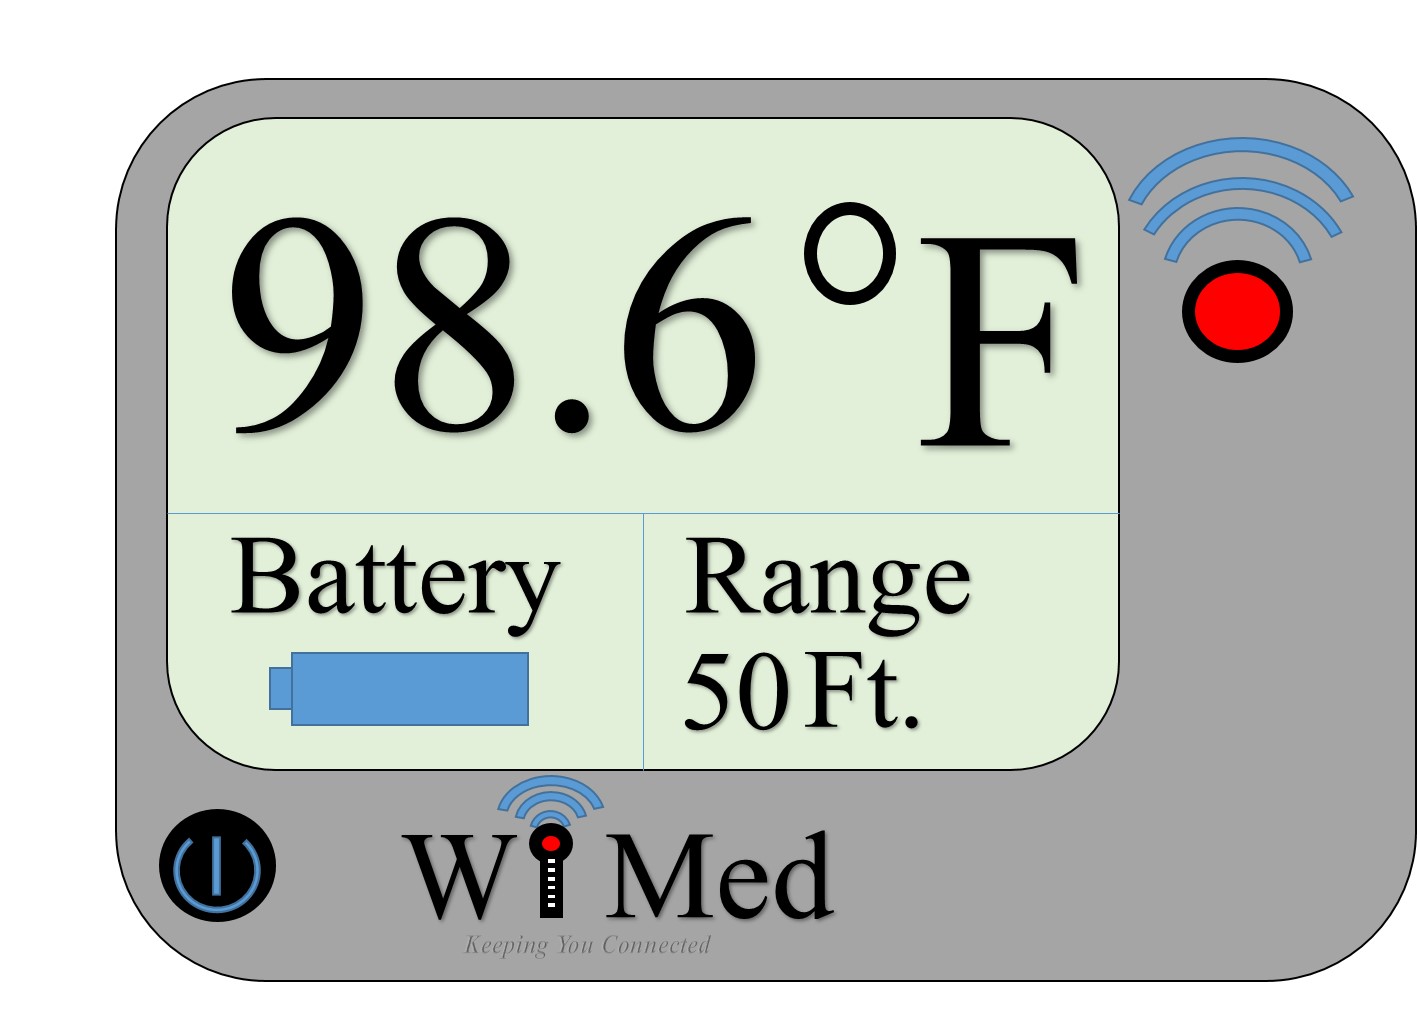
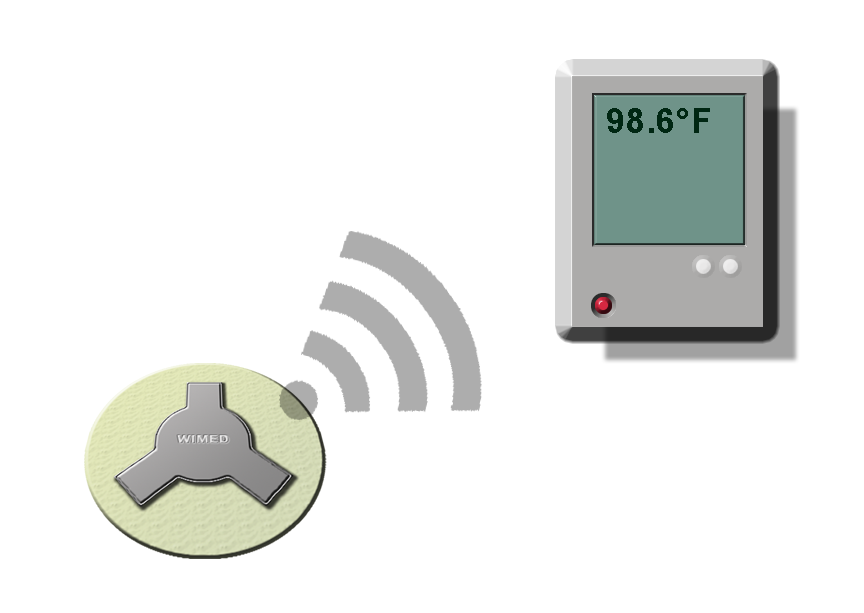
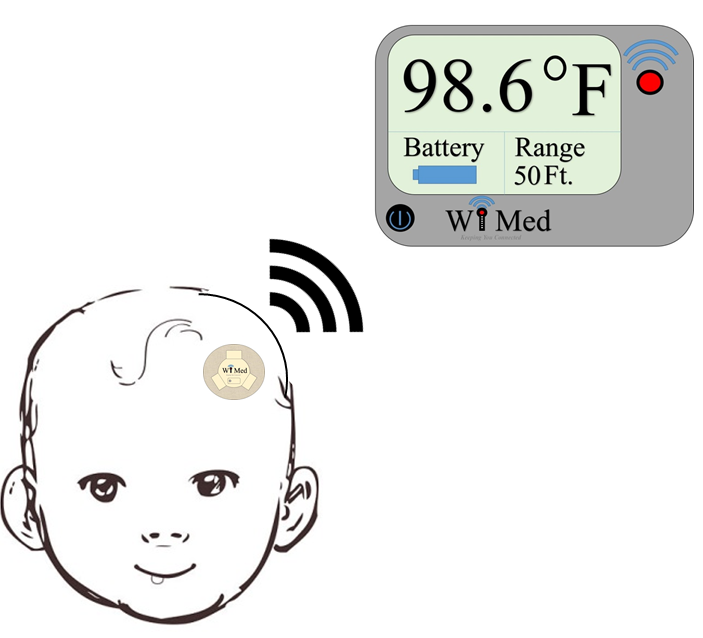
LAB 3B WRITE-UPTarget Population and NeedThe need in which our group decided to focus on was young, sick children with temperatures that need to be regularly monitored. Considering younger children (0-6) tend to spend more time sleeping or playing, taking their temperature can be a challenge between trying not to wake them up or getting them to stay still long enough to get an accurate temperature. With our newly designed WiTherm Wireless Thermometer, a small thermometer sensor can be stuck to the child's forehead or underarm just like an over the counter band-aid. Like the thermometer from Raiing, our thermometer has a wireless component that communicates with a hand-held device to display temperature. As long as both the hand held device is connected to a wireless network, it's able to communicate to the small sensor that will always be sending out the child's temperature.
Device Design
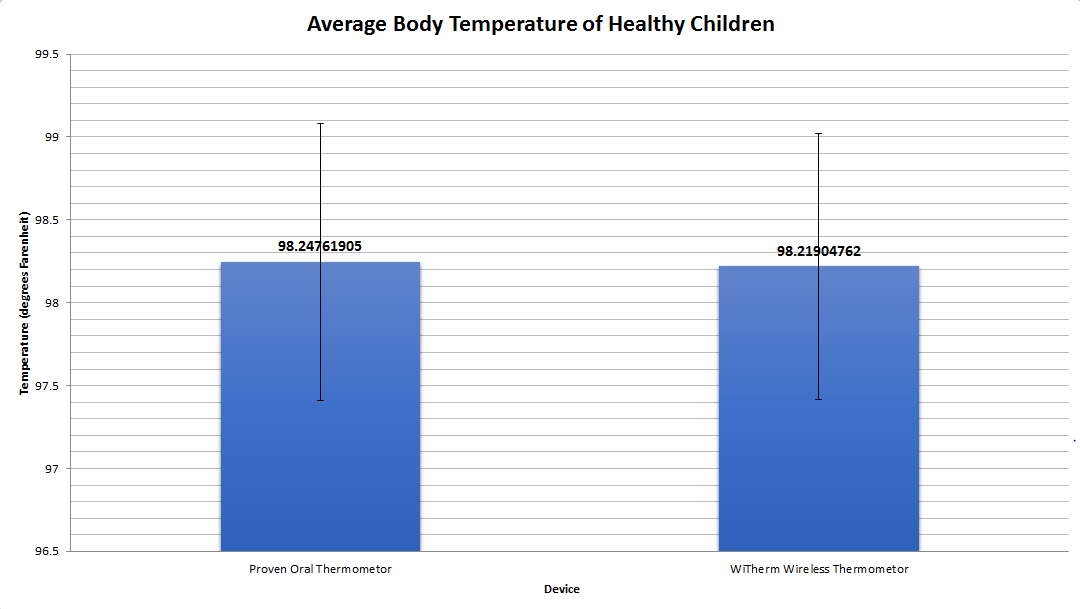
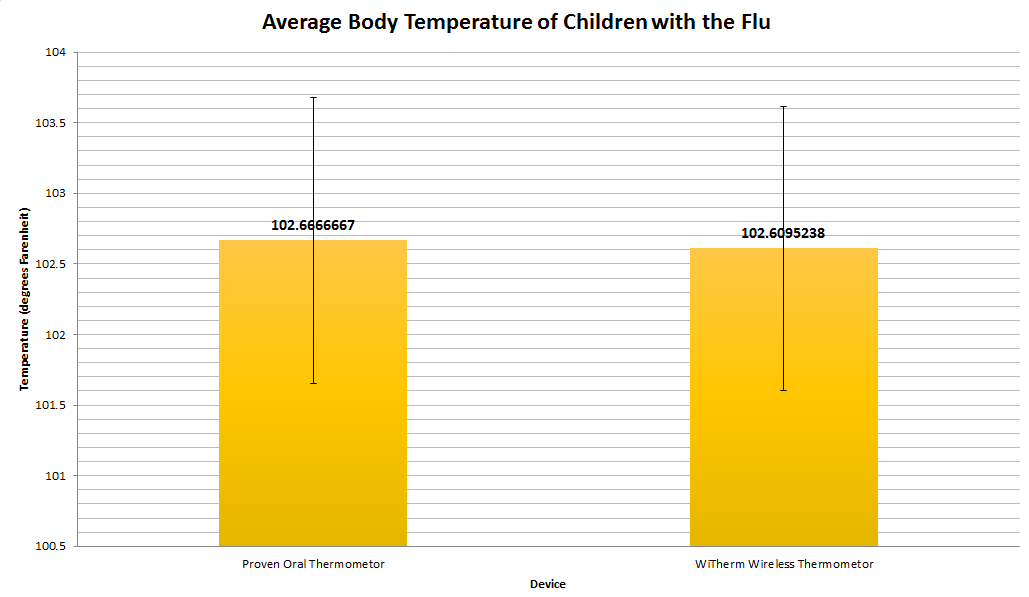
Inferential StatisticsData:
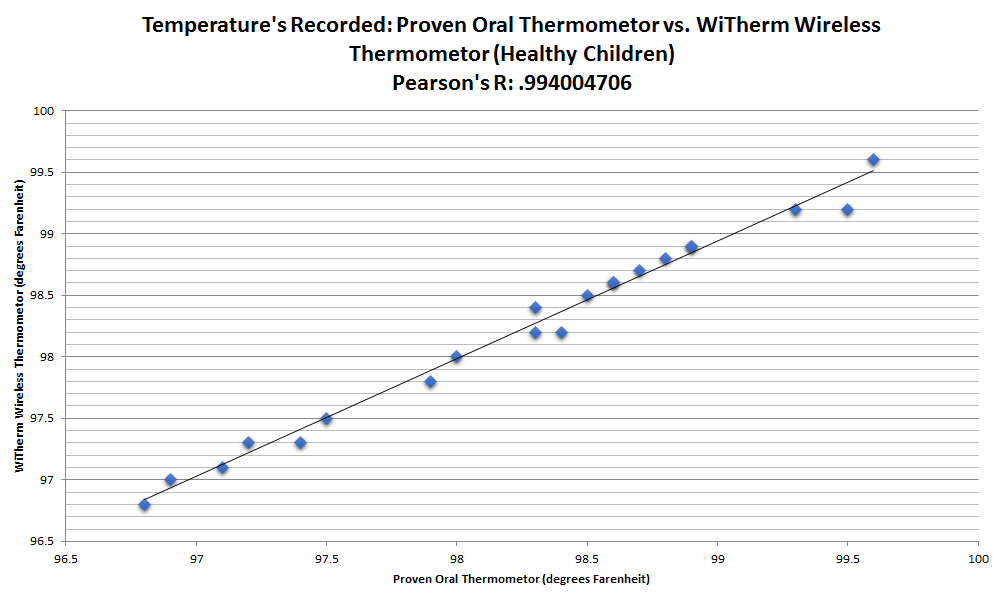
T test:0.910685189 Pearson's r correlation coefficient: 0.994004706
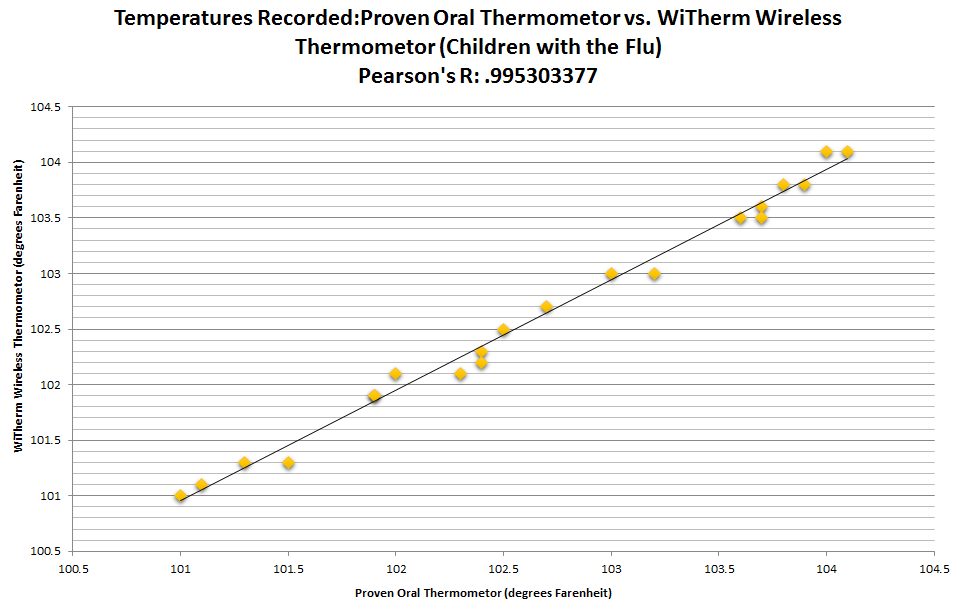
T test: 0.855255463 Pearson's r correlation coefficient: 0.995303377
Graph
| |||||||

