BME100 f2013:W1200 Group18 L2
| Home People Lab Write-Up 1 | Lab Write-Up 2 | Lab Write-Up 3 Lab Write-Up 4 | Lab Write-Up 5 | Lab Write-Up 6 Course Logistics For Instructors Photos Wiki Editing Help | |||||||
|
OUR TEAM
LAB 2 WRITE-UPDescriptive StatisticsExperiment 1 For 5mg LPS Dose: For 10 mg LPS Dose: For 15mg LPS Dose:
Experiment 2 For 10mg LPS Dose:
Results
AnalysisExperiment 1
Experiment 2 (Using inferential statistics, please determine statistically significant differences in the data.)
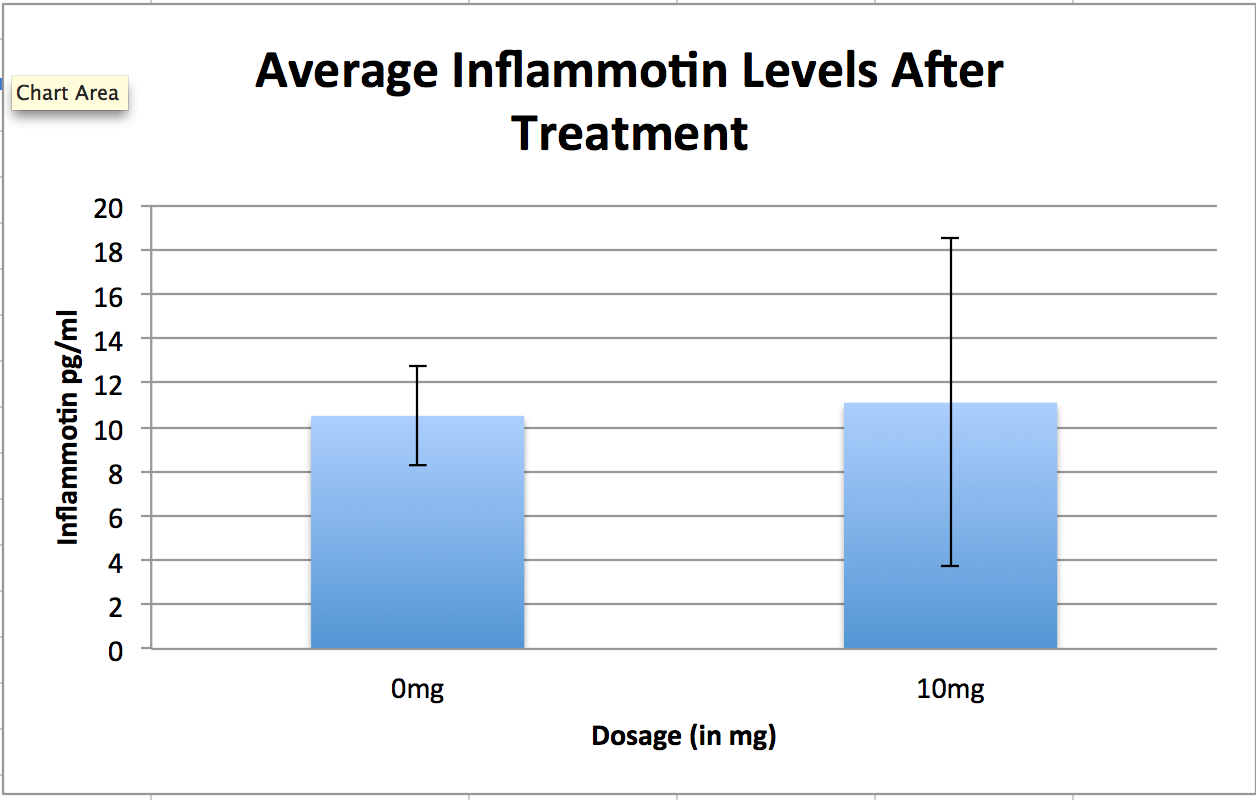
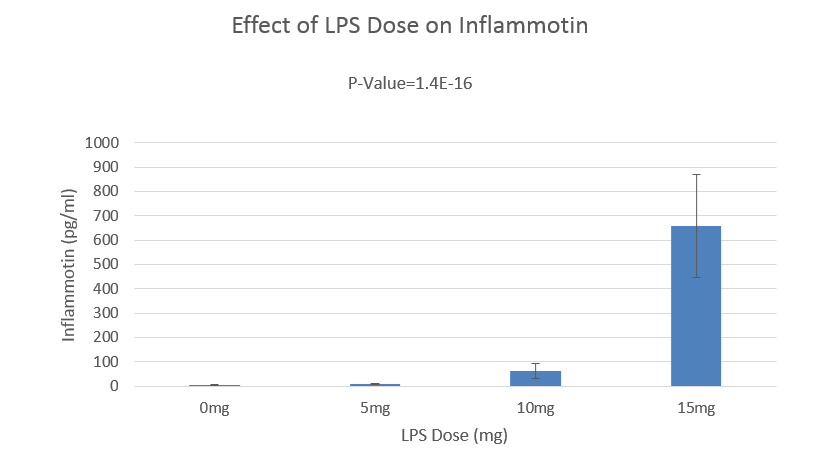
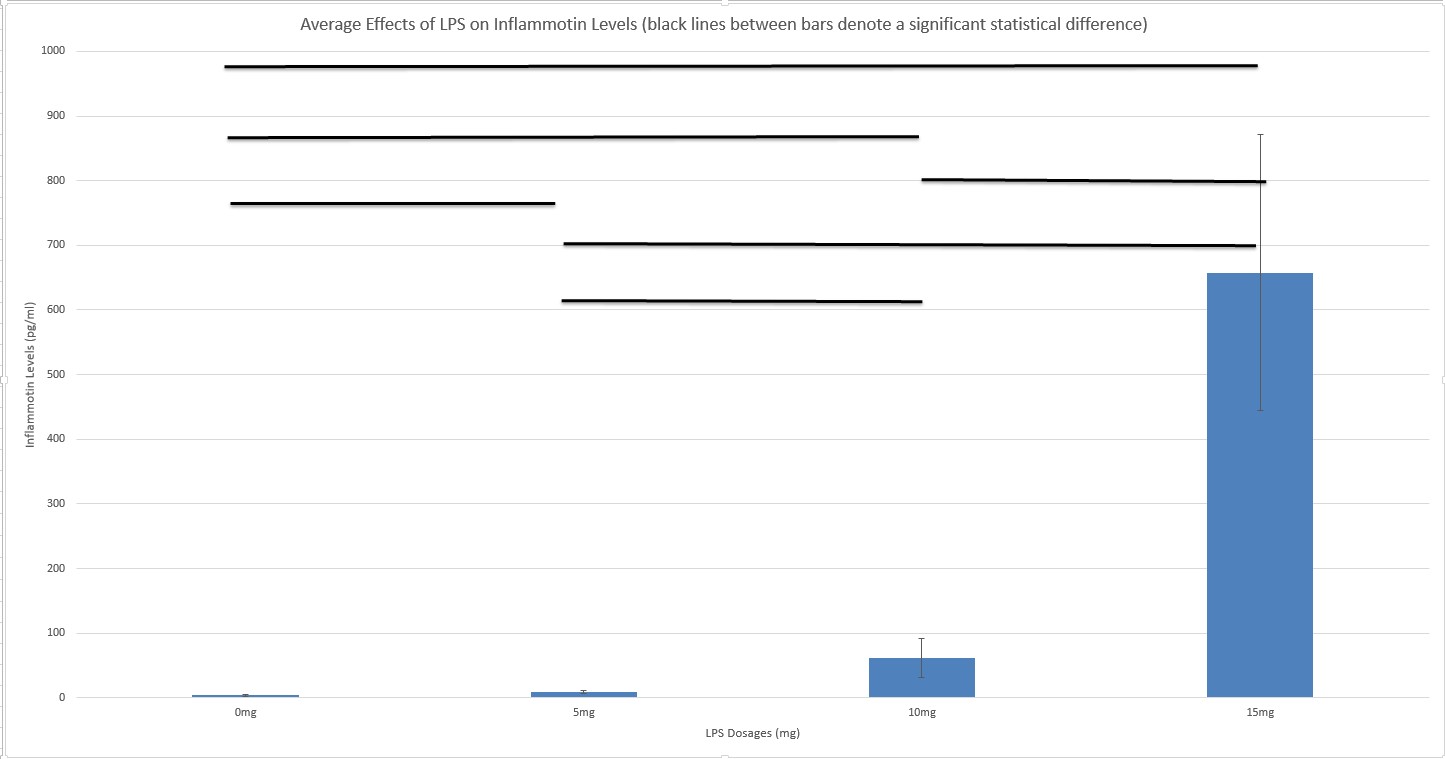
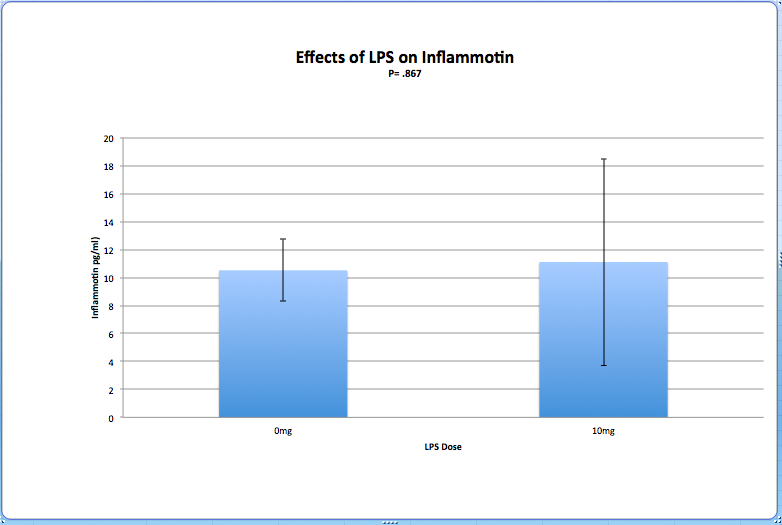
Summary/Discussion(Please discuss the results and statistical analysis from both experiments. State your conclusion.) Looking at the graphs, it is apparent that the human experiment showed a big change in Inflammotin levels as dosage increased, whereas the rat experiment showed little to no change in Inflammotin levels as dosage increased. The margin of error also increased as dosage increased for both experiments. However, it is important to determine the accuracy of these results. The p-value of the human experiment (experiment 1) was lower than 0.05, which means the differences in the data are significant. All six individual comparisons with Bonferroni Corrections within this experiment also support this claim. On the other hand, the p-value of the rat experiment (experiment 2) was greater 0.05, which means that the difference in the data is not significant. This data (the p-values specifically) means that LPS is a drug more effective in humans than in rats. Also, the human body requires a large dose of LPS for there to be any real change in Inflammotin levels.
| |||||||


