BME100 f2013:W1200 Group14 L3
| Home People Lab Write-Up 1 | Lab Write-Up 2 | Lab Write-Up 3 Lab Write-Up 4 | Lab Write-Up 5 | Lab Write-Up 6 Course Logistics For Instructors Photos Wiki Editing Help | |||||||
|
OUR TEAM
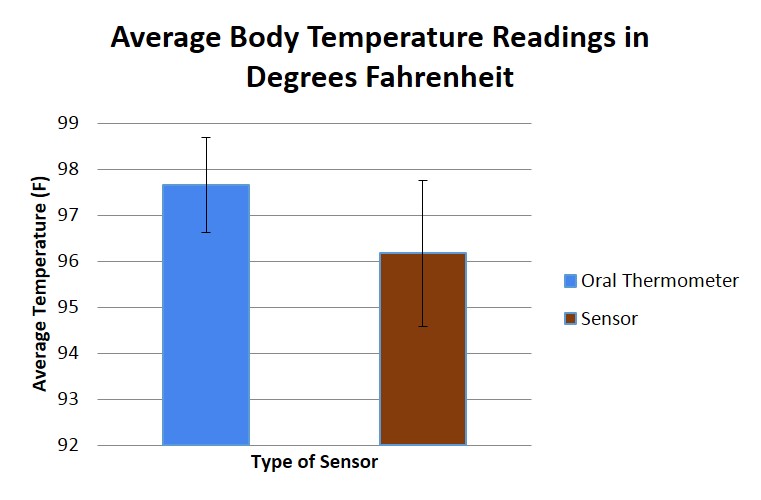
LAB 3A WRITE-UPDescriptive StatisticsOral Thermometer Average: 97.6540113 degrees Fahrenheit Standard Deviation: 1.023622278 degrees Fahrenheit Endpoint #: 176 Standard Error: .076940162 Sensor Average: 96.1674285714286 degrees Fahrenheit Standard Deviation: 1.58733941819524 degrees Fahrenheit Endpoint #: 176 Standard Error: 0.119650210570333
Results
The graph demonstrates that there is a clear difference between the average temperature readings of the oral thermometer and the sensor.Furthermore, the error bars are larger and more significant with the sensor, implying that the sensor is less accurate than the oral thermometer.
Analysis
The null hypothesis states that the results of both the oral thermometer and the sensor are the same. The alternate hypothesis states that the results may vary-- based off of our results, the alternate is more accurate.
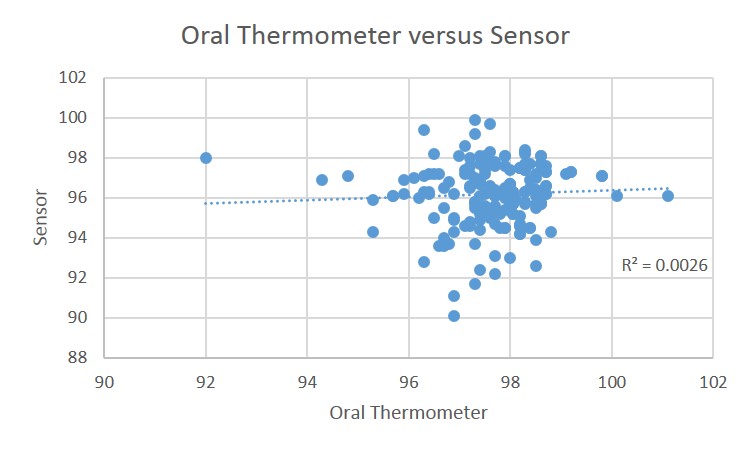
After running a t-test on the data, a p-value of 3.30237E-22. Because the p-value was below .05, this means that there is an extremely low chance that the results are the same. After running a Pearson's coefficient test, it was found that the r-value was 0.050573103, meaning that the results between the oral thermometer and the sensor were not correlated.
The average temperature detected by the oral thermometer is 97.7 degrees Fahrenheit.
Summary/DiscussionIn order to test the differences in accuracy between the oral thermometer and the sensor, temperature readings were taken both inside and outside of the lab. When staying inside, readings were taken every two minutes for 10 minutes. When outside, readings were taken every 5 minutes for an hour. Based off of our results, we determined that there was a significant difference between the two products, which means that the sensor was not as accurate as the oral thermometer. This difference is because there were many errors when using the sensor. The sensor is not a reliable device for everyday use because during trials we faced many problems. We had issues connecting the device over bluetooth, even over a short distance. Also,the device does not give consistent readings unless it is placed very specifically under a certain part of the arm. Another problem we ran into was the fact that it was warmer outside than normal body temperature so we had to make sure the test subject was completely covering the sensor with the arm. The tape that comes with the sensor didn't stick to the skin very well so we had to use extra adhesive, not included with the product. This is why the results had such a low Pearson's r coefficient-- with all these errors, the oral thermometer and the sensor's results did not correlate at all. The sensor can be redone to be more accurate by having stronger tape, and to have a stronger connection to the bluetooth. It should be made to read signals over longer distances as well. In conclusion, the sensor is not an accurate measure of temperature. (Please discuss the results and statistical analysis. State your conclusion as well as design flaws and recommendations.)
LAB 3B WRITE-UPTarget Population and NeedTarget Population:
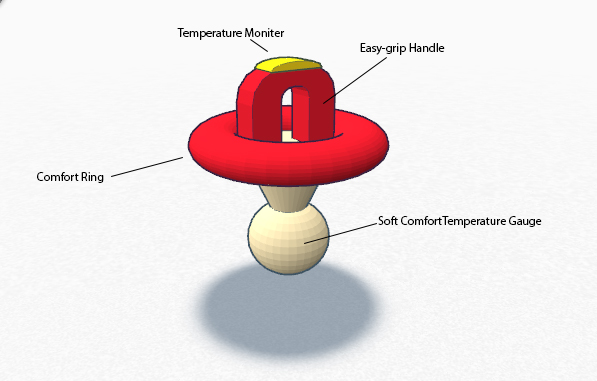
DiagramLogo
=Inferential StatisticsPacifier: Average:98.8974359 Standard Deviation:0.971566066 Endpoint: 39 Standard Error: 0.155073824
  Average:98.9153846
  Standard Deviation: 0.827341482
  Endpoint: 39
  Standard Error: 0.123565158
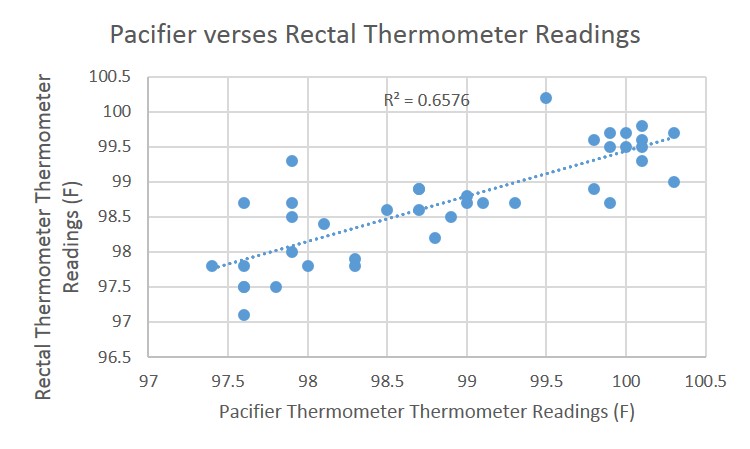
STATS: t-test:0.410478683 Pearsons' Coefficient Test: 0.81092781
Graph
| |||||||


