BME100 f2013:W1200 Group13 L2
| Home People Lab Write-Up 1 | Lab Write-Up 2 | Lab Write-Up 3 Lab Write-Up 4 | Lab Write-Up 5 | Lab Write-Up 6 Course Logistics For Instructors Photos Wiki Editing Help | ||||||
|
OUR TEAM
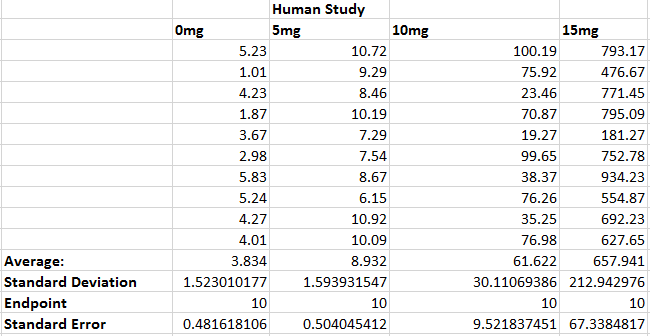
LAB 2 WRITE-UPDescriptive Statistics For Human Experiment
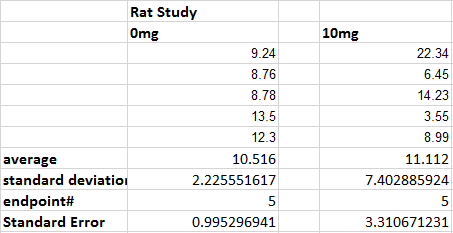
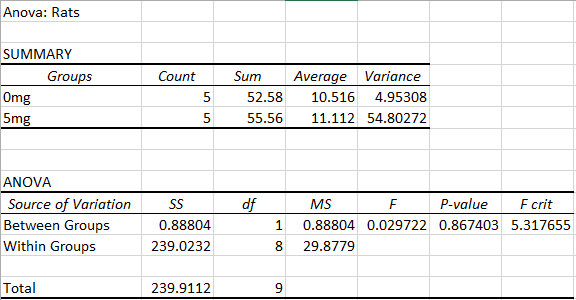
Descriptive Statistics For Rat Experiment
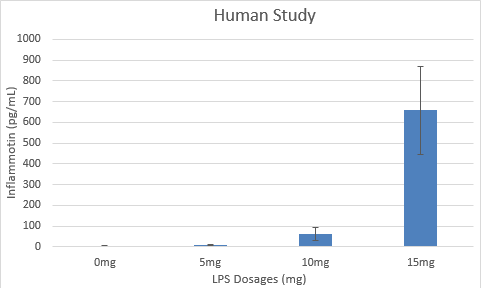
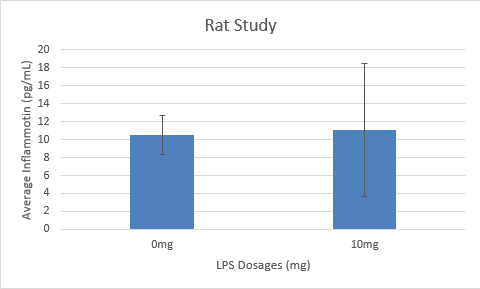
Results
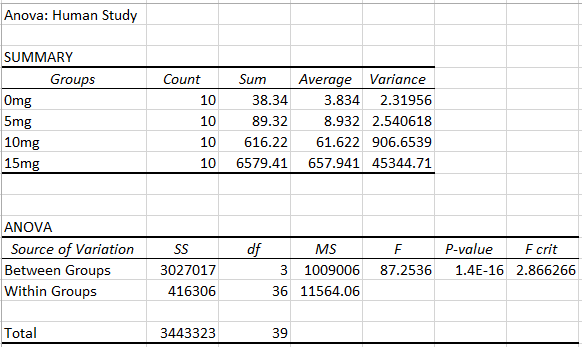
Analysis Significant Data For Human Experiment
Since the P-value in the human study is less than .0083 it is statistically significant at a 95% confidence interval. In the rat study the P-value is greater than .05 which means it is not statistically significant.
Summary/DiscussionOn average, in the human study as the LPS dosage increases, the amount of Inflammotin also increases. In the rat study, as the LPS dose is increased the amount of Inflammotin in the rats fluctuates.
In conclusion, the LPS has an affect in the amount of Inflammotin in hum as,however,in the rat study the amount of Inflammotin fluctuates regardless of the dosage of LPS.
| ||||||


