BME100 f2013:W1200 Group12 L3
| Home People Lab Write-Up 1 | Lab Write-Up 2 | Lab Write-Up 3 Lab Write-Up 4 | Lab Write-Up 5 | Lab Write-Up 6 Course Logistics For Instructors Photos Wiki Editing Help | |
|
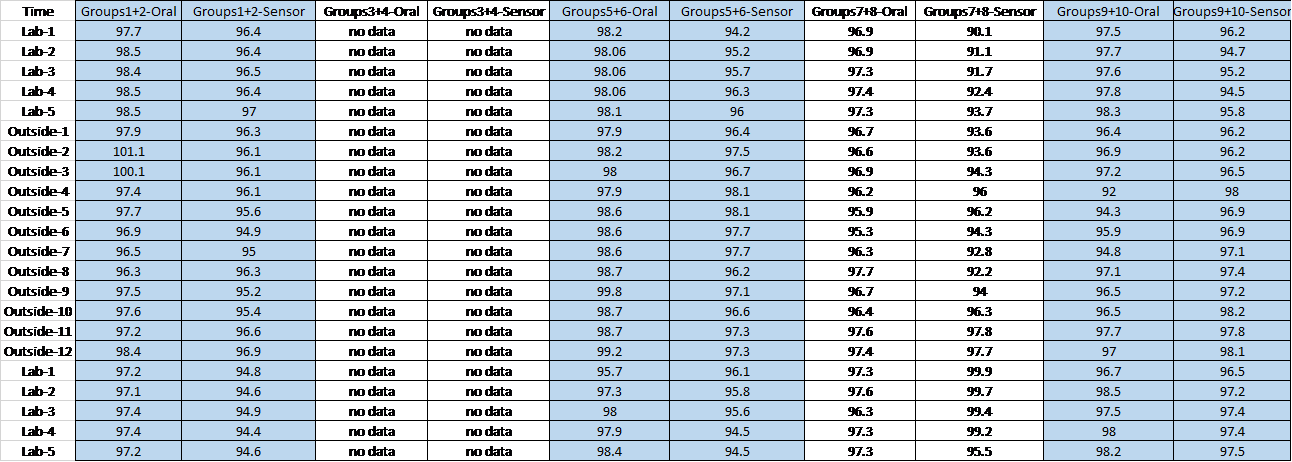
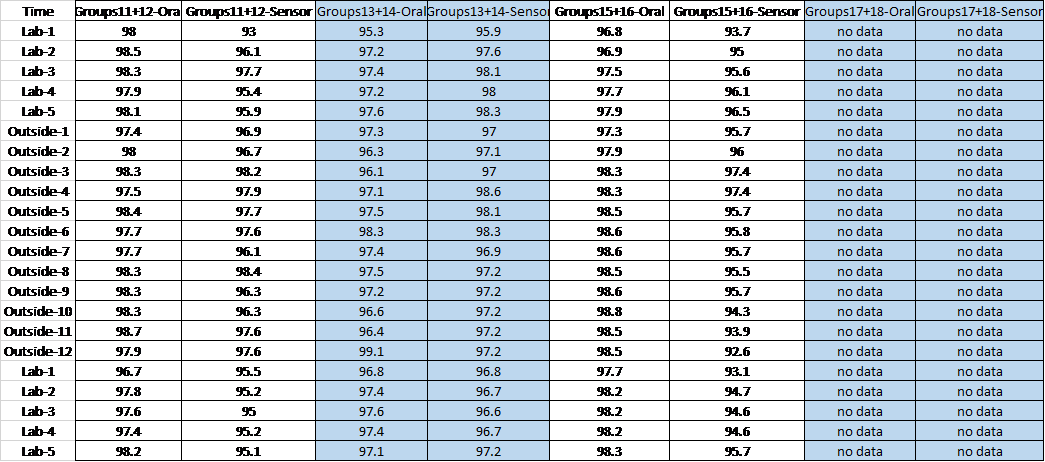
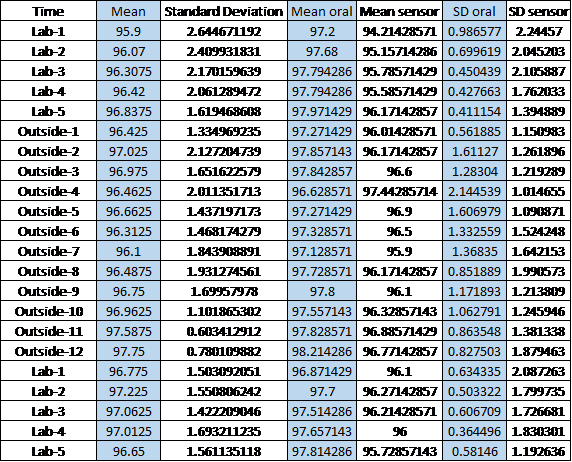
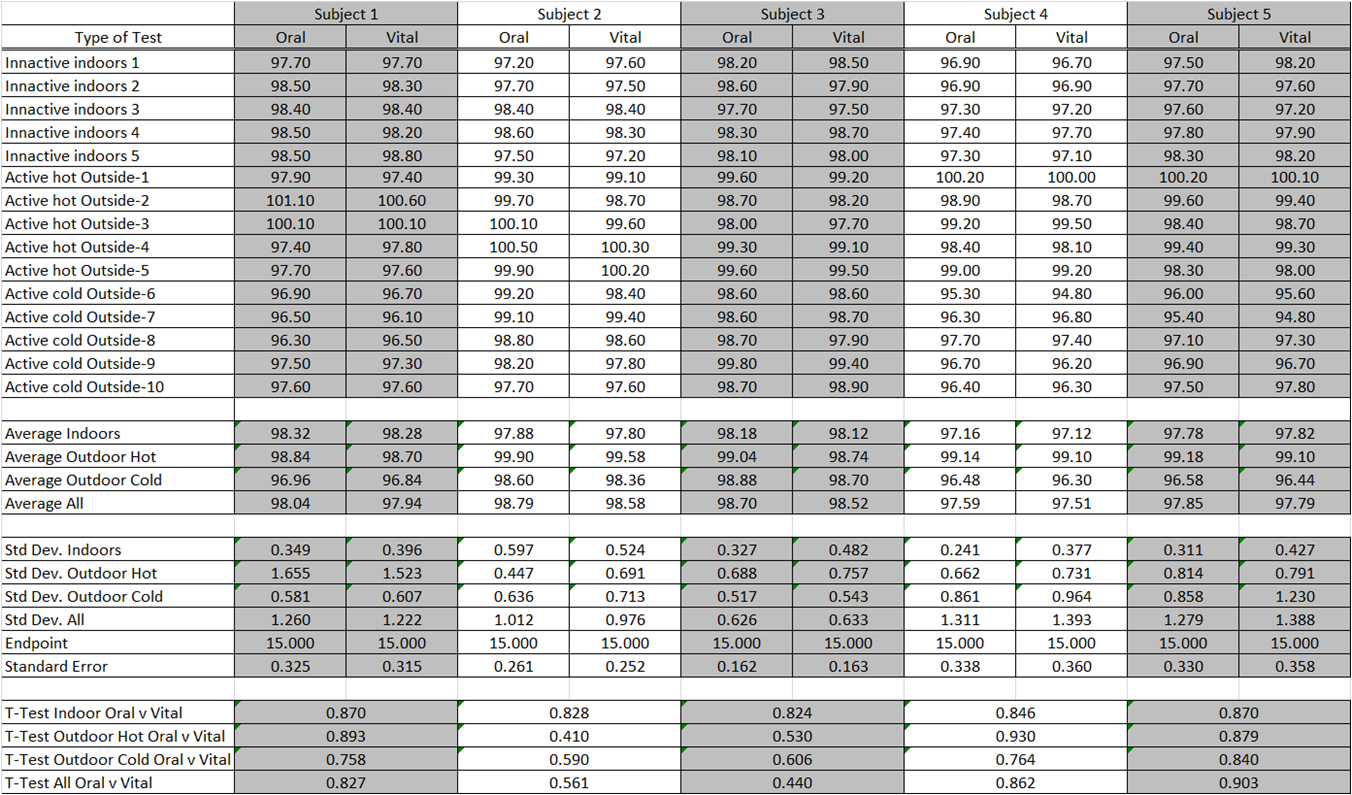
OUR TEAMLAB 3A WRITE-UPDescriptive Statistics(Descriptive statistics for the data set)
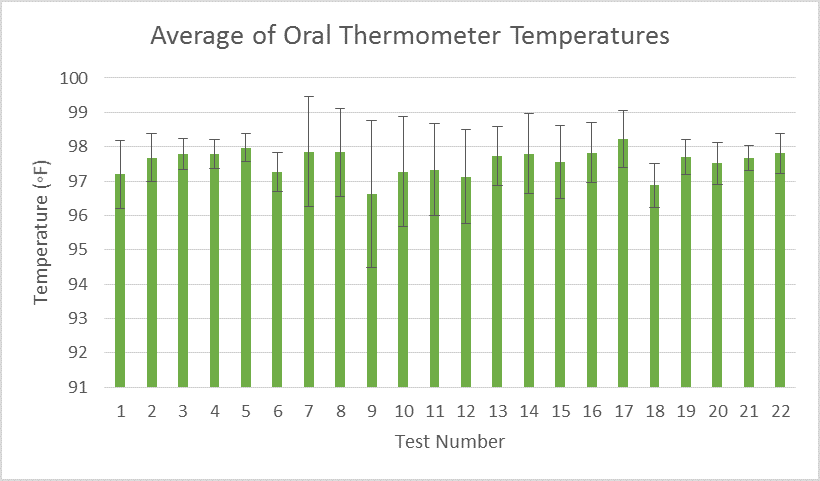
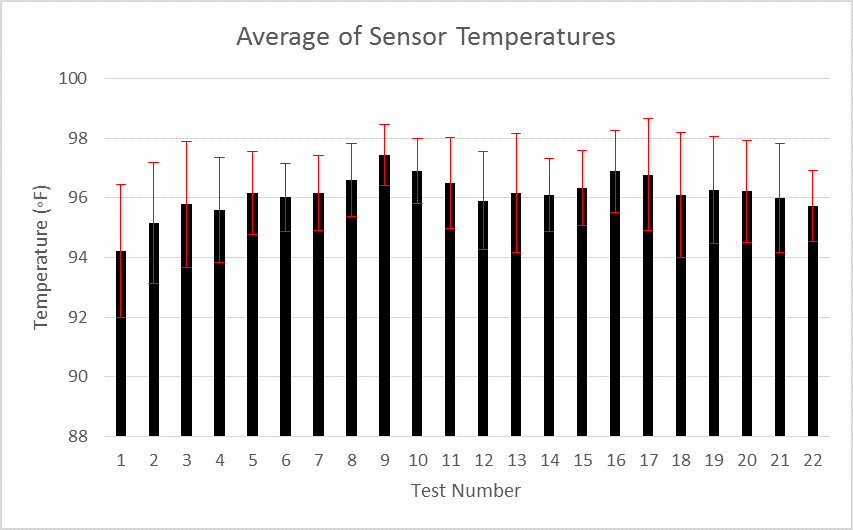
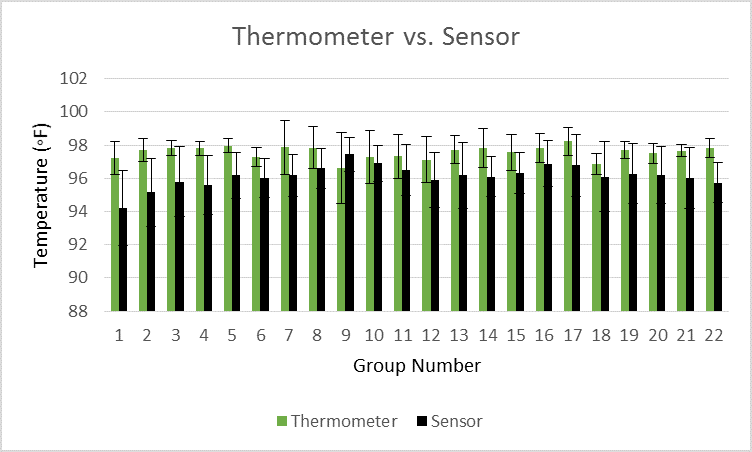
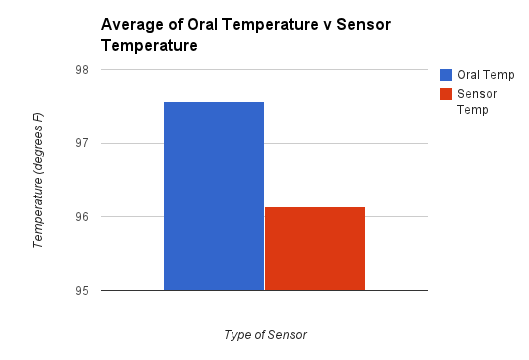
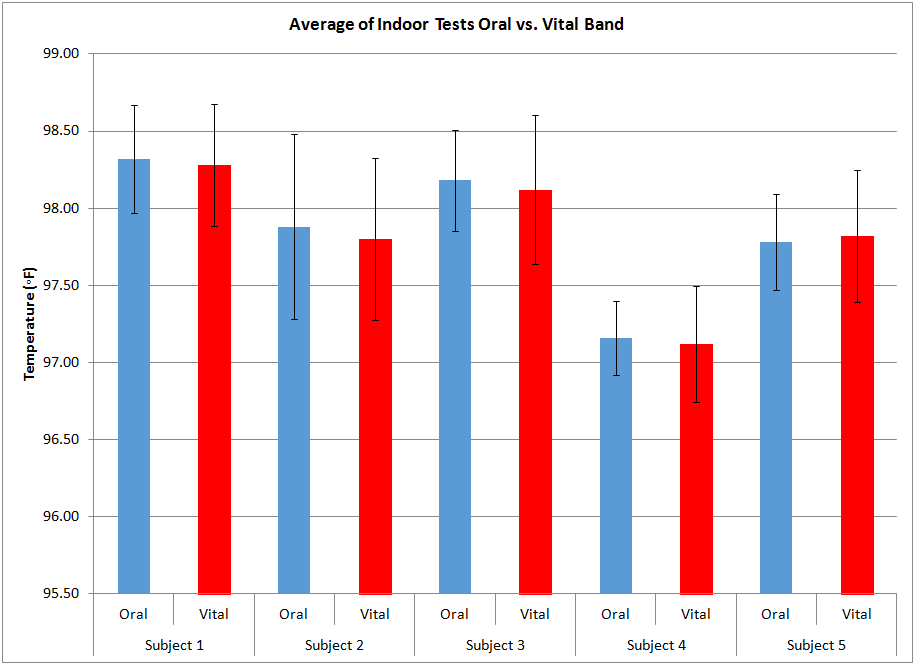
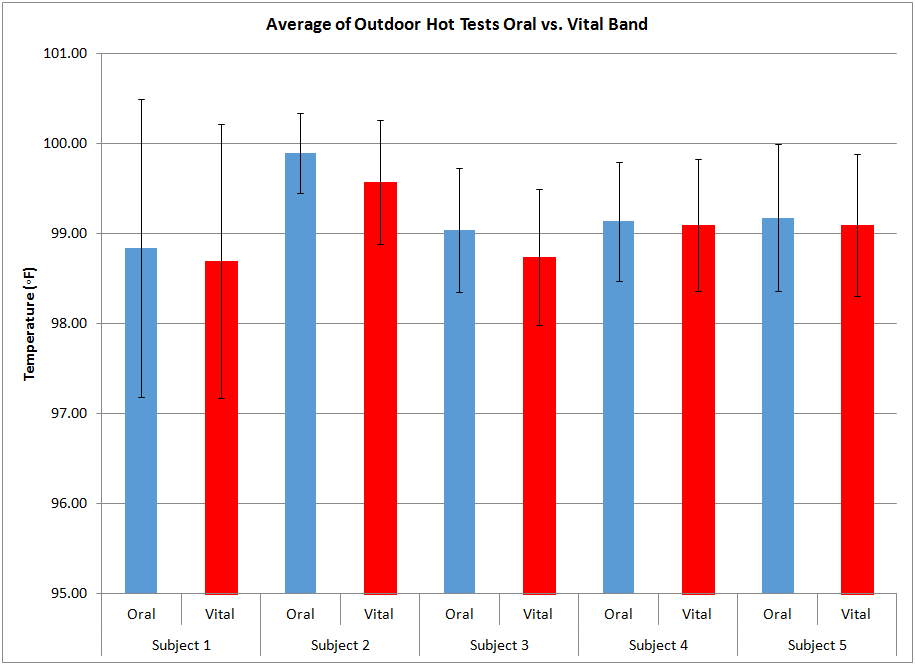
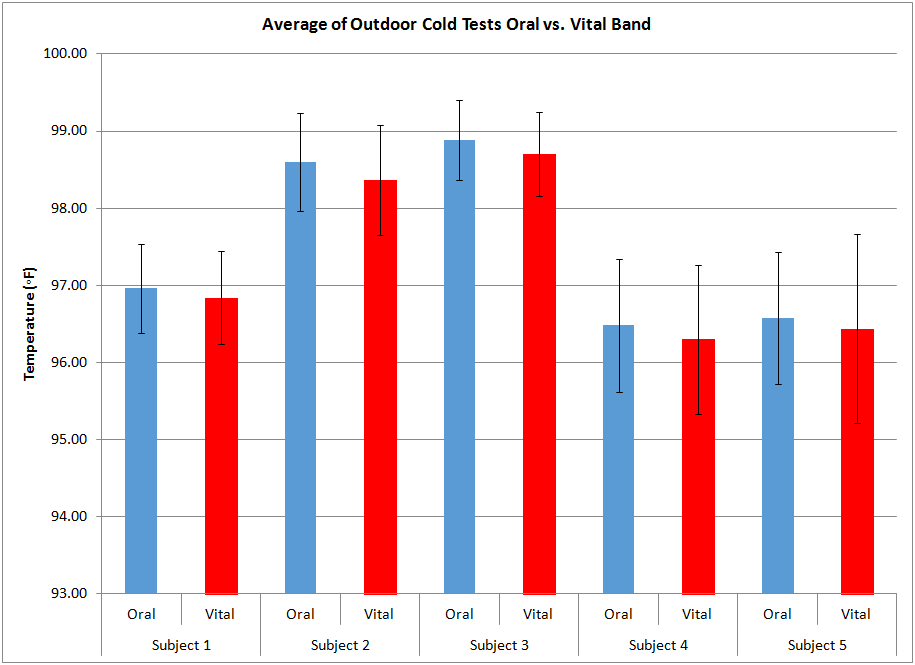
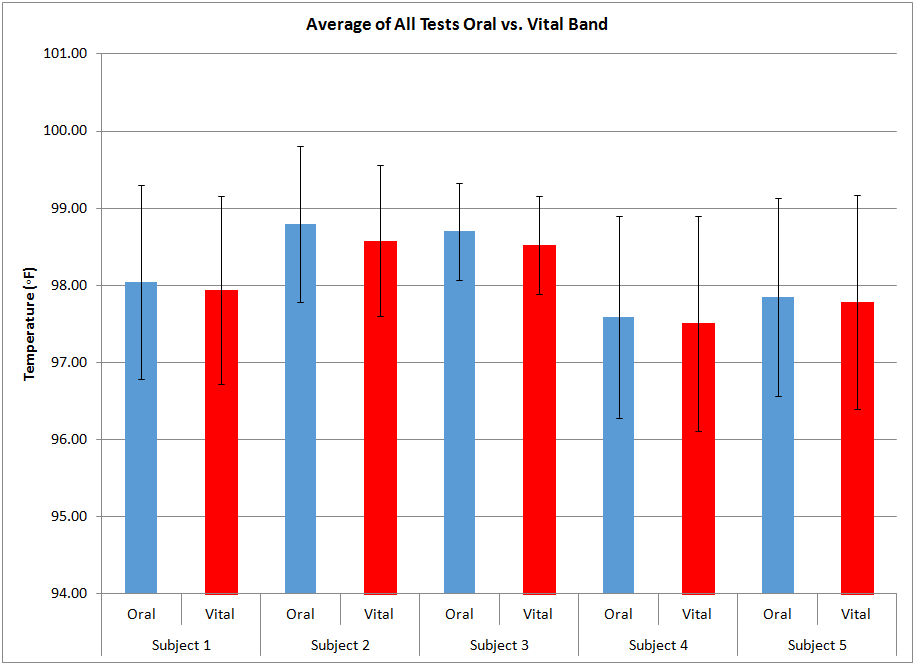
Results(Well-labeled graph with error bars and significance)
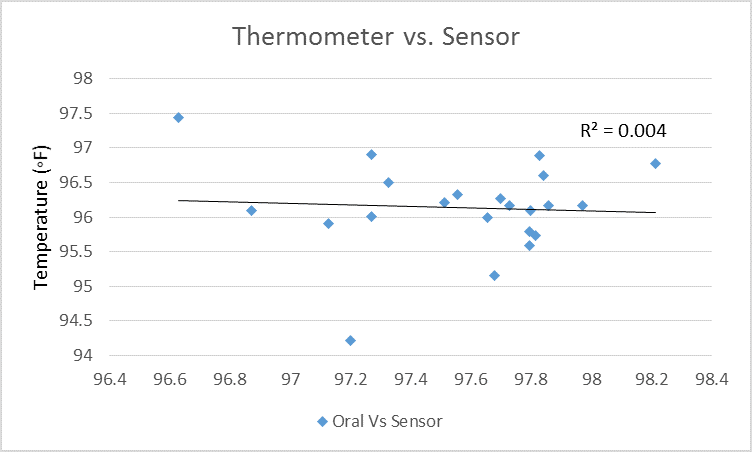
Analysis(Perform inferential statistics described in assignment.) The Pearsons R value was -0.06293. This shows that there was no correlation between the temperature measured using the thermometer and the temperature measured using the sensor. The T-Test value was 3.68094E-11. This shows that our date was significantly significant because 3.68094E-11 is less than 0.05.
Summary/Discussion(Please discuss the results and statistical analysis. State your conclusion as well as design flaws and recommendations.) As was observed from the experiment, the sensor failed to produce consistent results. The oral thermometer is more reliable as we know, and when comparing the two values there was a vast difference between them. Some possible reasons for this include design flaws such as poor bluetooth connection which caused false reading because it often disconnected. Also, the overall design of the sensor was very poor in that it was easily broken and very hard to turn on. Our recommendation would include slight design changes such as making the device pair with cellular devices through wi-fi, rather than bluetooth, and include more sensors to more accurately measure body temperature using one on each arm to find the average temperature. Additionally we would recommend that the device be housed in a more efficient and durable body to protect it from wear and tear damage as well as be more comfortable on the body.
LAB 3B WRITE-UPTarget Population and NeedThe target population for our device is athletes who perform in extreme conditions. Athletes such as football players have a need for this band because of the heat that they are sometimes required to play in. It will keep their bodies from overheating because they will be alerted when their body temperature is too high. Althletes such as snowboarders, whose sport takes place in extremely cold areas will also have a need for it because they will be alerted when there body temperature is too low.
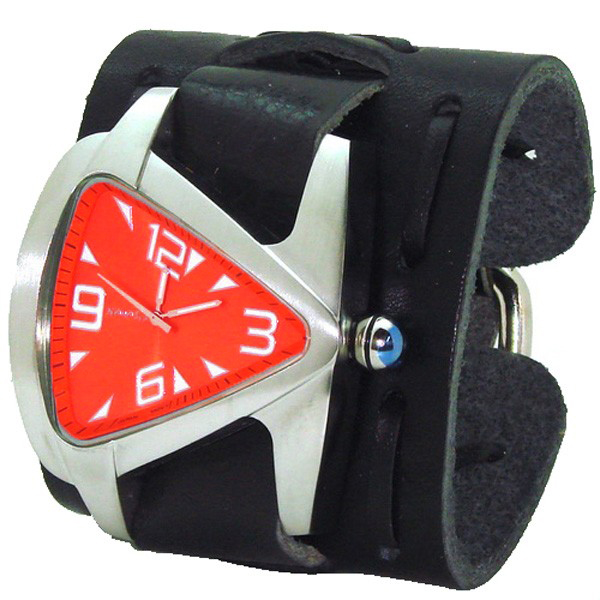
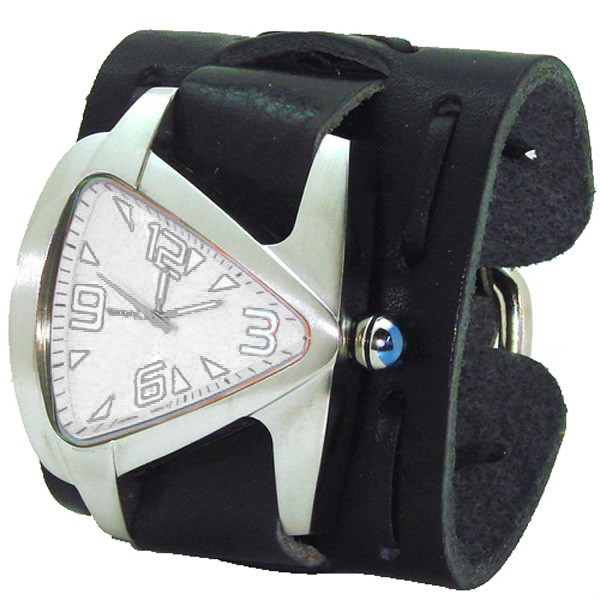
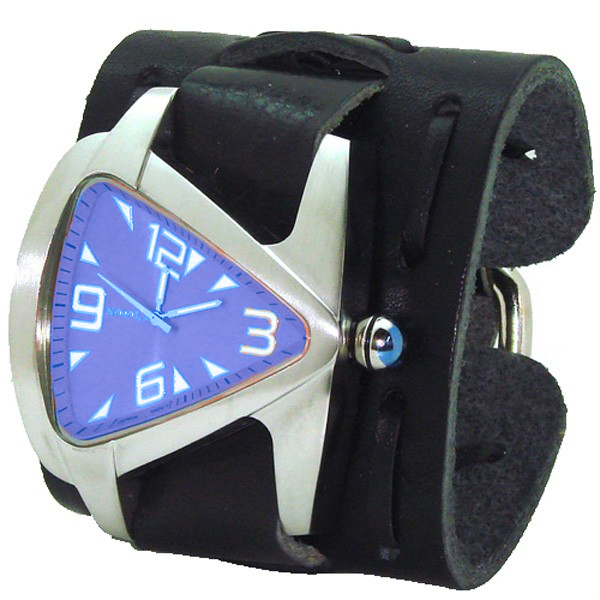
Device DesignThe Vitality Band will measure your body temperature to an accuracy of within 1.4 degrees Fahrenheit of your standard oral thermometer. It is one of the most accurate devices on the market. It turns a light blue when your body temperature drops below 97.5 degrees Fahrenheit and turns a dark blue when your temperature drops below 96 degrees Fahrenheit. This indicates that you are in danger of hypothermia. The bands display turns a light red when your temperature reaches 99.5 degrees Fahrenheit and turns a dark red when your body temp exceeds 100 degrees Fahrenheit. This indicates that you are in danger of heat stroke. When the device turns a dark blue or a dark red and stays like that for at least 15 minutes, it sends out a signal via radio frequencies to the nearest emergency service station alerting them to send someone to assist you. This will be done by the Radio Frequency Identification chip built in to each and every Vitality Band. The device also tells time and is water proof. The device is made out of an aluminum alloy display frame and a rubber band. It is very light weight and durable. The band itself is also replaceable allowing for personalization.
Inferential Statistics
Graph
| |

