BME100 f2013:W1200 Group11 L3
| Home People Lab Write-Up 1 | Lab Write-Up 2 | Lab Write-Up 3 Lab Write-Up 4 | Lab Write-Up 5 | Lab Write-Up 6 Course Logistics For Instructors Photos Wiki Editing Help | ||||||
|
OUR TEAM
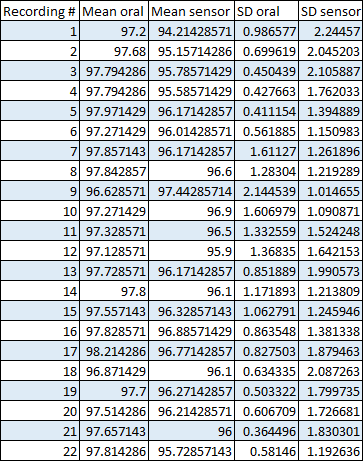
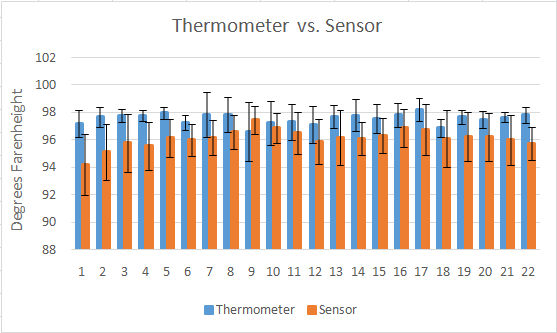
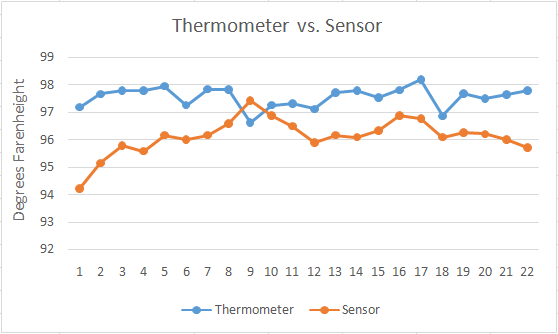
LAB 3A WRITE-UPDescriptive StatisticsResultsAs evident by the results that are shown in the graph, the thermometer was able to deliver more accurate results compared to those from the sensor. The thermometer could possibly deliver these more accurate results because of the closer proximity it is to the body and the actually physical contact it has with the body. The sensor's readings have also fluctuated more than the readings from the thermometer throughout the experiment, giving unreliable readings.
The difference between the sensor's and the oral thermometer's data on the two graphs display that the iPhone app is not very accurate. It lacks reliability and validity. Also, while the oral thermometer generally gave constant readings of Patient r's temperature, the app's sensor fluctuated drastically throughout the experiment. This is represented through the large error bars from the sensor, while the oral thermometer's error bars are not as high.
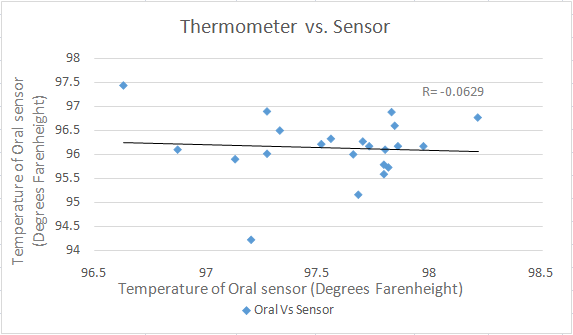
AnalysisPearson's R correlation coefficient is -0.06293. Because r is close to 0, the relationship between the temperatures recorded by the thermometer and the temperatures recorded by the sensor is not a strong linear relationship. This indicates that the sensor is inaccurate because ideally, the temperatures recorded by the sensor would be similar to those recorded by the thermometer.
The p value from the t-test is 3.68 * 10^-11. The small p-value indicates that our results are significant, and that there is a clear difference between the average temperatures recorded by the sensor and the temperatures found with the thermometer. Summary/Discussion
LAB 3B WRITE-UPTarget Population and Need
Device Design
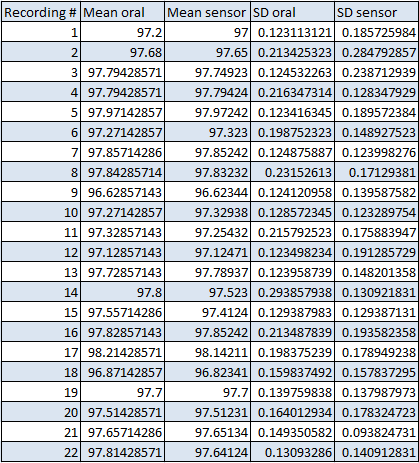
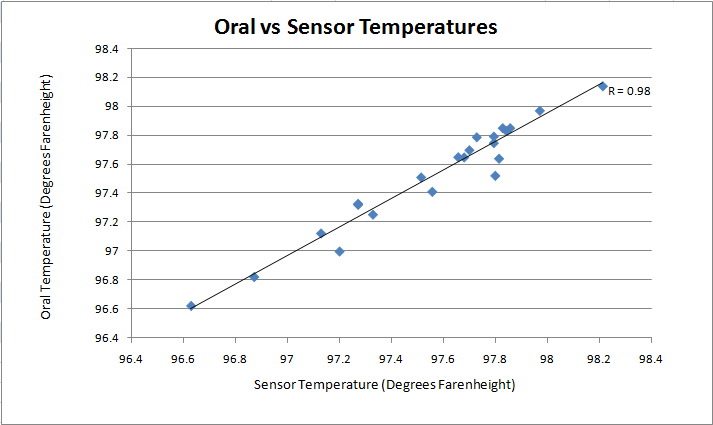
Inferential StatisticsThis data reveals the similarity and correlation between the orally taken temperatures and the temperatures found using the pacifier temperature sensor. The mean temperatures taken by each device were similar, and the t-test confirmed that there was no significant difference between the mean temperatures with the high p-value. The high R value showed that there is a strong linear relationship between orally recorded temperatures and temperatures found using the sensor. Overall, this data shows that the pacifier sensor measures temperature accurately. In contrast, the original sensor device measured temperature very innacurately. The temperatures found using the sensor were extremely different from those found using the thermometer; the R value was close to 0, indicating that there was no relationship between orally recorded and sensor-derived temperatures, and the P-value of the t-test was below 0.05, showing that there was a significant difference between the two measurements. Therefore, it is clear that the pacifier sensor is an improvement from the original sensor device. Graph
| ||||||

