BME100 f2013:W1200 Group11 L2
| Home People Lab Write-Up 1 | Lab Write-Up 2 | Lab Write-Up 3 Lab Write-Up 4 | Lab Write-Up 5 | Lab Write-Up 6 Course Logistics For Instructors Photos Wiki Editing Help | ||||||
|
OUR TEAM
LAB 2 WRITE-UPDescriptive StatisticsExperiment 1 Experiment 2
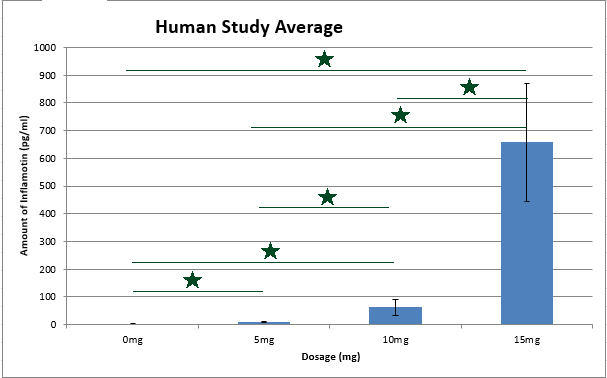
ResultsHuman Study
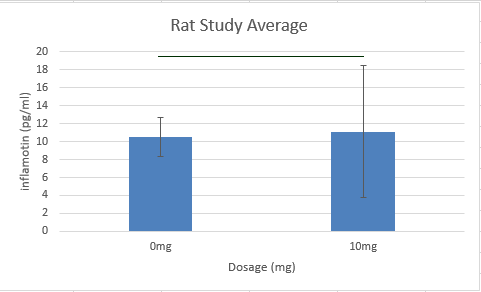
Rat Study
AnalysisHuman Study
Rat Study Summary/DiscussionIn the first experiment (the effect of lipopolysaccharide on amount of Inflammotin in humans), we ran a t-test and discovered a p-value of 0.0125. This p-value is less than the alpha value of 0.05 and consequently, our results are statistically significant. Even the groups that were given a lower concentration of lipopolysaccharide (5 mg) were substantially affected by it. The experimental group that was given 5 mg of lipopolysaccharide had almost three times the amount of Inflammotin that the control group did. This means that we are 98.75% confident that there is a strong, positive correlation between the amount of lipopolysaccharide given to the subject and the amount of Inflammotin in their bloodstreams. We can conclude that there is a relationship between increased dosage of lipopolysaccharide and the amount of Inflammotin in their bloodstreams. In the second experiment (the effect of lipopolysaccharide on the amount of Inflammotin in rats), we ran a t-test and discovered a p-value of 0.867. This p-value is greater than the alpha value of 0.05 and consequently, our results are not statistically significant. This means that we are only 13.3% confident that there is a correlation between the lipopolysaccharide dosage and the amount of Inflammotin found in the rats' bloodstreams. Although a 10mg dosage of lipopolysaccharide did increase the average of the amount of Inflammotin by approximately 0.6 pg/ml, our confidence level is too low for our data to hold any weight. Since our confidence level is so low, our results are inconclusive and the relationship between the dosage of lipopolysaccharide and the amount of Inflammotin in rats can not be determined.
| ||||||


