BME100 f2013:W1200 Group10 L2
| Home People Lab Write-Up 1 | Lab Write-Up 2 | Lab Write-Up 3 Lab Write-Up 4 | Lab Write-Up 5 | Lab Write-Up 6 Course Logistics For Instructors Photos Wiki Editing Help | |||||||
|
OUR TEAM
LAB 2 WRITE-UPDescriptive StatisticsExperiment 1
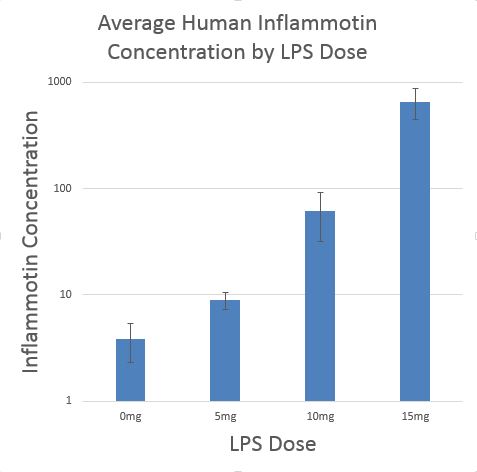
HUMAN DESCRIPTIVE STATISTICS: Experiment 2
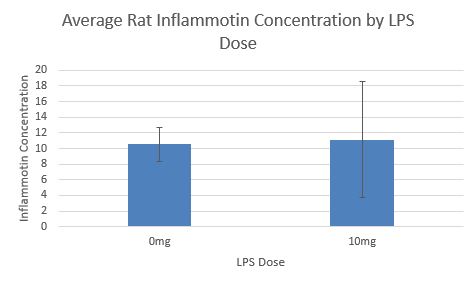
RAT DESCRIPTIVE STATISTICS:
Results
AnalysisExperiment 1 The tests used in the analysis of the experiment, which were the ANOVA and Post-hoc test, confirms that the relationship between inflammotin concentration and dosage is statistically significant in humans given the data acquired. The p-value obtained from the ANOVA test for humans is 1.4E-16 and is significantly lower than the suggested p-value .05. Thus, the data and ANOVA test indicates that with a confidence level greater than 95%, scientists can confirm that a difference does exist and dosage of LPS does bear an effect on inflammotin concentration. The Post-hoc test yields p-values of 8.59631E -7 for 0 and 5 mg, 9.94377E -6 for 0 and 10 mg, 1.39436E -8 for 0 and 15 mg, 3.01859E -5 for 5 and 10 mg, 1.57101E -8 for 5 and 15 mg, and 6.4824E -8 for 10 and 15 mg. Each of these individual p-values are less than .008333 thus further solidifying that the relationship between the two variables is statistically significant. Experiment 2 A t-test was used for the experiment dealing with the rats as the subject because only two doses of 0 and 10 mg were tested. The test yielded a p-value of 0.8674035 which is higher than the p-value of .05 associated with a 95% confidence level. A larger p-value indicates that the relationship between LPS dose and inflammotin concentration in this experiment is not statistically significant.
Summary/DiscussionWhen looking at the results of the experiments, the data suggests that there is a positive relationship in the humans between the LPS dose and the Inflammotin concentration. No such relationship could not be found within the rats experiment. The rats group with 0mg had an average of 10.516 pg/ml of Inflammotin, while the 10mg group had an average of 11.112 pg/ml of Inflammotin. The T-Test done on the rats experiment gave us non-significant p-value, showing that it did not increase significantly enough to be proven valid. Looking at the data for the human experiment, the 0mg group had an average of 3.834 pg/ml of Inflammotin while the 15mg group had an average of 657.941 pg/ml of Inflammotin. Once the ANOVA analyis and post-hoc bonferroni correction was done, it showed that there was a statistically significant difference between all groups. The data suggests, with the human experiment, that there was a positive realtionship between the LPS dose and the Inflammotin.
| |||||||


