BISC220/S14: The Michaelis-Menten Model
Enzyme Kinetics (The Michaelis-Menten Model)
It has been shown experimentally that if the amount of an enzyme is kept constant and the concentration of its substrate is gradually increased, the reaction velocity will increase until it reaches a maximum. After this point, increases in substrate concentration will not increase the velocity (i.e. the amount of product produced per unit of time, dp/dt). The interaction of an enzyme with its substrate and the subsequent conversion of the substrate to product can be represented as shown in Eq. 1 below:

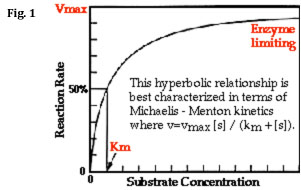
As the substrate concentration is increased (keeping the amount of enzyme constant) a point will be reached when all enzyme molecules are involved in enzyme-substrate complexes (ES). At this point, the rate of product accumulation is limited only by the inherent speed with which the enzyme can catalyze the reaction and release the product (referred to as the turnover number, kcat) and not by the time it takes for enzyme and substrate molecules to encounter one another in solution. (Notice that, in the above model, it is assumed that almost none of the product reverts to substrate.) On a plot of reaction rate (aka velocity) vs. substrate concentration, also known as a Michaelis-Menten plot (see Fig. 1 below), enzyme saturation can be seen as an asymptotic flattening of the curve, where the value of y that is approached is designated Vmax.

The kinetic model proposed by Michaelis and Menten is a steady-state model, meaning that it describes the rate of an enzymatic reaction when [ES] is constant. Using the rate constants illustrated in Eq. 1 above, you can describe this steady state as shown below in Eq. 2:
By doing the following:
• defining a new constant, Km (the Michaelis constant), as being equal to (k2 + kcat)/k1
• using an equation that describes all forms of the enzyme: [ET] = [E] + [ES]
• realizing that V= kcat[ES] and Vmax = kcat[ET] at steady-state when all enzyme molecules are part of ES complexes
• and a lot of algebraic rearrangment
Michaelis & Menten arrived at their famous equation:
Michaelis constants have been determined for many of the commonly used enzymes. The size of Km tells us several things about a particular enzyme:
- A small Km indicates that the enzyme requires only a small amount of substrate to become saturated. Hence, the maximum velocity is reached at relatively low substrate concentrations.
- A large Km indicates the need for high substrate concentrations to achieve maximum reaction velocity.
- The substrate with the lowest Km upon which the enzyme acts as a catalyst is frequently assumed to be enzyme's natural substrate, though this is not true for all enzymes.
- Physiological substrate concentrations are often quite close to the Km of the enzyme that acts upon them.
Another important feature of Km is its relationship to substrate concentration and Vmax: you should notice that, in Eq. 3 above, when [S] is equal to Km, the velocity, V, is equal to (1/2)Vmax. In other words, the Km is equal to the substrate concentration that produces a reaction velocity that is 50% of the maximum velocity for the enzyme (see Fig. 1).
It should now be clear that by creating a Michaelis-Menten plot (V vs. [S]) like that in Fig. 1 you can estimate both Vmax and Km. And, by using a program to give you the equation of the hyperbolic curve of the graph, you could calculate these values exactly. However, it is much easier to work with linear rather than hyperbolic curves. Therefore, to calculate Vmax and Km, it is typical to transform the Michaelis-Menten equation by taking the reciprocal of both sides:
You can rearrange Eq. 4 to get:
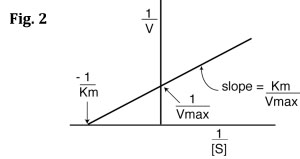
If you look carefully at Eq. 5, you will see that it is the equation of a line (y=mx+b), where y=1/V, m= Km/Vmax, x=1/[S], and b=1/Vmax. Therefore, if you take the reciprocals of all your V and [S] values and plot 1/V vs. 1/[S], you will get a straight line and you can easily calculate Km and Vmax from the equation of the line. This is called a Lineweaver-Burk plot, also know as a double reciprocal plot. An example is shown in Fig. 2 below.

Inhibitors and Calculating Ki
Enzyme inhibitors may interact with enzymes and/or enzyme-substrate complexes in several different ways to diminish the rate of an enzyme-catalyzed reaction. For each mode of inhibition, one can calculate a dissociation constant, Ki, for the inhibitor that reflects the strength of the interaction between the enzyme and the inhibitor. Ki for an inhibitor is analogous to Km for a substrate; a small Ki value reflects tight binding of an inhibitor to an enzyme, whereas a larger Ki value reflects weaker binding. The precise formula that is used to calculate Ki depends on the mode of inhibition, which can be determined experimentally by comparing the “apparent” values of Vmax and Km for an enzyme in the presence of an inhibitor to the Vmax and Km values in the absence of any inhibitor. When you analyze your enzyme kinetics data for the β-galactosidase-catalyzed reaction in the presence of IPTG, you should determine which of the following modes of inhibition best fits your data and use the corresponding formula to calculate a Ki value.
Competitive Inhibition:
In competitive inhibition, because of their molecular similarity, the inhibitor competes with the substrate for an active site on the enzyme. Therefore, the rate of catalysis depends on the relative concentrations of the inhibitor and the substrate. Competitive inhibition can be overcome by a vast excess of substrate because, under that circumstance, enzyme-substrate complexes will form much more frequently than enzyme-inhibitor complexes and, consequently, the enzyme will be operating “at full strength” even though some inhibitor is present in the reaction tube. Because of this, in the presence of a competitive inhibitor, the Vmax for an enzyme should be the same as for the uninhibited case; the Km, on the other hand, should be larger in the presence of the inhibitor. (How will this look on your L-B plot?) This change in the Km for a competitively inhibited reaction reflects an effective decrease in the affinity of the enzyme for substrate due to the inability of substrate molecules to interact with enzyme molecules that are already bound to inhibitor. If your calculated Vmax and Km values match this pattern, you can calculate Ki using the following formula:

Noncompetitive Inhibition:
In noncompetitive inhibition, the substrate and inhibitor do not compete for the same binding site. A non-competitive inhibitor usually binds somewhere other than the active site, but is able to change the conformation of the active site in such a way that the substrate is not able to efficiently catalyze the reaction. The level of inhibition is dependent on the concentration of the inhibitor but is not reduced by increasing concentrations of substrate because there will always be some enzyme molecules that are “out of commission” because they are bound to inhibitor. Because of this, the Vmax for an enzyme in the presence of a noncompetitive inhibitor will be less than under uninhibited conditions. The magnitude of this decrease will reflect the strength of the interaction between the enzyme and the inhibitor. However, there will be no change in the Km. (How will this look on your L-B plot?) Ki for a noncompetitive inhibitor can be calculated using the following formula:
Uncompetitive Inhibition:
In uncompetitive inhibition, the inhibitor (I) is ONLY able to bind to the enzyme-substrate complex (ES), not to the free enzyme (E). In this case, as for noncompetitive inhibition, the Vmax decreases in the presence of the inhibitor because some of the enzyme molecules will always be “out of commission.” However, the Km also decreases because some of the substrate is always bound up in ESI complexes where it cannot be converted to product, decreasing the effective dissociation constant for the substrate, which is reflected in the Km. In fact, for true uncompetitive inhibition, the Vmax and the Km are decreased by the same factor, so the ratio of Km/Vmax does not change. This results in a Lineweaver-Burk plot with two parallel lines corresponding to the uninhibited and inhibited reactions.

For an uncompetitive inhibitor, the Ki can be calculated using either the Vmax or Km values:

Notice that the formula on the left is the same as the one for noncompetitive inhibition.
Mixed Inhibition:
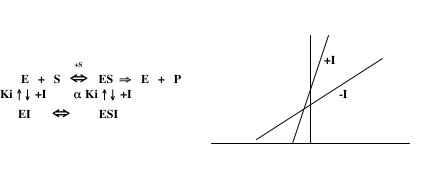
If the kinetic data for an inhibitor do not match any of the above patterns, the inhibitor may act in a mode referred to as mixed inhibition. In this scenario, the inhibitor can bind to both E and ES, but with different affinities. In this case, there are two Ki’s (one for the dissociation of EI and one for the dissociation of ESI) that are related to each other by a variable, α. In cases of mixed inhibition, the Km is usually increased and the Vmax is usually decreased in comparison to the values for the uninhibited reaction. A typical Lineweaver-Burk plot for mixed inhibition is shown on the right below. It is not possible to calculate a Ki value for this type of inhibition with the data gathered in this lab. If you think your data suggest a mixed inhibition mechanism, you should determine with which of the other modes of inhibition they are most consistent and use that formula to calculate a Ki value. Notice that, when the variable α is very large, the mechanism of inhibition approaches uncompetitive, whereas when α is very small, it approaches either competitive or noncompetitive.

