BIOL368/F14:Isabel Gonzaga Week 10
HIV Structure Project Addendum
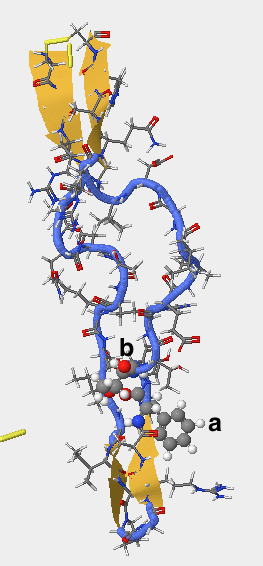
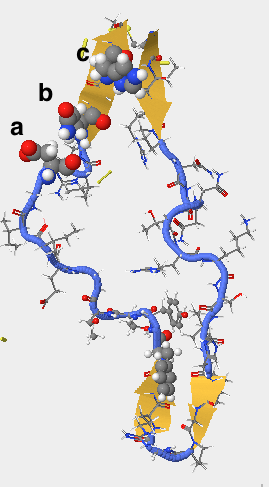
The Huang et. al (2005) 2B4C structure was uploaded onto the StarBiochem software. The V3 region was isolated and imaged with its contained secondary structures. The amino acid side group positions predicted to change within secondary structures of the V3 region (from the PSIPred prediction) were isolated and imaged.


Introduction to DNA Microarrays
Discovery Questions taken from Campbell, A.M. and Heyer, L.J. (2003), Chapter 4 and can be found on the Week 10 Assignment page.
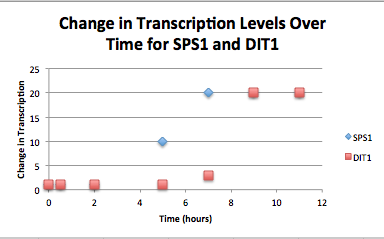
1. (Question 5, p. 110) Choose two genes from Figure 4.6b (PDF of figures on MyLMUConnect) and draw a graph to represent the change in transcription over time.

This graph shows the change in transcription levels over time for SPS1 (blue) and DIT1 (red). SPS1 and DIT1 overlap at the same transcription level at the tree time periods between 0 and 2 hours.
2. (Question 6b, p. 110) Look at Figure 4.7, which depicts the loss of oxygen over time and the transcriptional response of three genes. These data are the ratios of transcription for genes X, Y, and Z during the depletion of oxygen. Using the color scale from Figure 4.6, determine the color for each ratio in Figure 4.7b. (Use the nomenclature "bright green", "medium green", "dim green", "black", "dim red", "medium red", or "bright red" for your answers.)
| Gene | 1 Hour | 3 Hour | 5 Hour | 9 Hour |
|---|---|---|---|---|
| Gene X | black | dim red | black | medium green |
| Gene Y | black | medium red | dim green | bright green |
| Gene Z | black | dim red | dim red | dim red |
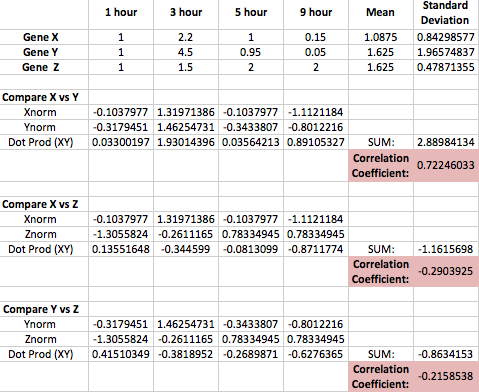
3. (Question 7, p. 110) Were any of the genes in Figure 4.7b transcribed similarly? If so, which ones were transcribed similarly to which ones?

The correlation coefficient was calculated between genes to check if they were transcribed similarly. None of the coefficients approach 1 or -1, showing no sign of similarity.
4. (Question 9, p. 118) Why would most spots be yellow at the first time point? I.e., what is the technical reason that spots show up as yellow - where does the yellow color come from? And, what would be the biological reason that the experiment resulted in most spots being yellow?
Most spots are yellow at the first time point because at the initial time point, genes are not able to be induced or repressed, so transcription is not affected yet. Yellow is a combination of the Red and Green colors.
5. (Question 10, p. 118) Go to the Saccharomyces Genome Database and search for the gene TEF4; you will see it is involved in translation. Look at the time point labeled OD 3.7 in Figure 4.12, and find the TEF4 spot. Over the course of this experiment, was TEF4 induced or repressed? Hypothesize why TEF4’s change in expression was part of the cell’s response to a reduction in available glucose (i.e., the only available food).
The TEF4 data was accessed on the Sacchromyces Genome Database. Over the course of the experiment, TEF4 goes from yellow towards a bright green. This shows that the gene was repressed over time.
6. (Question, 11, p. 120) Why would TCA cycle genes be induced if the glucose supply is running out?
The tricarboxylic acid cycle converts the products of alcohol dehydrogenase to acetyl-CoA. Pyruvate carboxylase is induced which shifts pyruvate towards oxalacetate to enter the TCA cycle. Phosphoenolpyruvate carboxykinae and fructose 1,6-biphosphatase are induced, which are part of glycolysis. Inducing the TCA cycle allows the cell to maximize energy yield.
7. (Question 12, p. 120) What mechanism could the genome use to ensure genes for enzymes in a common pathway are induced or repressed simultaneously?
The genome can ensure genes for enzymes in a common pathway are induced or repressed simultaneously by clustering genes of similar expression patterns within the same/similar promoter sequence. This is consistent with the Guilt By Association method of predicting gene functions and transcription factors.
8. (Question 13, p. 121) Consider a microarray experiment where cells deleted for the repressor TUP1 were subjected to the same experiment of a timecourse of glucose depletion where cells at t0 (plenty of glucose available) are labeled green and cells at later timepoints (glucose depleted) are labeled red. What color would you expect the spots that represented glucose-repressed genes to be in the later time points of this experiment?
The DNA chip will appear red at the glucose-repressed spots because TUP1 is not present to repress glucose.
9. (Question 14, p. 121) Consider a microarray experiment where cells that overexpress the transcription factor Yap1p were subjected to the same experiment of a timecourse of glucose depletion where cells at t0 (plenty of glucose available) are labeled green and cells at later timepoints (glucose depleted) are labeled red. What color would you expect the spots that represented Yap1p target genes to be in the later time points of this experiment?
Yap1p target spots will appear red on the DNA chip. Glucose will be depleted at later time points because the glucose-repressing genes are repressed.
10. (Question 15, p. 121) Could the loss of a repressor or the overexpression of a transcription factor result in the repression of a particular gene?
Yes, depending on the biological pathway, repression of a particular gene is possible with the loss of a repressor or over expression of a TF.
11. (Question 16, p. 121) Using the microarray data, how could you verify that you had truly deleted TUP1 or overexpressed YAP1 in the experiments described in questions 8 and 9?
To verify the deletion or over expression of the transcription factor, the gene that codes for the TF should be included on the assay. That way, its presence may be quantified and compared to other genes affected.
Week 11 Project Preparation
Weekly Assignments
- Week 1 Assignment
- Week 2 Assignment
- Week 3 Assignment
- Week 4 Assignment
- Week 5 Assignment
- Week 6 Assignment
- Week 7 Assignment
- Week 8 Assignment
- Week 9 Assignment
- Week 10 Assignment
- Week 11 Assignment
- Week 12 Assignment
- Week 13 Assignment
- Week 15 Assignment
Class Journals
- Class Journal Week 1
- Class Journal Week 2
- Class Journal Week 3
- Class Journal Week 4
- Class Journal Week 5
- Class Journal Week 6
- Class Journal Week 7
- Class Journal Week 8
- Class Journal Week 9
- Class Journal Week 10
- Class Journal Week 11
- Class Journal Week 12
- Class Journal Week 13
- Class Journal Week 15