Austindias Week 12
Purpose
The purpose of this assignment is to extract parameters from Table 1 of the Tai et al (2007) journal club paper and establish a 2-nutrient chemostat MATLAB model, to which these values can be applied.
Methods
- Described the yield quantity Y Glu/X as a ratio of specific quantities relating to the 2-nutrient chemostat model from class.
- Determined the flux qGlu as a ratio of specific quantities relating to the 2-nutrient chemostat model from class.
- Converted residual glucose and residual ammonia from mM to grams.
- Determined the length of time the chemostat is operated before data is collected.
- Distinguished as many model parameters as I could from this data: using the "warm" data and both glucose- and ammonium-limited data.
- Modified the MATLAB files chemostat_script.m and chemostat_dynamics.m to simulate a 2-nutrient chemostat using the attached files here
Results
- Y Glu/X refers to the ratio of dry weight cell mass over glucose mass. In mathematical terms this ratio relates to: (cell mass dry weight)/(glucose mass)
- Relating to the 2-nutrient chemostat model from class this rato is equal to 1/E.
- qGlu refers to the ratio of the concentration of glucose over dry weight cell mass multiplied by unit of time. In mathematical terms this ratio relates to: (mmol Glucose)/((cell mass dry weight)(time))
-Glucose 12 C
mass of residual glucose = .0028 mol x 180.156 g/mol = 0.5 g
mass of residual ammonium = .0652 mol x 18.038 g/mol = 1.18 g
-Glucose 30 C
mass of residual glucose = .0003 mol x 180.156 g/mol = 0.05 g
mass of residual ammonium = .0613 mol x 18.038 g/mol = 1.11 g
-Ammonium 12 C
mass of residual glucose = .09 mol x 180.156 g/mol = 16.2 g
mass of residual ammonium = .0015 mol x 18.038 g/mol = .027 g
-Ammonium 30 C
mass of residual glucose = .0851 mol x 180.156 g/mol = 15.33 g
mass of residual ammonium = .0002 mol x 18.038 g/mol = .0036 g
- The chemostat is operated for 100 hours before data is collected.
- (1L)(1hr/0.03L) = 33.3 hr x 3 volume changes = 100 hr
For the carbon limited 30C and nitrogen limited 30C I estimated the growth rate using data from an experiment that used the same species of yeast (Held, 2010). Growth rate is known to be equivalent to slope of the graph of OD (optical density) versus time (Hall et al., 2013). Since the paper gives mOD/min as 3.68, I converted this to OD per hour and assumed this value to be the growth rate. This rate was used as parameter 'r' for both models below.
(3.68/1000)*(60 min/hr)= .221
After finding the growth rate I used this value to then solve for parameters 'K' and 'L'. Using the equations r = q + (K/y) and r = q + (L/z). For the carbon limited 30 C I found 'K' and 'L' to be equal to .0096 and .212 respectively. For the nitrogen limited model these parameters were calculated as 2.93 and .00069 respectively.
The 'F' parameter was calculated by using the equation Fxq-qz+qv= 0 and solving for 'F'. This value was calculated as 2.2.
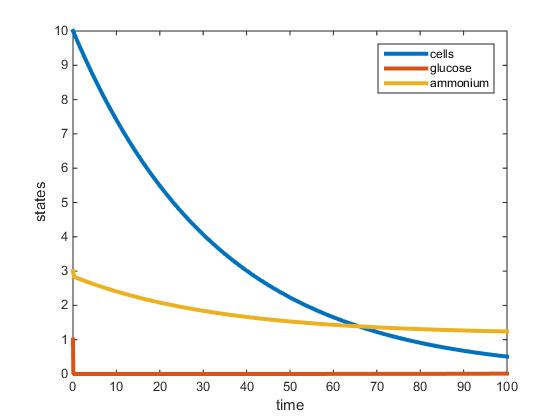
- Carbon-Limited 30 C:
- t0 = 0
- t1 = 100
- x0 = 5
- y0 = 3
- z0 = 1
- r = 0.221
- K = .0096
- E = 14.3
- u = 25;
- q = 0.03
- F = 2.2
- L = 0.212
- v = 5
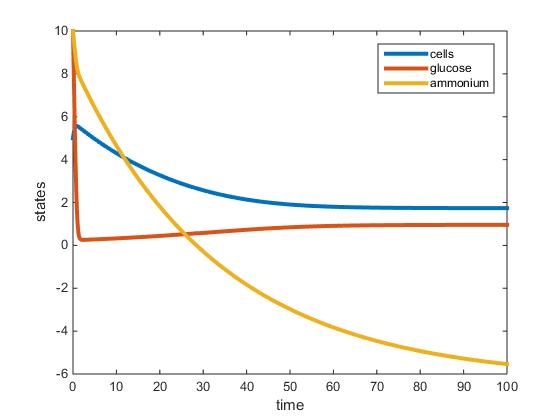
- Nitrogen-Limited 30 C:
- t0 = 0
- t1 = 100
- x0 = 5
- y0 = 10
- z0 = 10
- r = 0.221
- K = 2.93
- E = 14.3
- u = 46
- q = 0.03
- F = 2.2
- L = 0.00069
- v = 0.65
- MATLAB files created for two nutrient model are attached below:
Conclusion
The MATLAB model was successfully adjusted to accommodate two nutrients, but could not be used to accurately model the data presented in Tai et al (2007). In the nitrogen limited model the amount of glucose almost instantaneously goes to zero, suggesting an error in the input parameters. The model somewhat supports the establishment of steady state around 100 hours. However, according to the model the residual glucose is zero, which does not match the amount of residual glucose noted in Tai et al (2007). In the ammonium limited model, residual ammonium is denoted as a negative number at steady state. I am unsure as to which parameter is causing the amount of ammonium to have a negative value. The most difficult parameter to discover according to Tai et al (2007) seems to be the max growth rate 'r'. After finding 'r' it would be relatively straightforward to solve for 'L' and 'K'. I suspect that the 'r' value should be higher, since in both models cell biomass decreases. In the glucose model especially, cell biomass drops dramatically over the course of 100 hours. This may be indicative that yeast cells are in the death phase and experiencing exponential death after decline of nutrients. However, this would not be plausible, since I would expect the cell biomass to increase exponentially before 100 hours until steady state is reached. The value for 'L' in both models for glucose limited and nitrogen limited at 30 C are plausible since (z)/(z+L) is approximately 1. The objective to model the two nutrient chemostat from the Tai et al (2007) paper was unsuccessful. The biggest obstacle that still has to be overcome to successfully model the two nutrient chemostat using data from Tai et al (2007) would be to discover the maximum growth rate 'r'.
Acknowledgments
- Met with my homework partner in person and texted Brianna Samuels to help each other with the assignment.
- Used equations derived by Dr.Fitzpatrick to help with solving for parameters.
Except for what is noted above, this individual journal entry was completed by me and not copied from another source.
Austindias (talk) 17:59, 26 April 2019 (PDT)
References
Dahlquist, K. and Fitzpatrick, B. (2019). BIOL388/S19:Week 12. [online] openwetware.org. Available at:Week 12 Assignment Page [Accessed 21 Apr. 2019].
Hall, B. G., Acar, H., Nandipati, A., & Barlow, M. (2013). Growth rates made easy. Molecular biology and evolution, 31(1), 232-238.
Held, P. (2010). Monitoring Growth of Beer Brewing Strains of Saccharomyces Cerevisiae - The Utility of Synergy H1 for Providing High Quality Kinetic Data for Yeast Growth Applications | November 17, 2010.
Tai, S. L., Boer, V. M., Daran-Lapujade, P., Walsh, M. C., de Winde, J. H., Daran, J. M., & Pronk, J. T. (2005). Two-dimensional transcriptome analysis in chemostat cultures combinatorial effects of oxygen availability and macronutrient limitation in Saccharomyces cerevisiae. Journal of Biological Chemistry, 280(1), 437-447.
Tai, S. L., Daran-Lapujade, P., Walsh, M. C., Pronk, J. T., & Daran, J. M. (2007). Acclimation of Saccharomyces cerevisiae to low temperature: a chemostat-based transcriptome analysis. Molecular Biology of the Cell, 18(12), 5100-5112.
Return to Homepage Austin Dias

