20.109(S11):Evaluate DNA and choose clone (Day6)
Introduction
Last time you transformed your new DNA construct into the edge detector strain (JW3367c) cells. You prepared three candidate plates, each of which should now contain colonies that are genetically identical to each other. We grew one colony from each plate in liquid culture, and today you will pick one of those to assay for reduced Plux-λ leakiness. You will figure out which clone to use by analyzing your sequencing data.
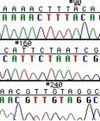
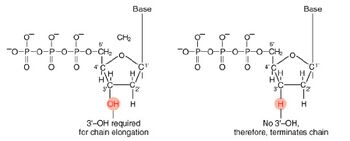

The invention of automated sequencing machines has made sequence determination a relatively fast and inexpensive endeavor. The method for sequencing DNA is not new but automation of the process is recent, developed in conjunction with the massive genome sequencing efforts of the 1990s. At the heart of sequencing reactions is chemistry worked out by Fred Sanger in the 1970s which uses dideoxynucleotides (see schematic above left). These chain-terminating bases can be added to a growing chain of DNA but cannot be further extended. Performing four reactions, each with a different chain-terminating base, generates fragments of different lengths ending at G, A, T, or C. The fragments, once separated by size, reflect the DNA’s sequence. In the “old days” (all of 10 years ago!) radioactive material was incorporated into the elongating DNA fragments so they could be visualized on X-ray film (image above center). More recently fluorescent dyes, one color linked to each dideoxy-base, have been used instead. The four colored fragments can be passed through capillaries to a computer that can read the output and trace the color intensities detected (image above right). Your sample was sequenced in this way on an ABI 3730 DNA Analyzer.
Analysis of sequence data is no small task. “Sequence gazing” can swallow hours of time with little or no results. There are also many web-based programs to decipher patterns. The nucleotide or its translated protein can be examined in this way. Thanks to the genome sequence information that is now available, a new verb, “to BLAST,” has been coined to describe the comparison of your own sequence to sequences from other organisms. BLAST is an acronym for Basic Local Alignment Search Tool, and can be accessed through the National Center for Biotechnology Information (NCBI) home page.
A complementary alternative to sequencing is the diagnostic digest. Imagine that your insert modification introduced a new restriction site, or deleted one that was there before. If the banding pattern that results from cutting with this enzyme (and perhaps one other to decrease fragment size) is distinguishable for the original and modified plasmid, then seeing the latter pattern strongly suggests that the candidate clone is correct. You will perform some theoretical diagnostic digests for homework, as this is a very useful skill. However, you might be wondering why you would ever go through the trouble of designing and performing diagnostic digests, when sequencing is relatively simple and yields more information. Here, the idea of scale becomes important. Sequencing costs $8 per reaction, which can add up if you need to examine, say, 10 or more candidates. Agarose gel electrophoresis, by comparison, costs perhaps $1 per candidate. Since both methods require DNA isolation, one is not dramatically more labour intensive than the other. (A method called colony PCR avoids this labour. Can you guess what it might entail?) Finally, banding patterns can give a quick readout of many candidate colonies compared to the time it takes for the individual sequencing analyses you will perform today. Of course, there's no reason one couldn't automate the analysis process with a bit of (computer, not DNA) code! Typically, screening many candidates by diagnostic digest (also called restriction mapping) and then choosing a select few for sequencing gives the best of both worlds.
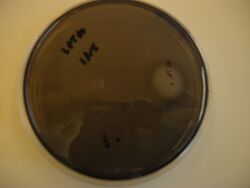
Once you have chosen a clone, you will test it in both liquid and solid culture. The liquid cultures will yield quantitative information about how much you have reduced promoter leakiness and affected the truth table for the IPTG-sensitive system. The plate-based assay will give a quick visual check of your results. Recall that the IPTG-sensitive system will not exhibit spatial variation simply by use of a mask. However, the four truth table cases can be observed on one plate by spotting small amounts of IPTG and AHL on the hardened media. Near the IPTG spot there should be no black pigment, and near the AHL spot there should be a darker black colour than far away from it - the better the contrast, the lower the basal expression of the hybrid promoter.
Protocols
Part 1: EHS Talk
In preparation for the tissue culture work you will do in Module 3, today you will hear a talk on Biosafety by Martha Anne Adams from the Environment, Health and Safety Office.
Part 2: Analyze sequence data
Your goal today is to analyze the sequencing data for three independent colonies from your pED-IPTG-YFD cloning experiment and then decide which colony to proceed with. You will want to have this document handy, which is the entire sequence of pED-IPTG-INS in GenBank (gb) format. The file can be opened using the free program ApE ("A Plasmid Editor"), available for free download at this link. ApE is already installed on our in-lab laptops. You may find this program useful for creating schematics or doing the theoretical diagnostic digest homework.
The data from the MIT Biopolymers Facility is available at this link. Choose the "Login to dnaLIMS" link and then use "astachow" and "be109" to login. At the bottom of the left panel should be a link to download your sequencing results. First, select order #32816 and sample C1, then click "submit." This sample is the original pED-IPTG-INS and your analysis of it is just for practice. Later you can select the order # for your own design (33794 for T/R, 33813 for W/F). The quickest way to start working with your data is to follow the "view" link. From this link you'll see the sequencing traces and can click on "sequence text" to view it.
Rather than look through the sequence to magically find the relevant portion, you can align the data you just got with the original IPTG-sensitive plasmid sequence and the differences will be quickly identified. There are several web-based programs for aligning sequences and still more programs that can be purchased. The steps for using one web-based tool are sketched below.
Align with "bl2seq" from NCBI
- The alignment program can be accessed through the NCBI BLAST page or directly from this link
- To allow for gaps in the sequence alignment, uncheck the "filter" box. All the other default settings should be fine.
- Paste the sequence text from your sequencing run into the "Sequence 1" box. This will now be the "query." If there were ambiguous areas of your sequencing results, these will be listed as "N" rather than "A" "T" "G" or "C" and it's fine to include Ns in the query.
- Paste the pED-IPTG-INS sequence into the "Sequence 2" box.
- Your samples were probed with a forward-facing primer, and thus you can copy the coding strand directly.
- Click on Align. Matches will be shown by vertical lines between the aligned sequences. You should see a long stream of matches, followed by lots of errors in the last ~200bp of the sequence – ignore the error-ridden part of the data, as it may not accurately reflect your new plasmid. In the stream of matches, the missing lines indicating your mutation, deletion, and/or addition should stand out. If they don’t, use the numbering or Find tool to locate the appropriate sequence.
- You should print a screenshot of each alignment to pdf (and to paper if you desire). These can be used to prepare a figure showing what you found today. You might want to email yourself the alignment screen shots or post them to your wiki userpage.
If all three colonies for your design have the correct sequence, pick any of them; ditto if all are inconclusive. If one appears right and the others don’t, of course proceed with the former. Finally, if all are clearly wrong, talk to a member of the teaching faculty.
Part 3: Model system solid cultures
- Begin by following the Day 1 protocol for preparing edge detection plates. Prepare 4 plates, 2 with cells carrying the original pED-IPTG-INS plasmid, and 2 carrying your modified plasmid.
- Use 75 μL of the pED-IPTG-INS strain, as before. Then use enough of the pED-IPTG-YFD strain so that you use an equal OD of each cell type.
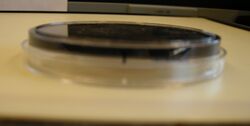
- After two of the plates (one for each cell strain) have hardened, carefully mark two spots at the edge of both the plate and the lid, 90 ° apart. Using the slightly protruding lines that mark the lid into quarters may work best. (See images below.)
- Using a ruler, mark a dot 1.5 cm inward from the edge for each of the two dots you made before.
- In one spot, put 5 μL of IPTG, and in the other put 5 μL of AHL.
- Treat the other two plates with only an IPTG spot (no AHL).
- Wrap your plates in one piece of coloured tape and put them in the 37 °C incubator where they will stay overnight.
Part 4: Prepare liquid cultures for β-gal assay of modified system
Today you will prepare to get the truth table for your new cell strain (carrying pED-IPTG-YFD) in duplicate. You will also re-do the truth table from week 1 (cells carrying pED-IPTG-INS), as data taken the same day will be most comparable. You can do the latter experiment singly or in duplicate, depending on how confident you are of your results/technique from the first week.
If you need more detail than the protocol below provides, refer to Day 1 Part 2.
- If you are waiting for the spectrophotometer, you can begin by picking up twelve (or sixteen) 14 mL round-bottom tubes and preparing sticky labels for your samples (described above).
- Measure the OD600 value of a 1:10 dilution of your cells in the usual way. The OD600 of the pED-IPTG-INS cells will be announced in class.
- Prepare one tube with 25 mL and one with 15-25 mL of LB with ampicillin; the latter volume depends on whether you are working singly or in duplicate for the original plasmid.
- Dilute the cell stock to an OD of 0.0025 in the LB-amp, then distribute 2.5 mL of diluted cells to each round-bottom tube with a 5 or 10 mL serological pipet.
- Distribute additives to each tube such that you assay the entire truth table space, making sure that each tube is well-labeled:
- AHL is added as 2.5 μL (1000X stock).
- IPTG is added as 12.5 μL of (1 M stock).
- Place your tubes on the roller wheel, remembering the following good practices:
- Completely snap shut the tube caps.
- Be careful not to tip the tube "backwards" as you insert it in the roller wheel.
- Balance your tubes as if on a centrifuge.
- Turn the roller wheel back on!
- Your cultures will be grown overnight, then moved to 4 °C until next time.
Part 5: Colony counts
Do find a moment today to count the colonies on your plates from last time and post them on today's Talk page.
For next time
- This homework problem requires use of ApE, so you should either do it during class or download ApE onto another computer you have access to.
- Begin by opening pED-IPTG-INS in ApE. Go into the Enzyme Selector and select the option that displays only unique enzymes. Choose the Graphic Map + U option and take a screenshot and/or print this plamid map for your reference. You should also hand in the map for homework.
- Many of the components on the plasmid map have BioBrick part numbers. R0065 is the Plux-&lambda promoter. Briefly, what kind of part is B0034?
- How many restriction sites are on the plasmid that cut exactly twice? That cut more than twelve times?
- Imagine that you are able to design a promoter modification that does not change the length of the sequence, but through mutation includes a new BlpI site. At what base-pair is the other BlpI site on this plasmid? Update: I originally intended to say choose the beginning of the promoter sequence. As the sequence is < 100 bp long, it doesn't affect the rest of the question if you chose another part of the sequence. You do not need to design the base-pair changes or make an updated plasmid map that includes the second BlpI site. The below is just a thought experiment.
- Design a theoretical double digest that will allow you to readily distinguish between parent and modified plasmid. Choose a second enzyme in addition to BlpI to digest with such that:
- Both enzymes are compatible with/efficient in the same NEB buffer. (Name the buffer.)
- The other enzyme is dam/dcm methylation insensitive.
- The 3 fragment sizes obtained for the modified plasmid are all different from each other, and are between ~1-8 Kbp in size.
- What will the fragment sizes be for the parent plasmid? For the modified plasmid?
- Write the opening context-setting paragraph (or two) of your results section, in which you introduce the system you are working with and your immediate investigative goal.
- Draft an outline of the rest of the results to indicate the approximate high-level content and its order. (Not the actual results, just the type of results that will be discussed. Essentially, what order will your figures be in and what will they consist of?)
- Draft the opening paragraph (or section, if longer than one paragraph) of your introduction. You may find that it's a pretty rough draft, and I won't expect you to have many outside citations yet. Instead, briefly brainstorm around the following questions.
- What 'big picture' framing of your investigation might be relevant?
- What topics might you need to learn more about?
- Besides the edge detector paper, what kind of citations (general topics) might you need to find?
- Outline the other two paragraphs (sections) of the introduction at a high-level. Because you are most intimately familiar with the content of the third paragraph, you might find it easiest to start with this one, and then zoom out instead of in.
- Skim the entire Hasty lab journal article, carefully read your assigned section, and come prepared to discuss it next time.
- You will get to know which figure you are presenting in advance because you have a lot of other homework to do this weekend.
Reagent list
Parts 3 and 4 as on Day 1.
