BME100 s2016:Group16 W1030AM L5
| Home People Lab Write-Up 1 | Lab Write-Up 2 | Lab Write-Up 3 Lab Write-Up 4 | Lab Write-Up 5 | Lab Write-Up 6 Course Logistics For Instructors Photos Wiki Editing Help | |||||||
OUR TEAM
LAB 5 WRITE-UPPCR Reaction ReportOur team's experiece with pipetting the samples (DNA, primers, necleotides, and enzymes) to set up the reaction was successful. The pre-lab reading did help a lot. We made sure we understood the difference between the first and second stop on the pipettor. The first stop of the pipettor measures the exact amount we set the device to. We made sure that the tip was half way submerged in the liquid and paused for one second before we removed the pipette. The second stop on the pipettor releases all the liquid that was draw into the tip. We also paused for two seconds before released the plunger. Fluorimeter ProcedureSmart Phone Camera Settings
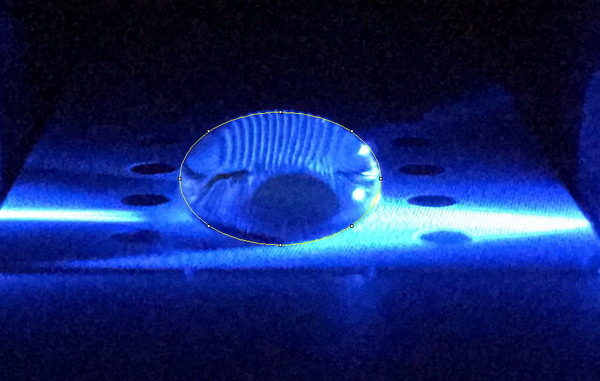
Camera set-up For our documentation records we used an iPhone 6s. Before setting the iPhone camera in place, we adjusted the timer to three seconds so that we would have time to focus and black out the surroundings before the picture was taken. Then we placed the iPhone camera four centimeters away from the fluorimeter on a slightly elevated stand so that the camera was level and perpendicular with the droplette. The fluorimeter and iPhone camera are placed inside the lightbox when the picture is ready to be taken.
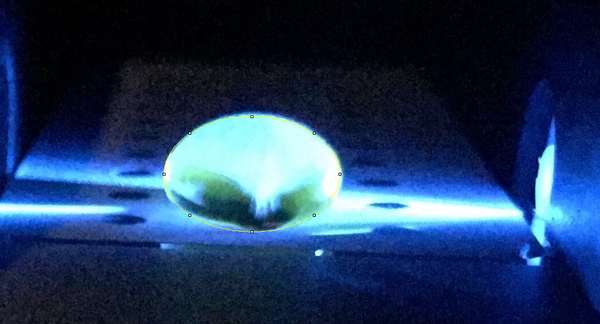
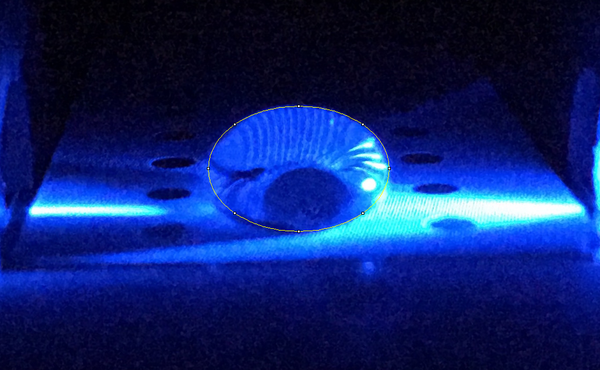
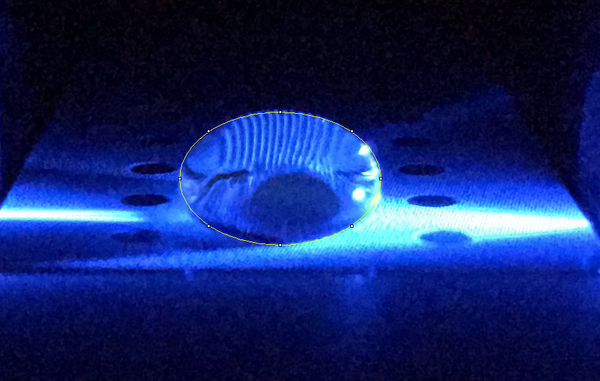
Data Collection and AnalysisImages of High, Low, and Zero Calf Thymus DNA
High Concentration (5 μg/mL sample)
Images of Our PCR Negative and Positive Controls
The values of the initial PCR product concentration for the first, and the second sample were closer to the negative control initial PCR product concentration. However, the value of the initial PCR product of the third sample was closer to the value of positive control. As a result, It was assumed that patient 29688 should be considered negative. This value however, and our value for the negative control too are both fairly unreasonable, as it is not possible to have a negative PCR concentration. There must have been some issue in the lab proceedings that led to these poor values, in addition to our poor values for our graph which is seen by the very small R^2 value for correlation.
The values of initial PCR product concentration the all three samples are all closer to the value of initial PCR product concentration of the positive control more than the negative control. Therefore, patient 65775 was considered positive.
| |||||||


