User:Vivian A Zohery/Notebook/Biology 210 at AU
3/15/14
Embryology Lab (Feb. 18, 2014 - Mar. 5, 2014)
- Introduction
Zebra fish serve as a great example for scientists studying the effects of neuro-toxic substances on embryonic development. In the case of Nicotine, as presented in a study by Beatrice Parker and Victoria K. Connaughton, it can be clearly seen how such a substance affects growth, pigmentation, heart rate, and of course swimming behavior. The effects nicotine has on the physiology of the body depends on the amount, but in general, it is known to be a hazardous chemical that is potentially harmful for the development of a fetus/embryo. This harm includes a stuntness in growth, small eye diameters, slow heart rates. Despite this, the fish become alert and fast. What is also important about studying the effects of Nicotine on Zebra fish is that it indicates the potential harm nicotine can have on human embryos as well; this is why it is beneficial to observe the development of the fishes. Also, zebra fish eggs are cost-efficient and do not require an intense environment to develop in.
- Methods/Procedures
During all the days, dependent variables were observed and recorded. Sometimes it was hard to measure certain variables, but everything was recorded.
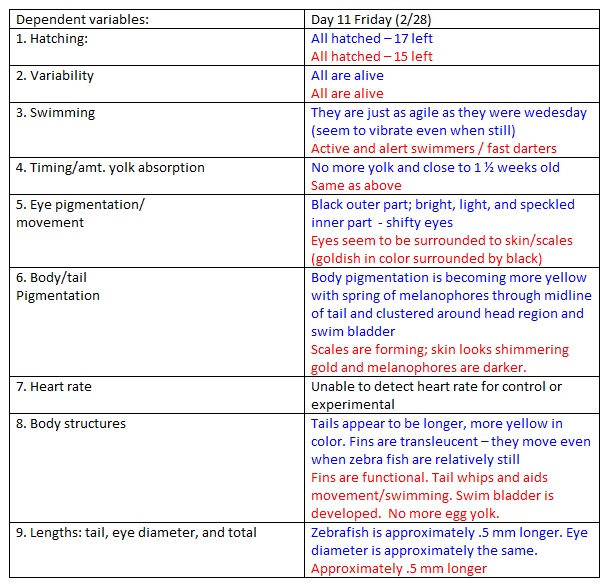
The dependent variables included: number of eggs hatched, number of eggs/fished dead, swimming and movement, timing and yolk absorption, eye pigmentation and movement, development of body/tail and pigmentation (also known as melanophores), heart rate, other bodily structures such as fins and swim bladders, and finally, the measurements of body length, tail and eye diameter on fixed samples.
Day 1
To start off the experiment we obtained 2 petri dishes and labelled them with out names, date, and lab section as well as a label for "control" and "experimental". In the "control" petri dish, 20 mLs of distilled water were placed, and in the experimental, 20 mLs of Nicotine solution were placed. In another petri dish, 40 translucent and healthy zebrafish eggs were gathered and separated into 2 even piles for each dish.
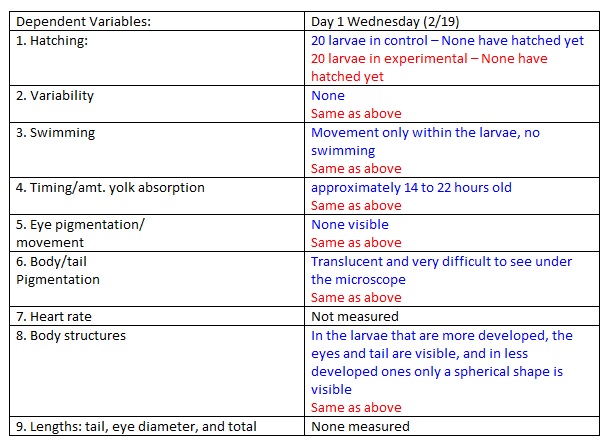
Once placed and ready, observations were made on their embryonic stage and other characteristics that could be measured. We followed the list of dependent variables (mentioned above) and recorded the observations in a form of a chart. The heart rate was hard to determine because the fishes were cuddled and their heart couldn't be seen.
Day 3
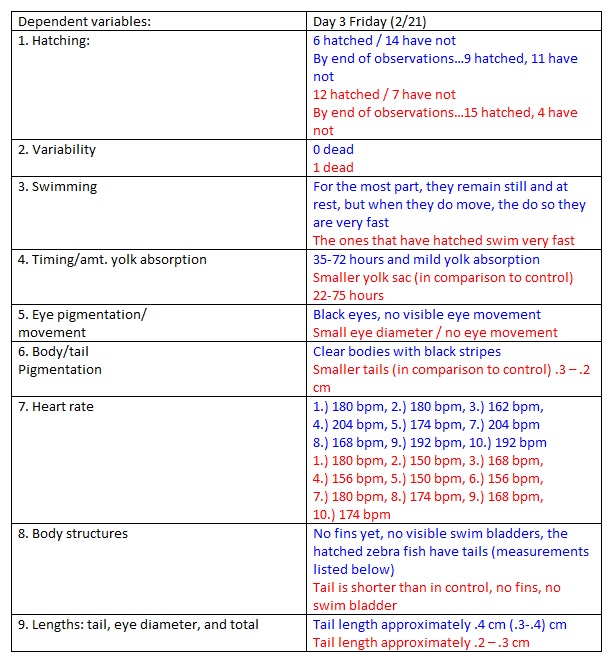
We changed the water for the first time; 10 mLs were taken out of the control/experimental petri dishes and replaced with 10 mLs of water/nicotine respectively. After changing the water we observed the dependent variables as we did on Day 1.
This time we were able to see the heart rate of some ZF so we used them as a sample. Everything was recorded in the table. To measure heart rate, we zoomed in on the zebra fish and counted heart rate for 10 seconds, and then multiplied this by 6 to get beats per minute (bpm)
Day 6
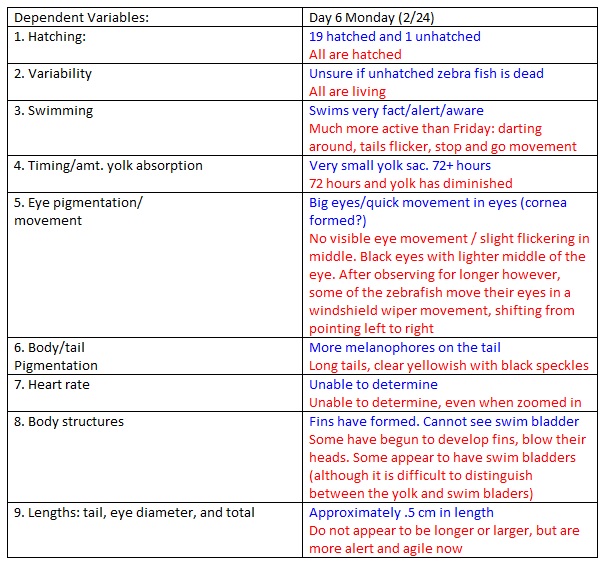
Same water change, only this time we added 15 mLs instead of 10 mLs in each solution because we feared the fishes might need more water to swim in as they developed. After that the dependent variables were examined like before on Days 1 and 3.
Day 8
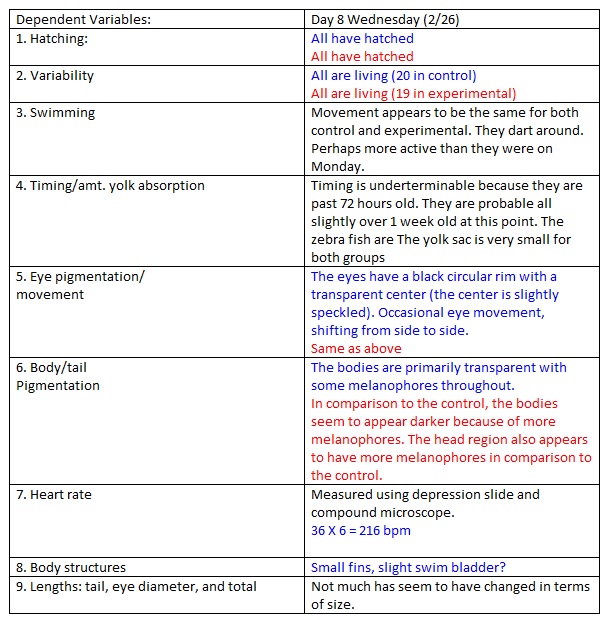
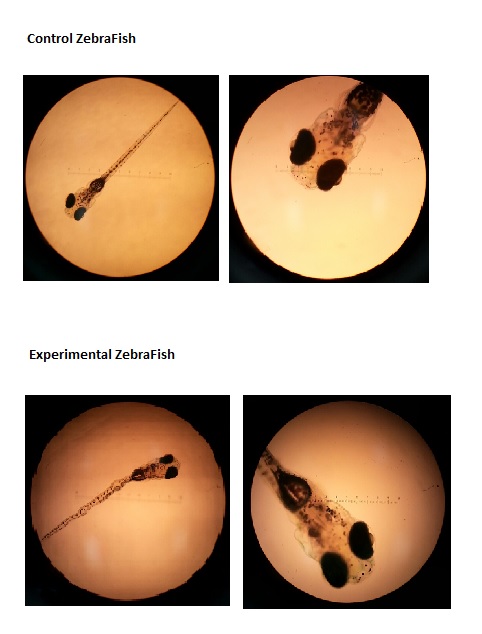
Same procedure again as days 1, 3, and 6; changed the water and observed dependent variables. The only difference is that we were able to observe the ZF under a microscope and take pictures of them. On this day, we sacrificed 3 ZF from the control and experimental dishes, taking them and placing them in a tube that was filled with paraformaldehyde; this put them to sleep so that they were sacrificed "peacefully" without any pain. The fixed samples were to be observed under a microscope the next week.
Day 11
Same procedure as day 3, only this time we added 10 mLs without taking out any water.
Day 16
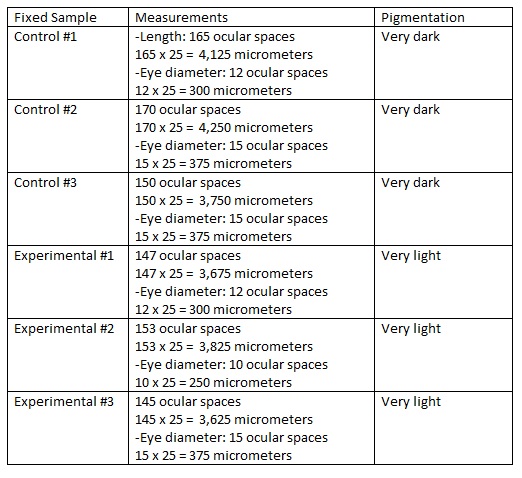
On the final day we were to observe the ZF for the last time and make final measurements. The fixed samples of the ZF were studied under the microscope for precises measurements and were recorded.
At the end of lab we cleaned up and placed all living ZF in proper containers directed by the lab instructor so that they may be taken care of. Dead ZF were counted and disposed of.
- Results
Results in Blue: Control
Results in Red: Experimental
Day 1
NOTES: Live Zebrafish Embryos were translucent while the dead ones were white.
Day 3
NOTES: To measure heart rate, we zoomed in on the zebra fish and counted heart rate for 10 seconds, and then multiplied this by 6 . We preserved out one dead zebra and extracted 10 ml from each dish, replacing it with 15 ml of water and nicotine solution to our control/experimental. We labeled the bottom of out control dish “C” and the bottom of our experimental dish “E” because we were worried about mixing the two up when the covers are off. Also we began to question if another factor in the experiment affecting the zebra fish is the shaking and turbulence they experience while we move the dishes and when we add/abstract water.
Day 6
NOTES: we changed the water like before.
Day 8
NOTES: today we sacrificed 3 control fishes and 3 experimental fishes. 1 experimental fish got lost while transferring them so we had to transfer another one. The water/nicotine mixture was changed again like before.
Day 11
NOTES: We didn't take out any water but rather put in 10mL more.
Day 16: Fixed Samples
NOTES: We are unable to make a table for today because we found that nearly all of our zebra fish in both the control and the experimental are dead. There was one live one in the experimental and it was very lively and darting around: it’s pigmentation is very dark (lots of melanophores). There is one live one in the control, but this one appears to be very close to death. It’s movement is very slow and sluggish – in fact, it is barely moving at all.
We hypothesize that because all of the zebra fish are dead in the control and the experimental, it is due to another variable (perhaps the high temperature in our lab room).
We observed our sacrificed sampled that we prepared on day eight of our study (Wednesday 2/26)
Pictures from Day 8: under 10X and 4X
- Discussion
On days 1 and 11 we weren't able to measure the heart rate of the fishes. On day 1 the embryos were tiny and their tails were blocking the area of their hearts, making it difficult to locate a pulse. On day 11 the fish were swimming very fast and normally they had to be on their side so the heart could be visible.
Interesting behavior that we noticed, especially after the death stroke that struck the ZFs, was that the specimen in the nicotine solution were very alert and swift; they were darting around and seem very active. They were shorter in size and they seemed to possess darker melanophores, but the ZF in the control group seemed more calm and preferred to hang out on the side of the petri dish. Also, on the last day we collected data, all our ZF had died, except for 2 that still lived in the experimental petri dish -the one that had living in nicotine. This may indicate a correlation between nicotine tolerance and coping with extreme weather conditions. Another interesting attribute we noticed is that experimental ZFs were "flexible" rather than being a straight, linear fish; there would bends in their body as they swam, as shown in the pictures.
This study may reflect human conditions in that embryos are at risk of insufficient development and possibly premature birth. Although animals will seem to be alert when under nicotine's effect, their life span will generally be shorter and develop growing issues.
The main limitations of this experiment is the amount of time and the unfortunate accident at the end of the experiment (when all ZF were found dead). In the future, I'd plan to study the effects of nicotine on development into the adult stage and not limit it to just the embryonic stage. That would be useful to see how certain defects in the larvae stage could effect the adult stage of the fish.
3/6/2014
Lab 6: PCR Observations (Feb. 19, 2014)
Introduction:
After selecting one of our bacteria species to be sent of for sequencing, we later received the results the following week. To properly identify the species of the bacteria, we used the NCBI Blast system (Nucleotide Sequenciing). The species was then identified, and research was made about the organism. A minimum of 2 sequences were to be identified in our reports, but in our case, only one of the species from out transect was sequenced so we had to identify another sequence from the same transect but from another lab section.
Procedure:
1) Obtain document with all the sequencing listed.
2) Look for your transect number and lab section and select it
3) Copy and paste the sequencing onto http://blast.ncbi.nlm.nih.gov/Blast.cgi under "Enter accession number(s), gi(s), or FASTA sequence(s)", hit "BLAST"
4) Identify the organism and search online for its characteristics.
5) In your notebook, include a description of what you observed before sending off the sample.
6) Once finished, go back to the document and select a second sequencing and repeat steps 3-5.
Results
PCR Observations:
- Sample 1:
Sequenced:
>A2-T1-2 GGTATTAGCTTACTGCCCTTCCTCCCAACTTAAAGTGCTTTACAATCCGAAGACCTTCTTCACACACGCGGCATGGCTGG ATCAGGCTTTCGCCCATTGTCCAATATTCCCCACTGCTGCCTCCCGTAGGAGTCTGGACCGTGTCTCAGTTCCAGTGTGA CTGATCATCCTCTCAGACCAGTTACGGATCGTCGCCTTGGTGAGCCATTACCTCACCAACTAGCTAATCCGACCTAGGCT CATCTGATAGCGCAAGGCCCGAAGGTCCCCTGCTTTCTCCCGTAGGACGTATGCGGTATTAGCGTTCCTTTCGAAACGTT GTCCCCCACTACCAGGCAGATTCCTAGGTATTACTCACCCGTCCGCCGCTGAATCGAAGAGCAAGCTCTTCTCATCC
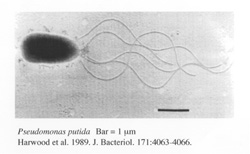
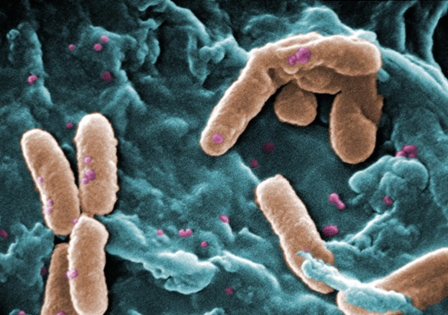
Identified name: Pseudomonas putida
Qualitative Description:
Colony was a green and smooth/small. It seemed to be a gram negative bacteria and bacillus.
Quantitative Description:
Pseudomonas putida is a gram-negative rod-shaped saprotrophic soil bacterium. Based on 16S rRNA analysis, P. putida has been placed in the P. putida group, to which it lends its name. It is the first patented organism in the world. [1]
- Sample 2:
Sequenced:
>M3-T1-2 GTCGAGCGGATGAAGNGGAGCTTGCTCTCTGATTCAGCGNGCGGACGGGTGAGTAATGCCTAGGAATCTGCCTATTAGTG GGGGACAACGTTTCGAAAGGAACGCTAATACCGCATACGTCCTACGGGAGAAAGCAGGGGACCTTCGGGCCTTGCGCTAA TAGATGAGCCTAGGTCGGATTAGCTAGTTGGTGAGGTAATGGCTCACCAAGGCGACGATCCGTAACTGGTCTGAGAGGAT GATCAGTCACACTGGAACTGAGACACGGTCCAGACTCCTACGGGAGGCAGCAGTGGGGAATATTGGACAATGGGCGAAAG CCTGATCCAGCCATGCCGCGTGTGTGAAGAAGGTCTTCGGATTGTAAAGCACTTTAAGTTGGGAGGAAGGGCATTAACCT AATACGTTA
Identified name: Pseudomonas sp. C5
Qualitative Description:
This wasn't part of our transect but from another lab section.
Quantitative Description:
Pseudomonas is a genus of Gram-negative aerobic gammaproteobacteria, belonging to the family Pseudomonadaceae containing 191 validly described species. The members of the genus demonstrate a great deal of metabolic diversity, and consequently are able to colonize a wide range of niches. The generic name Pseudomonas created for these organisms was defined in rather vague terms by Walter Migula in 1894 and 1900 as a genus of Gram-negative, rod-shaped and polar-flagella bacteria with some sporulating species Members of the genus display the following defining characteristics: Rod-shaped, Gram-negative, One or more polar flagella, providing motility, Aerobic, Non–spore forming, positive catalase test, and positive oxidase test. [2]
Conclusion
The transect contained many bacteria and it seems to be that the 2 sequenced here of the same genus. This would tell us that our transect is in fact filled with bacteria and of closely related species.
2/25/14
Lab 5: Invertebrates (Feb. 12, 2014)
Objective:
1) To understand the importance of invertebrates
2) To learn how simple systems (including specialized cells and overall body plan) evolved into more complex systems
Part I: Observing Acolelomates, Pseudocoelomates, and Coelomates
- Procedure:
1) At the stations were the Acolelomates, Pseudocoelomates, and Coelomates are, observe the organisms and record your observations.
- Results and Data Collection:
Observations:
Acolelomates: very fascinating -the body moves in a wave-like way and looks like a ribbon because they're bodies are so flat.
Pseudocoelomates: the cross-section looks very similar to that of the earthworm (annelid) but has a bigger "emtpy" section in the middle. Not sure if this is the coelom.
Coelomates: Earthworms -have a very different movement that looks like it needs to move its skin to move around. Its cross-section is similar to that of the Pseudocoelomate, but less hollow.
Other invertebrates studied: Arthropods
Insects: has 2 wings, 2 antennae, 6 legs and 3 body segments.
Centipede: No wings, 2 antennae, many legs, and 1 body segment.
Crustaceans: No wings, no antennae, 10 legs, 1 body segment/part.
Arachnids (spider): No wings, no antennae, 8 legs, 2 body segments.
Millipedes: No wings, 2 antennae, many legs, and many body segments.
Part II: Analyzing the Invertebrates Collected with the Berlese Funnel
- Procedure:
1) Take the ethanol/water tube from under the funnel and obtain 2 petri dishes.
2) Pour half of the tube in one petri dish and the rest in another petri dish
3) Look under a dissecting microscope and observe any invertebrates in the petri dish. Record your observations in a table.
- Results and Data Collection:
The transect observed didn't have any invertebrates of its own so species from West Virginia were viewed instead. The transect was located near a drainer and it was possible that most of the invertebrates were washed down after the rain (it was rainy when the soil sample was collected, so it was assumed that not much could survive on the mini-marsh). The size range of the organisms were between 0.5 and 7 mm. The largest being the housefly (7mm) and the smallest was the flea (0.5mm).
Part III: Vertebrates and Niches
- Objective:
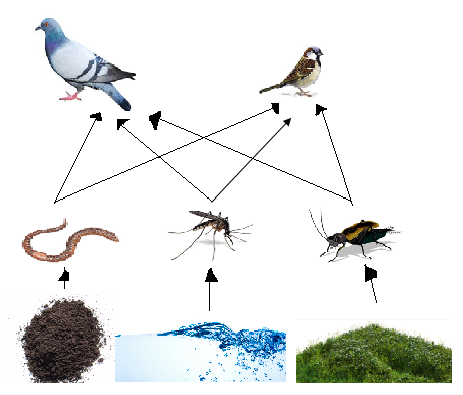
To identify at least 5 species that might live in the transect and construct a food web showing all species in its food chain.
- Results and Data Collection:
Possible species living in/near transect:
- Earthworms (Annelida - Oligochaeta - Haplotaxida - Megadrilacea - Lumbricina): These invertebrates feed off of the soil and other inorganic matter in the transect and since the mini-marsh is very much damp, they could live here.
- Pigeons (Chordata - Aves- Columbiformes - Columbidae - Ectopistes migratorius): Rock pigeons will feed off of the insects as well earthworms; there would be food for it in the transect although it may not actually live there.
- Crickets (Arthropoda - Insecta - Orthoptera - Gryllidae): Crickets would feed off of the vegetation in the transect, especially the leaves and other small plants. Also, the mini-marsh is damp and has many good hiding spots where crickets could live in.
- Mosquitoes (Arthropoda - Insecta - Diptera - Nematocera - Culicidae): Mosquitoes are known to live in swamp-like areas and lay their eggs in water. There is water accumulation in certain areas in the transect, so there also may be a chance that this is also a convenient place for mosquitoes to lay eggs and live.
- Sparrows (Chordata - Aves - Passeriformes - Passeridae - Passer - P. domesticus): Sparrows also live off of insects and earthworms as food, which are more likely to be abundant in the transect. It may not necessarily live there, but it is a good source for food.
Food web:
2/23/14
Lab 4: Plantae and Fungi (Feb. 5, 2014)
Objective:
1) To understand the characteristics and diversity of Plants
2) To appreciate the function and importance of fungi
Part I-IV: Collecting Five Plant Samples from the Transect and Observing Plant Vascularization, Specialization, and Reproduction
- Objective:
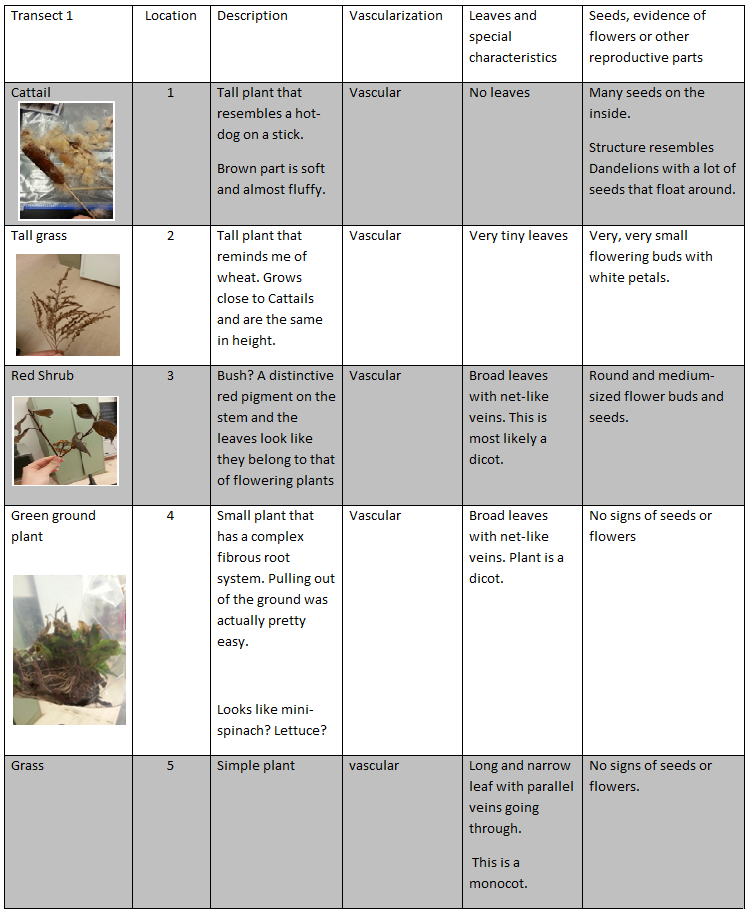
To collect 5 different plant samples and observe their characteristics. Observations will be recorded in a table. There will also be observations of other plants and data collected will be compared in the end.
- Procedure:
1) Head down to the transect with group.
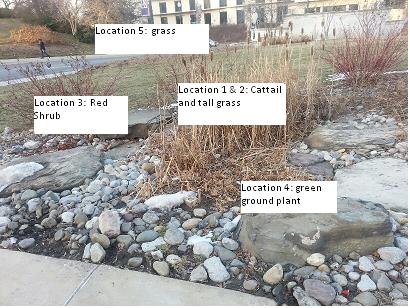
2) Obtain 5 samples of plants from different areas. Record these areas in a table
3) In a separate plastic bag, collect soil samples to use for the Brelese Funnel at the end of lab
4) Back in the lab, observe the plants at the stations and compare the features to the plants from transect. Record observations in table.
- Results and Data Collection:
Part V: Appreciating Fungi
- Objective:
Observe Fungi microscopically and understand how they function and why they are so important in life.
- Results and Data Collection:
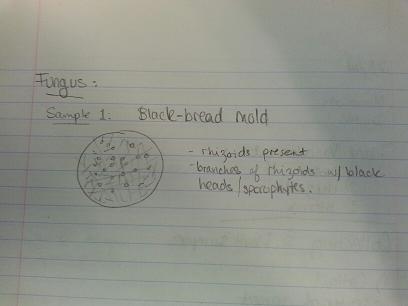
Fungi sporangia are little black spherical structures in fungus that usually grow between two hyphae. These are very important structures as they contain spores needed for reproduction, development, and survival.
Under the microscope, there were fibrous hyphae with sporangia at the end of the fiber. Rhizoids are also present with black heads.
Under a microscope:
Part VI: Setting up the Berlese Funnel to Collect Invertebrates
- Objective:
To set up next week's lab that focuses on observing invertebrates living in the transects.
- Procedure:
1) Pour 25 mL of the 50:50 ethanol/water solution into a bottle
2) Place a piece of screening so that it may block leaf litter and other big particles from falling into the tube/bottle.
3) Place the funnel into the neck of the square-sided bottle
4) Place leaf litter/soil sample in the funnel. Cover with Aluminum foil and place under a light fixture for about a week.
2/14/2014
Lab 3: Microbiology and Identifying Bacteria with DNA (Jan. 28, 2014)
Objective:
1) To understand the characteristics of bacteria
2) To observe antibiotic resistance
3) To understand how DNA sequences are used to identify species
Part I and II: Quantifying and Observing Microorganisms & Antibiotic Resistance
- Objective:
This part of the experiment starts off with the observation of the Hay Infusion Culture and how it may have evolved and/or changed. Any changes in the jar should be recorded. In addition to this, the seven agar plates that were placed in the incubator last week were to be observed for bacteria and fungi, as well as observing how the petri dishes with antibiotics were different than those without it.
- Procedure:
1) Obtain Hay Infusion Culture jar and record any changes observed in the past week.
2) Obtain the seven agar plates and observe them. Count how many colonies and record it in the table.
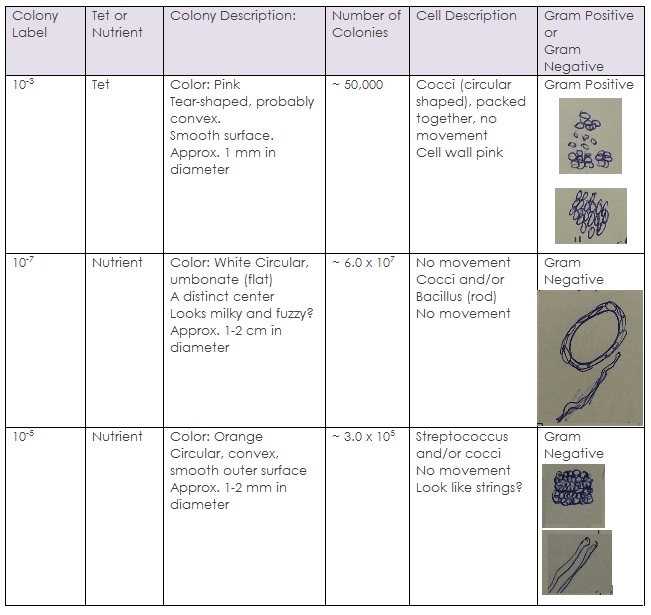
3) Choose three petri dishes to observe (2 plain nutrient agars and 1 with tetracycline antibiotic) and describe it in detail. Fill out the chart given. Use these three samples for testing gram positive and negative bacteria later on in the lab.
- Raw Data:
Hay Infusion Culture observation: There is less water, possibly because of evaporation, and the smell is less intense. The water seems darker yet there is still some evidence of life/vegetation. Algae are still present and the mixture seems to be more concentrated.
~~ In the petri dishes with tet-agar: very little bacteria but there are fungus. The fungus is fairly visible and is quite big. There are no transparent colonies of bacteria; bacteria did not grow well in these dishes.
~~ Normal Petri Dishes: A LOT of bacteria, but no fungus. Bacteria colonies are everywhere and are different in size and shape, as well as quantity.
- Conclusion:
In this experiment, it was observed that bacteria indeed do not grow well in antibiotics. Fungus, on the other hand, can grow. This is proof that it is not a good idea to treat fungal infections with antibiotics. Some samples had a very large growth of bacteria and many, many colonies, and these were mainly petri dishes that did not include the antibiotic. Others did not have much growth but there was a variety. In one tet-nutrient plate, there was one species of bacteria that seemed to have survived and reproduced, but the reproduction was minimal. Tetracycline antibiotic inhibits a lot of enzyme reactions essential for the vital processes of bacteria cells.[3] In the future, it would be interesting to observe the growth of bacteria in anti-fungal substance.
Part III and IV: Bacteria Cell Morphology Observations & PCR’’’
- Objective:
In this part of the experiment, there would be a close observation of the bacterium under a microscope, specifically the 3 samples chosen from Part I. A wet mount is created for each of the 3 species and its shape and motility is observed. Afterwards, gram staining the 3 species is preformed and the determination of whether it is gram positive or negative is made and recorded.
- ’’Procedure:’’
To prepare a wet mount:
1) Take a sterilized loop and “scoop” a tiny piece of the bacteria sample onto a microscopic slide.
2) Add a small drop of oil on the sample of bacteria and place the cover slip over it. Observe under microscope
3) After observing, place a small amount of dye to see the shape clearly. Record the observations in the chart.
Gram Staining:
1) Label 3 slides and repeat step 1 when preparing the wet mount.
2) Take the slide and pass it back and forth over the flame seven times with the bacteria sample on the top side.
3) Move towards the sink. Place the slide on a rack and drench the samples in crystal violet for 1 minute. Rinse afterwards
4) Drench the slide again with Gram’s iodine mordant for another minute. Rinse.
5) Rinse with 95% alcohol for 10-20 seconds.
6) Blot excess water carefully.
7) Observe under the microscope and determine if it is gram positive and negative.
PCR:
1) Obtain 2 small tubes with 100 microliters of distilled water and label them
2) Take another “scoop” with the sterilized loop and mix a small amount in the tube.
3) Heat in heating block for 10 minutes
4) Obtain 23 microliters of mastermix with forward/reverse primers to the PCR bead in the tiny tube, ,mix well and very carefully
5) Place 2 microliters of Bacteria DNA sample in the tiny PCR bead tube.
6) Place into PCR machine. Have ready for next week’s lab on electrophoresis gel
- ’’Raw Data:’’
- ’’Conclusion:’’
Based on the observations made, the pink colony of bacteria turned out to be gram-positive (turned purple), while the other two species were gram negative. This means that the pink bacteria had a thick layer of peptidoglycan and absorbed the stain well, while the other ones had a thinner peptidoglycan wall and an extra layer of a phospholipid plasma membrane which doesn’t absorb the dye and instead becomes pink. Another interesting observation made was that the gram positive bacteria grew in a petri dish that contained the antibioitic; there may be a correlation between antibiotic resistance and the “gram positiveness” of bacteria.
2/7/14
Lab 2: Identifying Algae and Protists (Jan. 20, 2014)
Overall Objectives
1) To understand how to use a dichotomous key
2) To understand the characteristics of Algae and Protists
Part I: How to Use a Dichotomous Key
- Objective
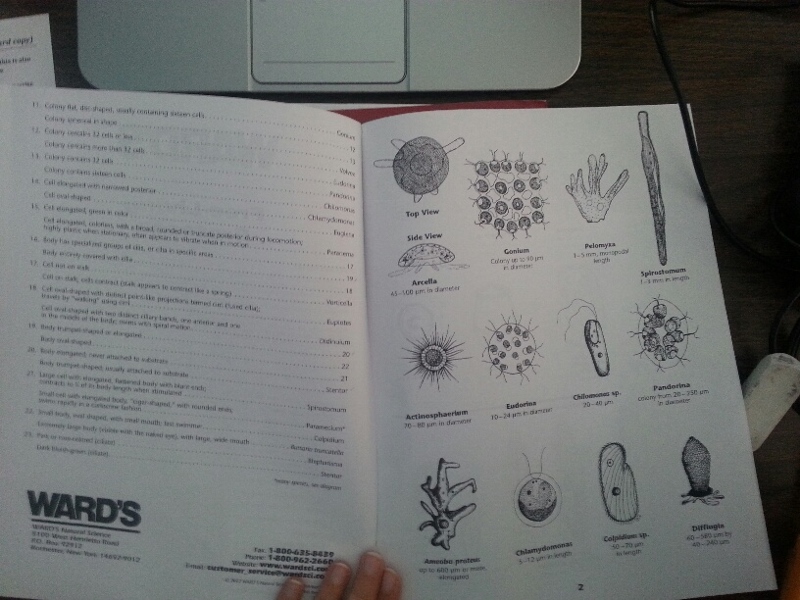
In this experiment, certain microscopic organisms were observed the microscope and identified using the dichotomous key, which is designed to be used to identify any group of organisms. The characteristics were to be listed and a picture of the organism was to be drawn as practice for when it came to identify unknown organisms from the Hay Infusion Culture.
- Procedure
1) Make a wet mount of the sample with the known organisms and observe under the microscope with 4X and 10X, if needed, then also 40X.
2) Look at the organisms and describe its motility, shape, size, color, etc. in your notebook.
3) Refer to the dichotomous key when the observations are made to determine and identify the species.
4) Repeat the same steps with another slide of known organism.
- Raw Data
~Species 1: Gonium
Characteristics: colored, colored green, colony of many cells
~Species 2: Spirostomum
Characteristics: white or colorless, exhibits other motion, cell has hair-like cilia, body entirely covered in cilia, body trumpet shaped or elongated, body elongated, never attached to substrate.
- Pictures
Part II: Hay Infusion Culture Observations
- Objective
There are many niches in the Hay Infusion Culture, with different species occupying the different niches. Samples will be taken from the surface of the Hay Infusion Culture as well as the bottom of the jar. These samples will be observed and identified using the dichotomous key and recorded in the lab notebook. At least 3 species shall be identified from the surface sample and another 3 from the bottom of the sample.
- Procedure
1) Obtain the jar of the Hay Infusion Culture without disrupting it. Observe how it appears and describe the smell and appearance.
2) Take a few samples of the Hay Infusion Culture from the surface and bottom of the jar, especially near any life forms such as plants. Note where exactly it was obtained from and use a dropper to select an area and place it on a slide.
3) Observe under the microscope. Draw a picture of the organism and begin to identify it via the dichotomous key.
4) Choose one organism and describe how it meet all the needs of life.
- Raw Data
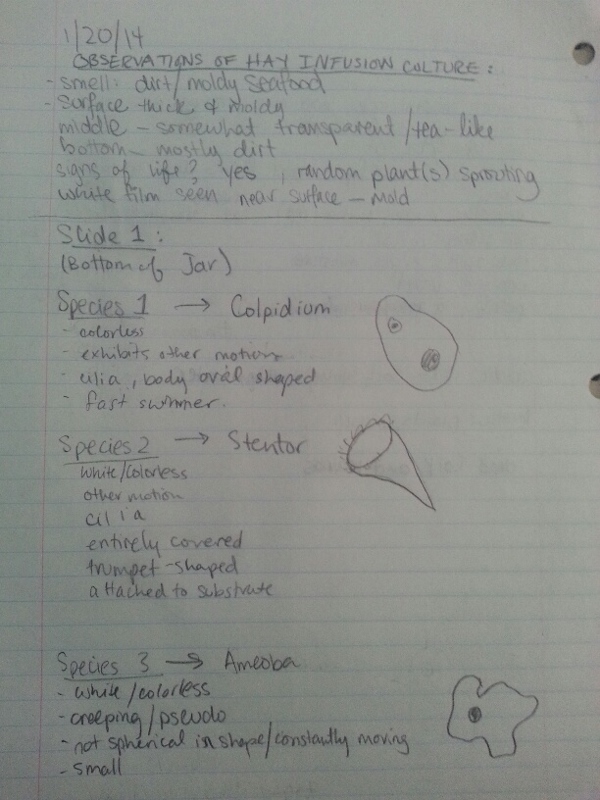
~~Observations of the Hay Infusion culture~~
The jar looked like it was separated into layers: the surface seemed thick and moldy with evidence of life (there were small green sprouts growing near the top). There was also a thick layer of white film which seemed to be mold. The middle part was transparent, almost looking like tea. The bottom part had most of the residue and soil; there was a strong feeling that a lot of bacteria could be living in the bottom part of the jar. Some of the selective pressures that may be present when determining the organisms would be that the surface had received most of the "sunlight" which enabled the small green sprouts to grow; the other layers were primarily dark and not much life was expected.
~~Species from the Surface~~
Species 1: Colorless, exhibits other motion, cilia covers body entirely, body oval shaped, small body, oval-shaped, with small mouth, fast swimmer
~Colpidium
Species 2: colored, green color, single cell, one observed locomotive flagella, cell elongated, colorless, with a broad, rounded or truncate posterior during locomotion; highly plastic when stationary, often appears to vibrate when in motion
~Peranema
Species 3: white/colorless, exhibits other motion, cell has hair-like structures (cilia), covered entirely with cilia, body oval shaped, small cell with elongated body, 'cigar shaped', with rounded ends.
~Paramecium
~~Species from the Bottom~~
Species 1: Colorless, exhibits other motion, cilia covers body entirely, body oval shaped, small body, oval-shaped, with small mouth, fast swimmer
~Colpidium
Species 2: white/colorless, exhibits other motion, body covered in cilia, trumpet shaped, attached to substrate
~Stentor
Species 3: white/colorless, creeping/sliding, not spherical in shape, shape constantly changes, small, creeps using pseudopodia
~Ameoba
- Pictures
Part III: Preparing and Plating Serial Dilutions
- Objective
To prepare serial dilutions for next week's lab. The bacteria in these dilutions will be placed in agar plates so that the bacteria can grow and form colonies for analysis and observation.
- Procedure
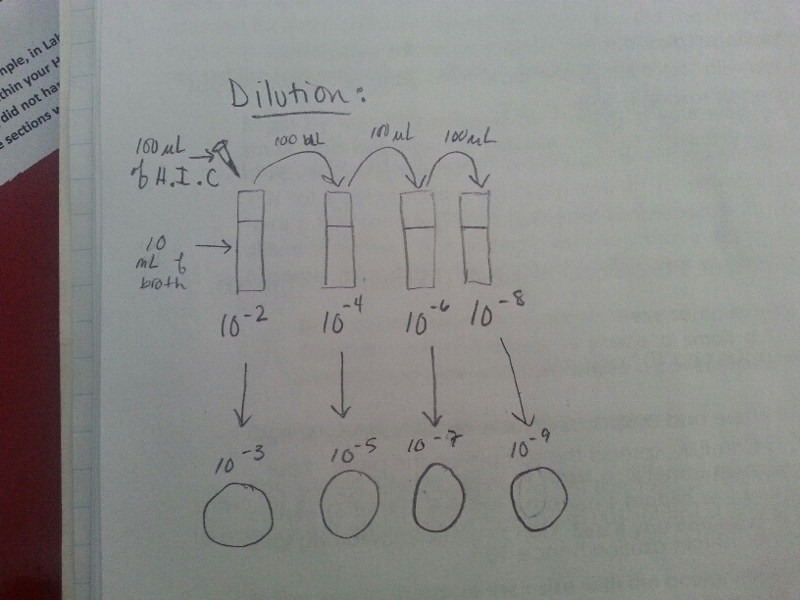
1) Take 4 tubes of 10 mLs of sterile broth and label them 2, 4, 6, 8.
2) Obtain 8 agar plates: 4 with only nutrient agar, and another 4 with tetracycline added. Label one plate from each of the two groups 10E-3, 10E-5, 10E-7, 10E-9
3) Swirl the jar, and take a 100 microliters sample from it to place it in the tube labelled '2'.
4) Swirl the first tube and take 100 microliters from the it, then place it in the next tube and repeat.
5) After this, take 100 microliters from the 10E-2 and place it in the 10E-3 labelled petri dish and spread out using a special tool for this. Do the same for the rest of the tubes and petri dishes.
6)Give the the petri dishes to the lab instructor so that it may incubated and ready for next week's lab.
- Raw Data
- Conclusions from Lab 2
It was very interesting observing the organisms under the microscope and trying to identify them. It was difficult to identify some of the organisms as the descriptions were not exactly what was observed. In the future, it might be easier to also look at the pictures and also final characteristics listed in the dichotomous key. If the Hay Infusion Culture were to be studied two months later, there may be an inflation of bacteria and other organisms. Some organisms were only seen in the surface due to the exposure to light. The organism Colpidium was seen everywhere; it was swimming from place to place and it almost looked like it obtained its food from the pieces of soil scattered around. After this exercise, it became easier to use the dichotomous key.
2/6/14, lab 1 notes
Great job, Vivian! Start working on building a map of your transect to detail your land and where your samples are taken from. We will talk about this more Wednesday.
AP
1/30/14
Lab 1: Biological Life at AU (Jan. 15, 2014)
Overall Objectives:
1) To understand Natural Selection
2) To understand the biotic and abiotic characteristics of a niche
Part I: The Volvocine Line
- Objective:
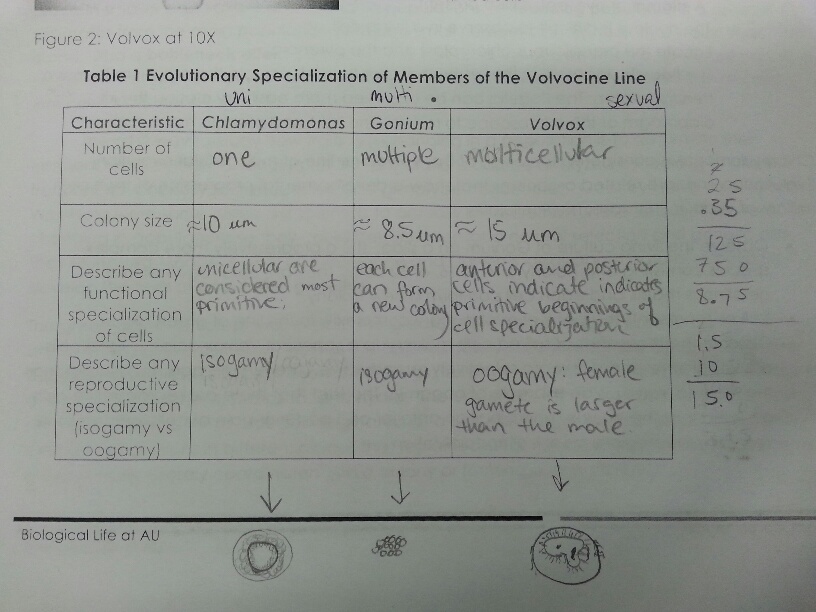
In this lab, different cells were observed to provide a clear meaning about what is natural selection and how it works. The question that was raised was how do we see natural selection occurring in a real-life example? Through observing 3 different yet related cellular organisms, it appeared that natural selection affected the development of the organism and its evolution.
- Procedure:
1) Prepare a slide with living Chlamydomonas and observe it microscopically. Draw the shape of the organism and determine whether or not it is multi- or uni-cellular. Measure the size of the organism.
2) Prepare another slide with the Gonium sample and observe it microscopically. Draw the shape and record the measurement.
3) Finally, obtain a sample of the Volvox cell. Observe under the microscope and draw what is seen.
- Raw Data:
- Conclusion:
Through observing the different cell organisms, it became more clear how natural selection takes its effect. Evolving from a unicellular organism to a multi-cellular one also changes many physical and chemical characteristics of the new modified organism.
Part II: Defining a Niche at AU (AU Transect)
- Objective:
In this section of the lab, we were to observe the biotic and abiotic features of an assigned area/transect of AU's campus with dimensions of 20 x 20 feet. Observations of how these features and how they fit together in their own niche was recorded and to be updated as we experimented with a specimen from that specific area.
- Procedure:
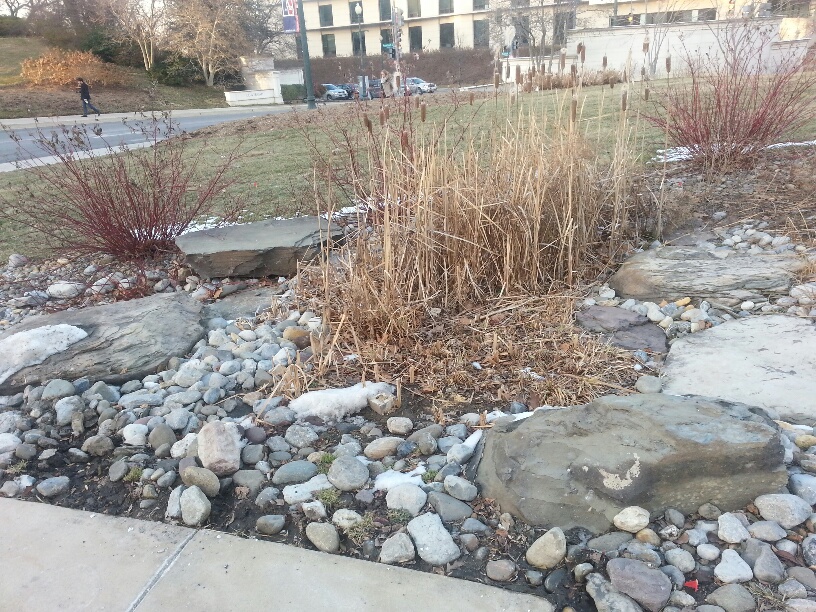
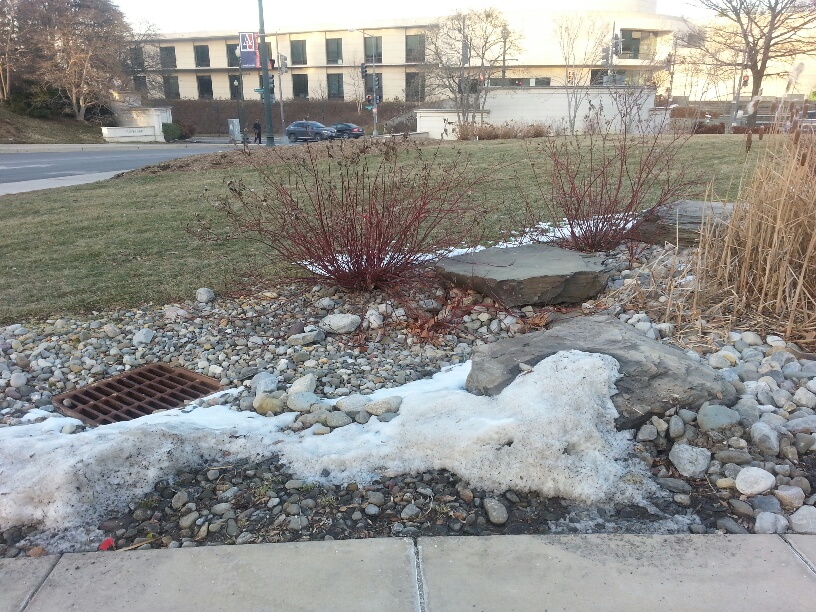
1) Gathered materials (lab notebook for notes, pencil, conical tube for collecting sample, and a scooper) and walked down to our assigned transect, which was transect #4 located on the side of Kogod near Massachusetts Ave (across from the Katzen Art Center).
2) Recorded the location, topography, and other general characteristics of the transect as well as a list of the biotic and abiotic features found in the place.
3) Took a sample of soil and vegetation in the tube to make a hay infusion culture.
4)In the lab, we weighed 11.454 grams of the soil/vegetation sample and placed in a jar with 500 mLs of Deerpark water. We then added 0.1 g of dried milk and mixed it for 10 seconds. After that we left it to be ready for the next lab session.
- Raw Data for Transect #4:
~Location: On the west side of Kogod near Massachusetts Ave, across from the Katzen Art Center.
~General features observed: The transect was near pavement and had a water drain nearby, which meant that a lot of water passed through our transect carrying possible life-forms. Plants and vegetation of different kinds are seen throughout. Rocks and boulders are also arranged sparingly.
~Biotic Features: Many plants, including cattails, reeds, red bushes, and mosses. Possibly algae and earthworms underground (the soil was moist).
~Abiotic Features: There are many rocks and boulders, some looked worn out from excess water, which is also another abiotic feature. There is a good amount of soil and gravel which appears to be damp and moist. I also characterize the presence of sunlight and air to be other abiotic components.
~There were also many dead leaves on the ground, and we couldn't determine whether or not they were considered biotic (because they were alive) or abiotic (because they were dead).
~Hay Infusion Culture: It was prepared and left to be observed the following week.
- Pictures:
- Conclusion:
After observing the transect, it was almost possible to predict what kind of organisms could be living in the soil and vegetation. With the presence of water, soil, and vegetation, one would assume that there will exist some form of life, particularly bacteria and protists. I was hoping that there'd be more signs of life, like maybe a place where squirrels might be living or pacing by, or simply birds pecking in the grounds. This might infer something else about the transect and the possible niches it contains. In the future, I will view these samples from our hay infusion culture under a microscope and detect any living substance(s).
