User:Sarah Connolly/Notebook/Biology 210 at AU
PCR Results Lab
Lab Objective: Identify bacteria samples based upon the plates we had grown.
Hypothesis/Prediction: The bacteria from our samples would match previously identified specimens that share characteristics to thrive in an environment similar to the pine tree sector.
Methods: We prepared these samples to run a polymerase chain reaction, and utilized an outside lab to identify the entire DNA sequence.
Results:
>S1-T4-A GTCGAGCGGTAGCNACAGAGAGCTTGCTCTCGGGTGACGAGCGGCGGACGGGTGAGTAATGTCTGGGAAACTGCCTGATGGAGGGGGATAACTACTGGAAACGGTAGCTAATACCGCATAATGTCGCAAGACCAAAGTGGGGGACCTTCGGGCCTCATGCCATCAGATGTGCCCAGATGGGATTAGCTAGTAGGTGGGGTAACGGCTCACCTAGGCGACGATCCCTAGCTGGTCTGAGAGGATGACCAGCCACACTGGAACTGAGACACGGTCCAGACTCCTACGGGAGGCAGCAGTGGGGAATATTGCACAATGGGCGCAAGCCTGATGCAGCCATGCCGCGTGTGTGAAGAAGGCCTTCGGGTTGTAAAGCACTTTCAGCGGGGAGGAAGGCG
>S1-T4-B CAAGTCGAACGGTGAAGCCCAGCTTGCTGGGTGGATCAGTGGCGAACGGGTGAGTAACACGTGAGCAATCTGCCCCTGACTCTGGGATAAGCGCTGGAAACSGCGTCTAATACCGGATACGAACCACCGTCGCATGGTGAGTGGTTGGAAAGATTTTTCGGTCTGGGATGAGCTCGCGGCCTATCAGCTTGTTGGTGAGGTAATGGCTCACCAAGGCGTCGACGGGTAGCCGGCCTGAGAGGGTGACCGGCCACACTGGGACTGAGACACGGCCCAGACTCCTACGGGAGGCAGCAGTGGGGAATATTGCACAATGGGCGGAAGCCTGATGCAGCAACGCCGCGTGAGGGACGACGGCCTTCGGGTTGTAAACCTCTTTTAGCAGGGAAGAAGCGAAAGTGACGGTACC
>S1-T4-C CGARCGGTATTGTTTCTTCGGAWATGANAGAGCNGGSGTACGGGKGMGGAACACGTGTGCAACCTGSCTTTATSKGGGGGATAGCCTTTNRAAAGGGAGATTAMTMCCCCWTAATATATTAAGTGGCATCACTTGATATTGAAAACTCCGGTGGATAGAGATGGGCACGCGCAAGATTAGATAGTTGGTGAGGTAACGGCTCACCAAGTMTACGATCTTTAGGGGGCCTGAGAGGGTGATCCCCCACACTGGTACTGANACACGGACCAGACTCSTACGGGAGGCAGCAGTGAGGAATATTGGACAATGGGTGAGAGCCTGATCCAGCCATCCCGCGTGAAGGACGACGGCCCTATGGGTTGTAAACTTCTTTTGTATAGGGATAAACCTACTMTCG
S1-T4-A did not match any known sequences according to comparison using the NIH BLAST database. This is possibly due to corruption of the sample during collection, preparation, or when the lab ran the entire sequence.
S1-T4-B had more successful results that matched it as 100% similar to chryseobacteria. This is a gram-negative bacterium that has been identified in raw milk, and may be linked to the powdered milk we placed into our hay infusion as nutrients for growth of all the other organisms present in the sample.
S1-T4-C also had a successful BLAST result of 96% similarity with another specimen in the database. However, this specimen has not yet been clearly identified as to its species or characteristics.
SC 4/26/14
Lab 6
Embryology and Zebrafish
Lab Objective: The objective of this lab is to observe the different patterns of development in frog, chicken and zebrafish embryos. The frog and chick specimens serve as models to compare against the zebrafish that we will utilizing in the experiment. We will grow two sets of zebrafish, with 21 individuals acting as a control with a normal light/dark exposure, while another plate of 21 embryos will develop in the darkness of a drawer. This lab seeks to identify what, if any, development differences occur within our two test groups of zebrafish.
Hypothesis/Prediction: Previous papers have noted the influence of darkness on retinal development. Unlike other embryos, zebrafish have been observed to recover their development delays of the retina with an extended exposure to light. Because of this, we predict that the zebrafish that grows in the dark will have visual impairment, as can be observed through its movement in the plate. The control plate is expected to develop normally with a typical light/dark pattern.
Methods & Procedures: The first step in this lab was to undertake a round of observations underneath the microscope of prepares samples. We also examined models of frog embryos developing at several different stages of their life cycle, steps that would later be mirrored in some form by our zebrafish. We identified a chick embryo under a dissecting scope as well, though it was difficult to identify the unique features of its yolk.
The second major portion of this lab was growing and observing the zebrafish themselves. First, we prepared two cover petri dishes with 20 milliliters of Deerpark water. From the class pool of embryos, we selected about 20 healthy and fungi-free embryos. We ended up with 21 embryos in each dish due to running out of time. Over the next two weeks, we observed them at intervals of 1, 4, 7, and 14 days. Our group missed day 11 due to extreme winter weather. On these days we removed dead embryos and hatchlings, added water as necessary, and fixed a few to be examined and measured in full once our time frame was complete. Surviving hatchling were then removed to an aquarium for safe keeping.
Data:
2/20/14 - 2:25 PM Our first day of observation was the day during which we set up the petri dishes, at about 2:25 PM. At this point, each dish held 21 healthy embryos. In the control dish, all embryos were between 11 and 16 hours old, and in between the 3 somite and 14 somite stages. The dark dish embryos had less variation, with all embryos between 12 and 16 hours old, in the 6 - somite and 14 - somite stages. At this point, there is no difference between the two test groups.
2/24/14 - 10:25 AM Day 4 of the experiment was the second day of observation. At this point, the control dish had 17 hatchlings and 4 embryos. All present appeared to be alive. There was some appearance of paramecium in the water. The dark dish had identical results, with 17 hatchlings and 4 embryos present. These embryos appeared slightly darker in color to the control group.
2/27/14 - 12:00 PM Day 7, or one week into the experiment, there was more variation in between the two groups and their characteristics. The control dish held 21 live hatchlings and several clear large paramecium. The dark dish held 20 live hatchlings and one dead embryo, which we then removed. The control group was more clear in color and tended to gather in the center of the dish. The dark dish featured zebrafish with larger, darker eyes, as well as an overall darker coloring. This can be clearly seen in pictures we took (to be uploaded).
We fixed one sample from each plate on this date. The control plate sample had a body size of 2250 mm and a tail about half the length of its body. The eye was 250 mm, and the spine of the zebrafish appeared straight. The dark plate sample had a body size of 2000 mm and a tail that was shorter in proportion to its body when compared with the control sample. The eye on the dark sample was 375 mm larger. The eyes were much darker and larger in comparison to the control. The dark sample also had a straight spine, and no fin was present.
3/6/14 - 12:00 PM Day 14, or two weeks into the experiment, we had our final observation. This date was late due to complications related to the snow day. The control dish was devoid of live specimens. Upon discussion with other groups in our lab class and others, there was a day earlier in the week when the lab was extremely warm and many of the plates out in the 'natural' environment died. We attempted to fix a dead specimen that had not been devoured by paramecium, but it was destroyed in the process. The dark plate still held 18 live hatchlings. 2 dead hatchlings were removed at this time. We attributed the death of the control zebrafish due to temperature fluctuation due to the fact that the same amount of water was present in both plates at the time of observation.
We fixed one specimen from the dark plate. This zebrafish was 2500 mm long. It had a longer tail that was much of its body. The tail length was 1750 mm. The eye was 300 mm. The eyes were again very dark and large in comparison to the head size. There was no fin and a straight spine.
Overall Observations On the control plate, the zebrafish tend to cluster at the center of the plate. The eyes appear to have developed regularly when compared to pictures of typical zebrafish. The plate exposed to darkness throughout their development had a darker overall physical appearance with extremely dark eyes. The dark plate zebrafish had a tail shorter in proportion to the total body length when compared to the light plate. Week one the dark zebrafish clustered on the outside edge of the plate, bumping into much more frequently than the control dish. The eyes are also larger in proportion to the total body length when compared to a control zebrafish at the same time frame.
Table 1, Zebrafish Survival
| Date | Dish | Number of Hatchlings | Number of Embryos | Number of Dead Hatchlings | Number of Dead Embryos | Total Present |
| 2/20 - Day 1 | Control - Light | 0 | 21 | 0 | 0 | 21 |
| 2/20 - Day 1 | Dark | 0 | 21 | 0 | 0 | 21 |
| 2/24 - Day 4 | Control - Light | 17 | 4 | 0 | 0 | 21 |
| 2/24 - Day 4 | Dark | 17 | 4 | 0 | 0 | 21 |
| 2/27 - Day 7 | Control - Light | 21 | 0 | 0 | 0 | 21 |
| 2/27 - Day 7 | Dark | 20 | 1 | 0 | 1 | 21 |
| 3/6 - Day 14 | Control - Light | 0 | 0 | 21 | 0 | 21 |
| 3/6 - Day 14 | Dark | 18 | 0 | 2 | 0 | 20 |
Table 2, Fixed Zebrafish Observations
| Date | Dish | Body Size | Tail | Eye | Other Observations |
| 2/27/14 | Control | 2250 mm | Half of body | 250 mm | Relatively straight spine |
| 2/27/14 | Dark | 2000 mm | Less than half | 375 mm | Eyes darker and larger than control, no fins, straight spine |
| 6-Mar | Dark | 2500 mm | Longer tail (1750 mm) | 300 mm | Eyes very dark, no fin, straight spine, larger head than proportionate |
Conclusions and Future Plans:
SC
Lab 5: February 13, 2014
Invertebrates
Lab Objective: The objective of this lab is to understand the importance of invertebrates in the ecosystem, and more specifically within our transect. To identify the invertebrates in our transect, we will also examine several prepared specimens to understand how more complex system evolved over time.
Hypothesis/Prediction: We expect to see a variety of invertebrates in our Berlese Funnel due to the moist leaf matter we collected being a well suited environment to their growth.
Methods & Procedure: We began with observations of various organisms from acoelomates, psuduocoleomates and coelomates to understand how complex structures evolved over time with small changes. We then prepared dishes with the invertebrates collected in the Berlese Funnel we set up last week. There were two dishes: one had the top half of the sample collected, and the second the bottom. Using the dissecting microscope we identified the two specimens we had using materials from the lab workbook.
Data:
Each dish only yield one invertebrate for study. Pictures will be uploaded at a later date. The first organism I saw was what we identified as a soil mite that was .5 millimeters long. The segments of its body were clear under the dissecting scope. The second organism seen was a black flea with a small pair of wings. It had a rounded body and was 3 millimeters long.
Conclusions and Future Plans: We were surprised to be unable to find a more diverse range of invertebrates in the sample we collected for the Berlese Funnel. This could be due to us not collecting a deep enough sample into the leaf litter because the ground was quite frozen, and therefore unable to access things like earthworms. The deep slope of the hill the pine trees are located on could have impacted which organisms decide to live there as well.
As we move forward with identifying the bacteria from our transect through PCR, it will be interesting to see how each lab has built a deeper understanding of the area that we have studied. There has been an array of different results, and I look forward to building our separate observations together into a shared understanding of the pine tree transect through the final lab report.
SC
Lab 4: February 6, 2014
Plants and Fungi
Lab Objective: The purpose of this lab is to understand the characteristics and diversity of plants and to understand the function and importance of fungi in the environment. This lab accomplishes this through the collection and observation of five plants samples from our transect (pine trees) and observing prepared slides and samples of various types of plants. There will be a variety of unique plants to examine.
Methods & Procedure: This lab began with a trek to our transect by the seminary and collecting five different leaves for examination. We also collected a larger bag of the top soil and leaf litter for usage in our invertebrate lab next week.
We walked through a series of lab stations step up to assist in identifying the differences in characteristics. We began with vascularization, observing the xylem and phloem and other structures in mosses, gymnosperms and angiosperms. The second station concentrated on more developed specialized organelles in the plants. Most visible was the stomata and cells on the surface of the leaves that allow them to process carbon dioxide into oxygen and energy. The third station included studying plant reproductive systems and then dissecting an orchid specimen and looking at it under a dissecting microscope. In the seeds we could observe differences between monocot and dicot varieties. The last station in this lab organized fungi for observation and comparison to our plant samples.
The final part of this lab utilized the leaf litter collected to set up a Berlese funnel. In the next week, this funnel should channel various invertebrates into the ethanol for observation in our next lab meeting.
Data:
A composite table of all data organized by characteristic is listed below a written breakdown of our samples.
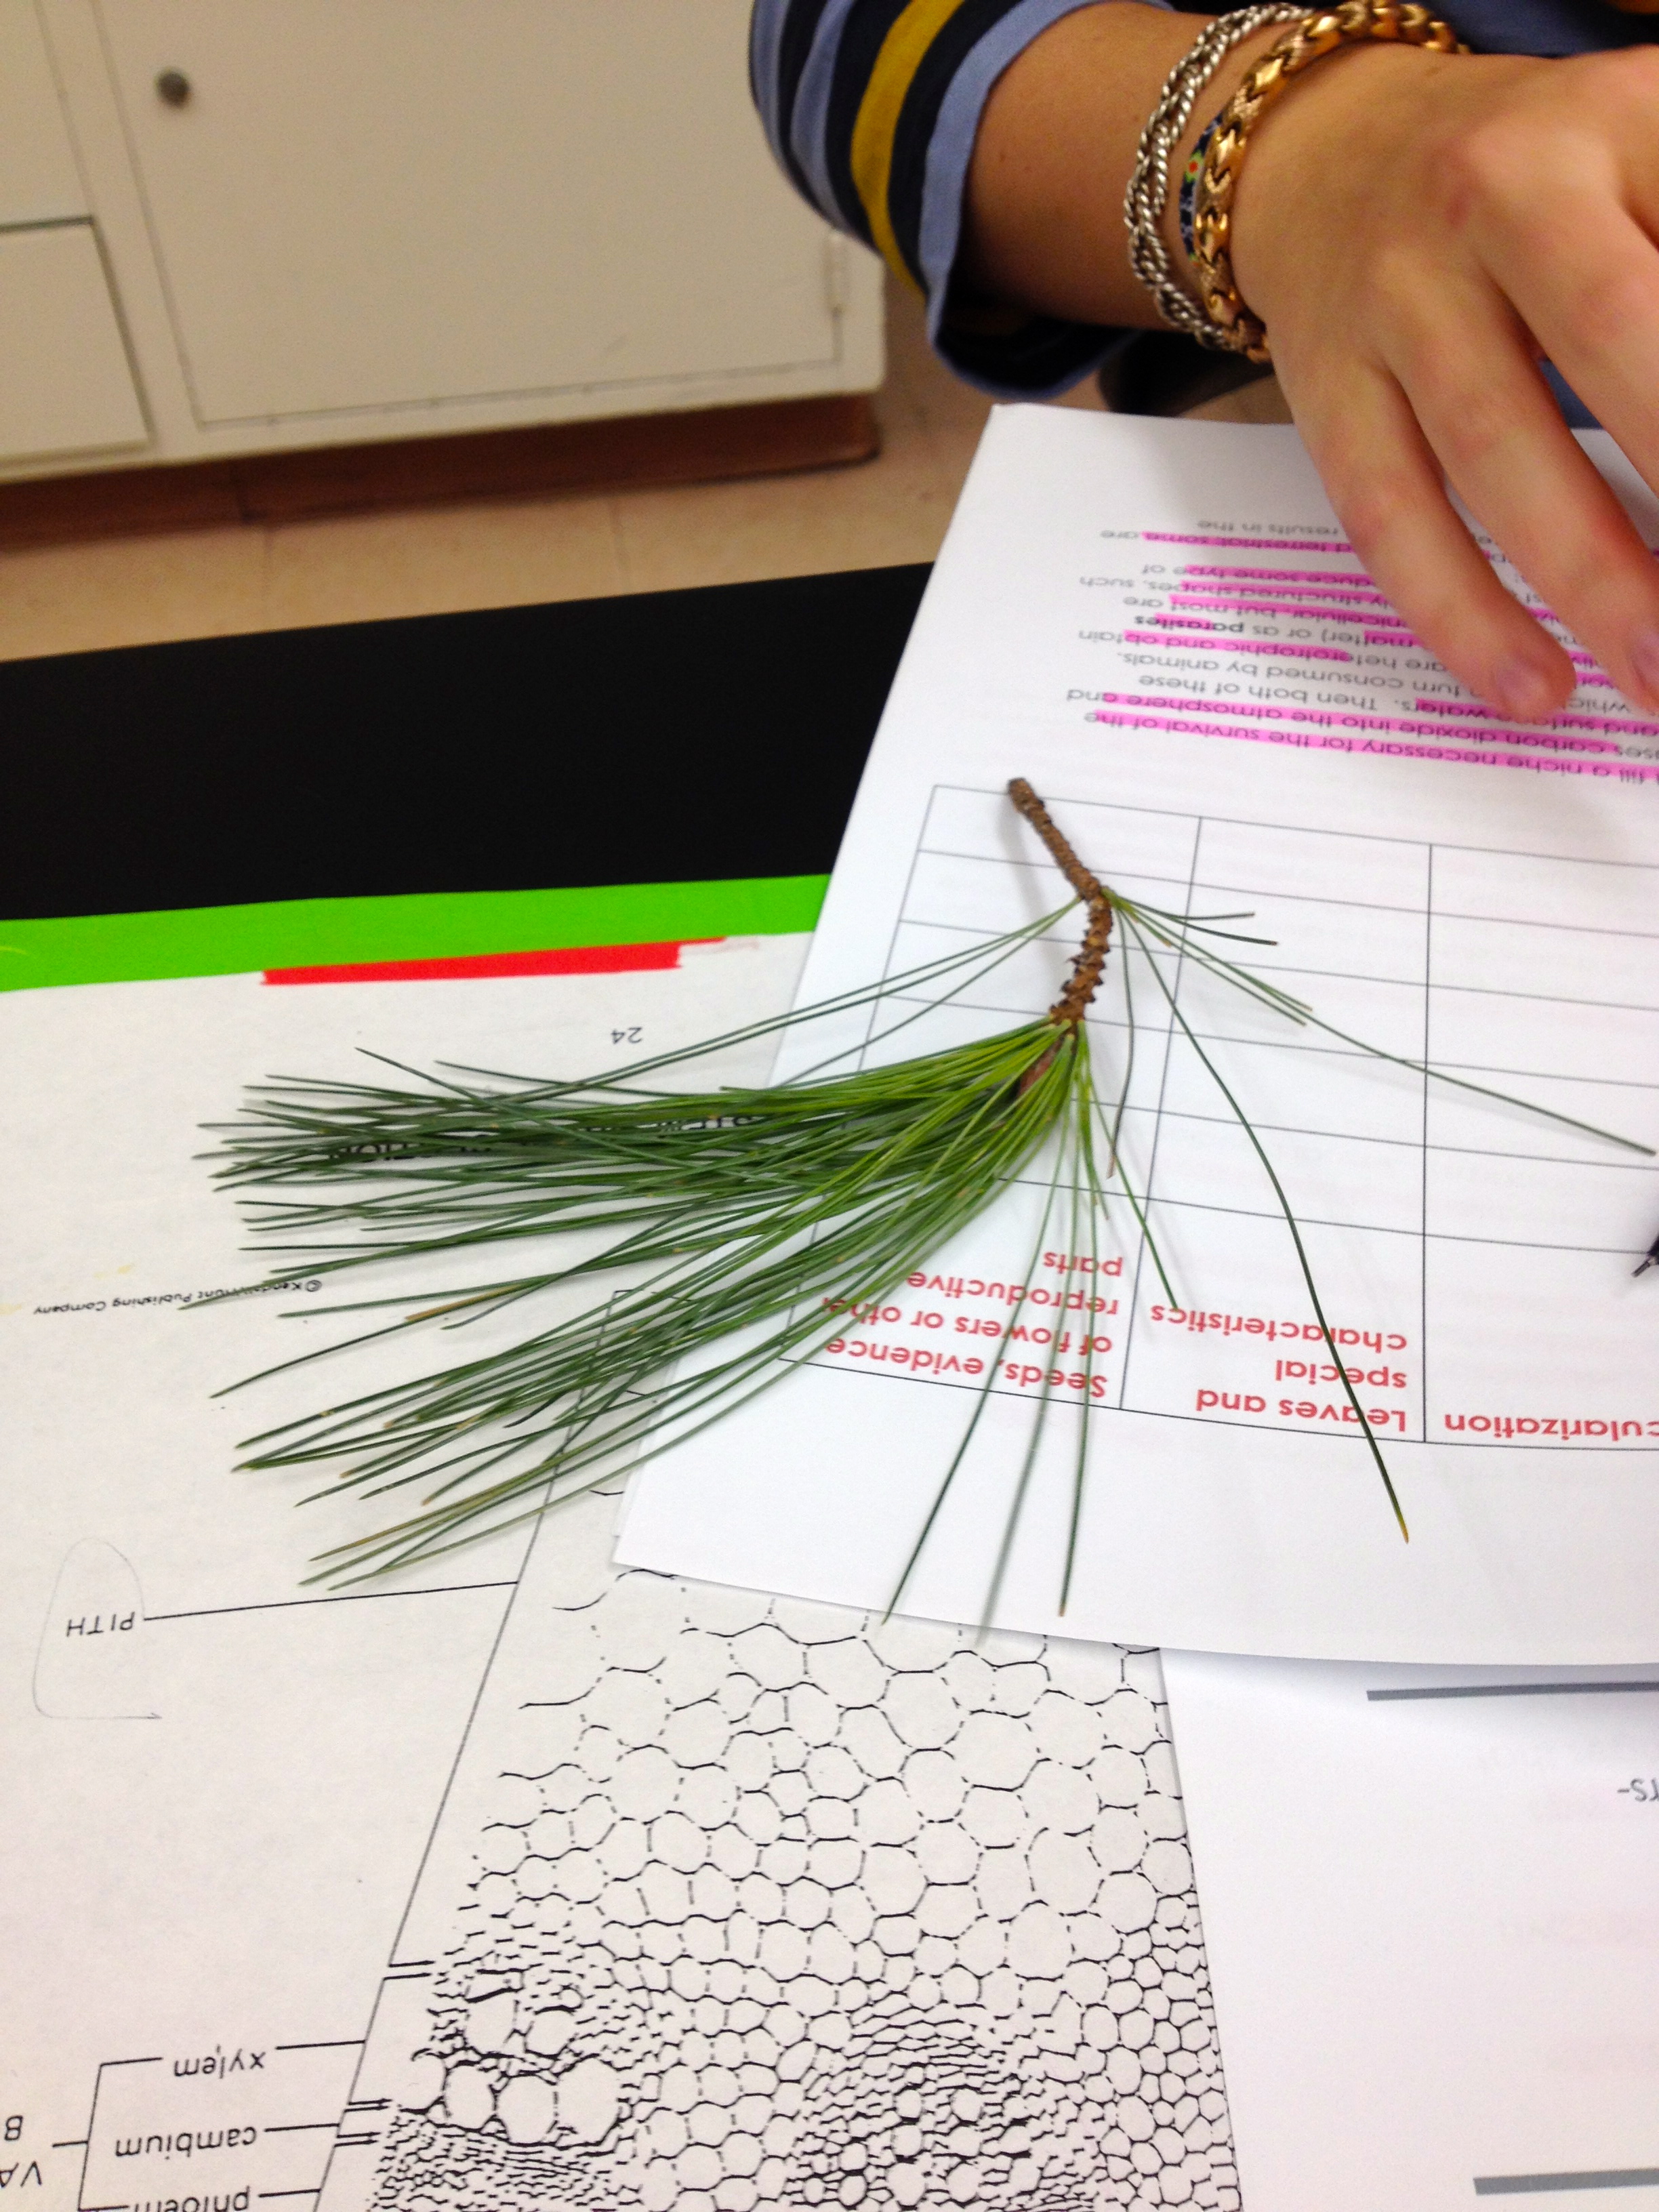
The first sample collected in our transect were long, thin pine needles that had fallen off the pine tree. They were collected off a large branch. Under the microscope it was possible to identify the xylem, but the phloem was a little hidden. There were seeds visible on the top and bottom of the needle. This sample came from a gymnosperm, identifiable from the pine cones on the branches.
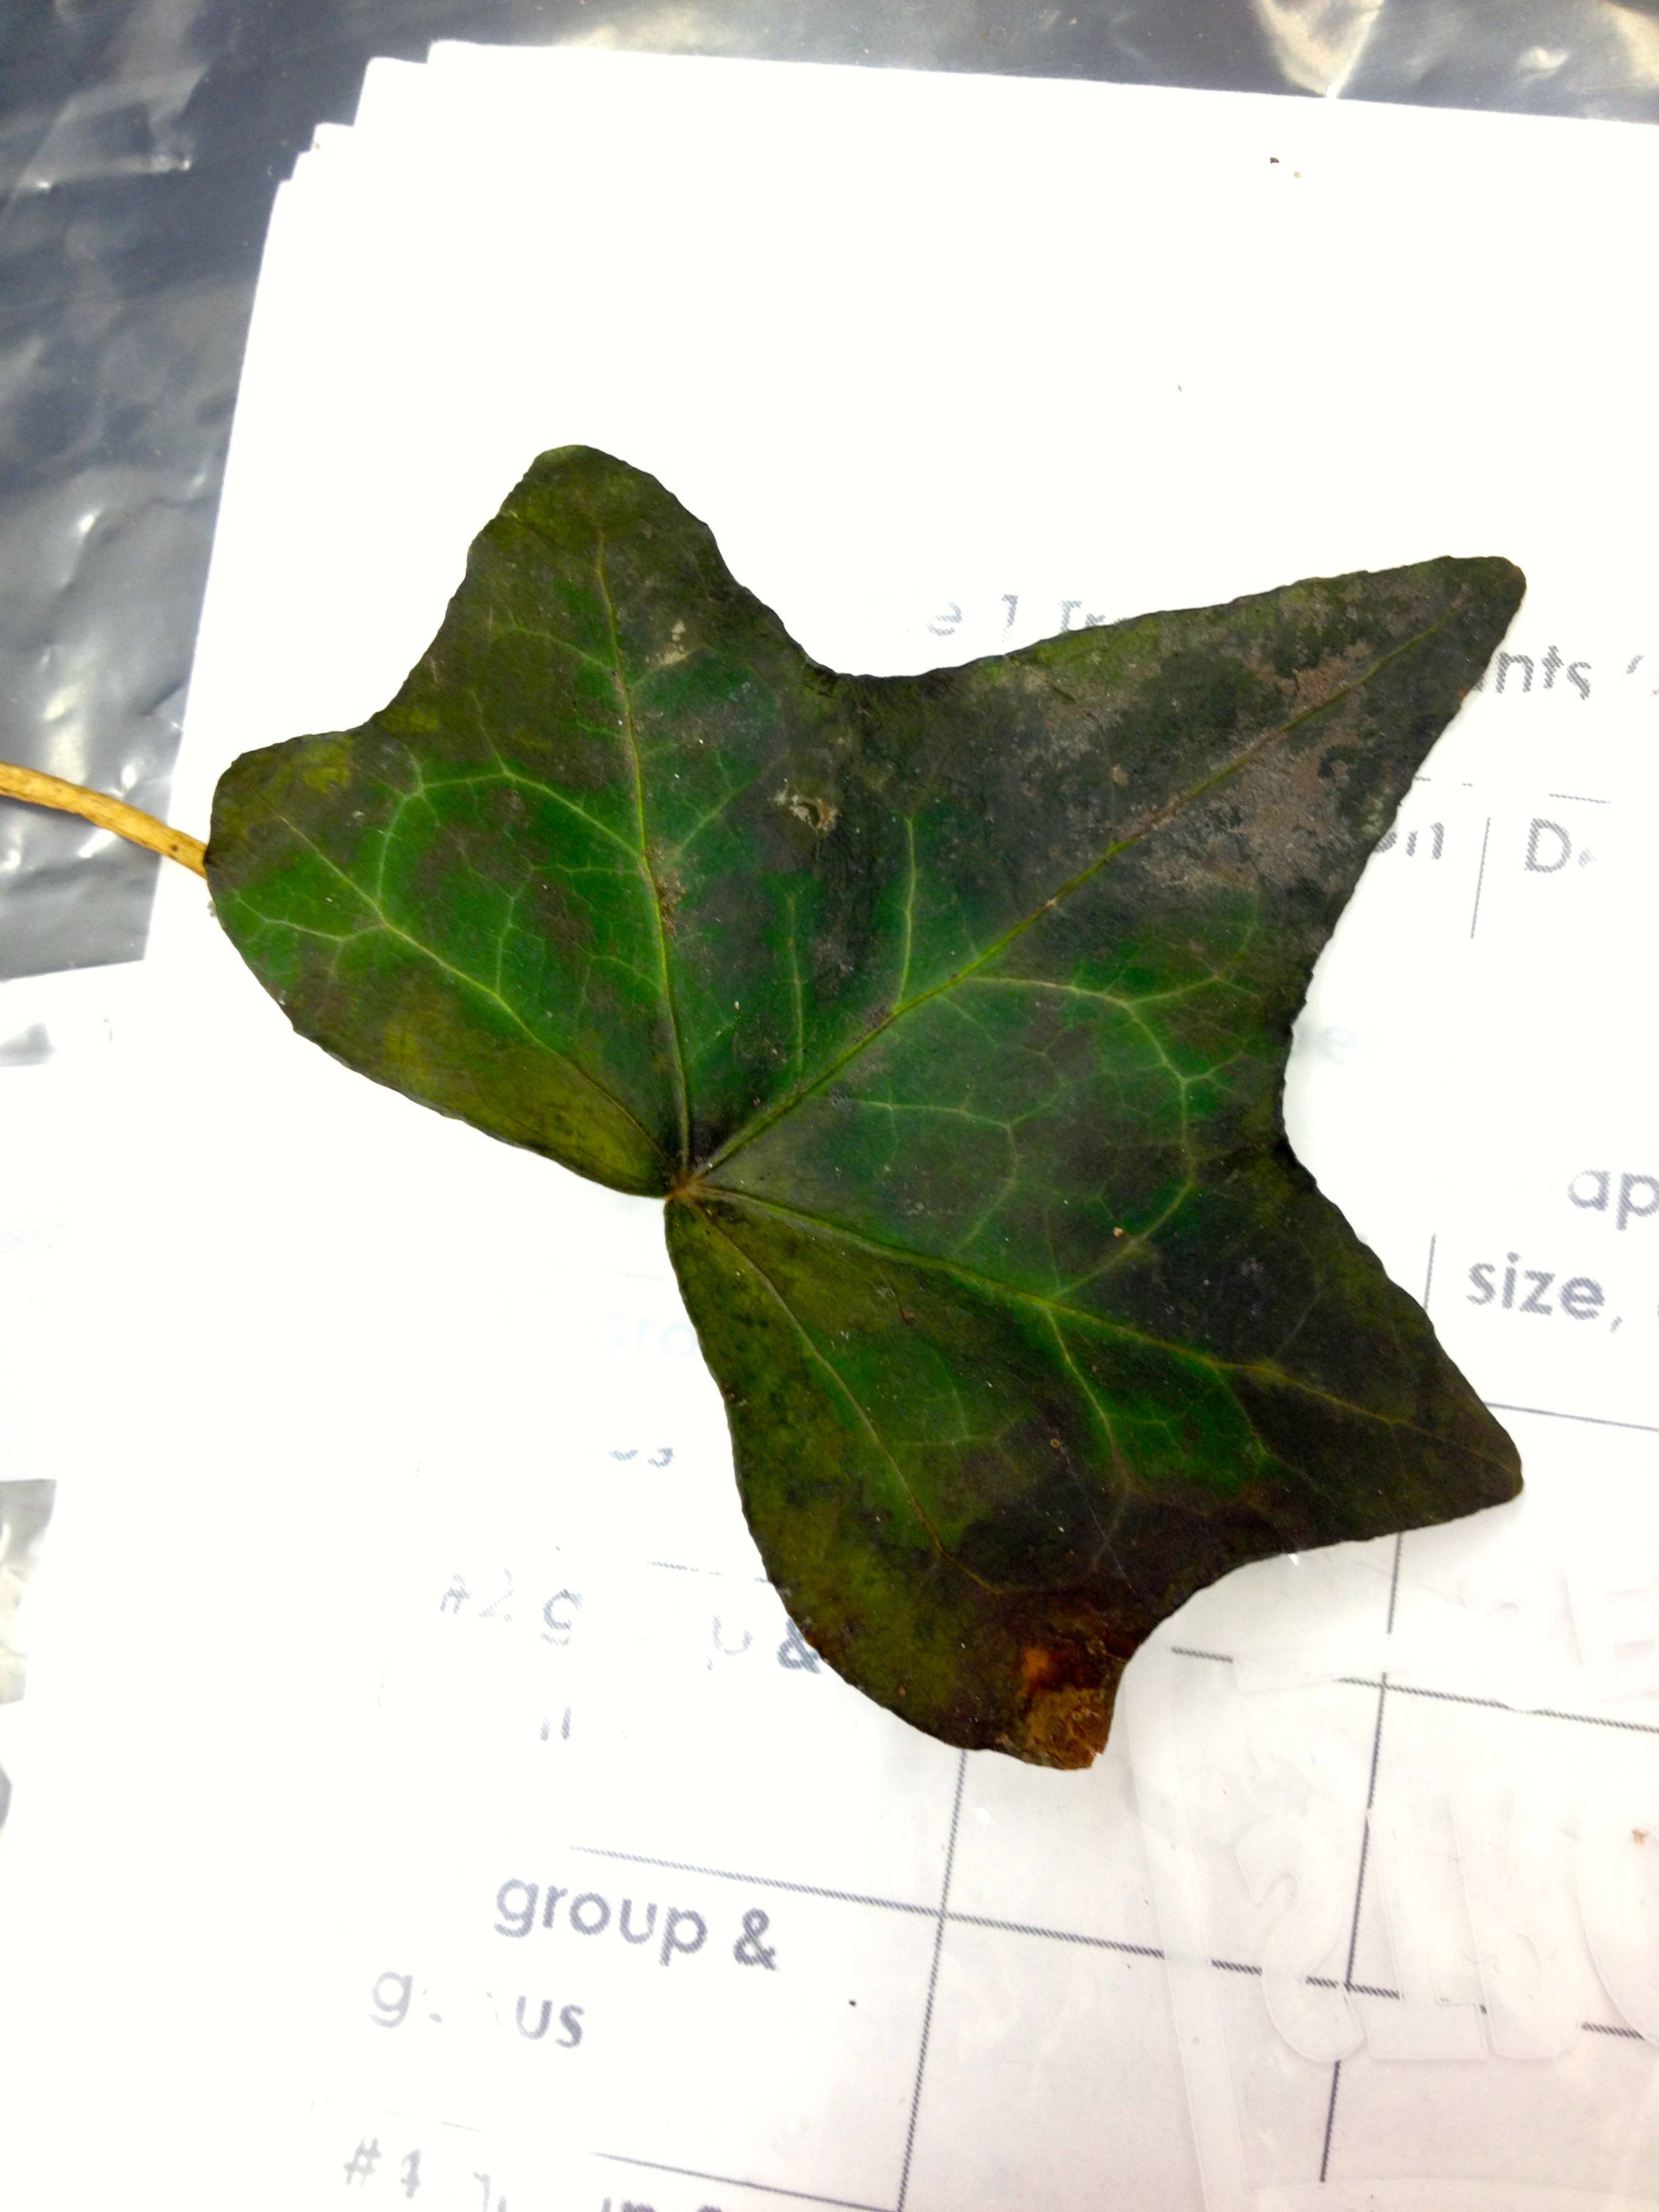
The second sample was on the floor of the transect. It was collected from an ivy on the ground. It was a dicot plant, with xylem and phloem visible on the microscope. It was more circular than the other leaves collected. Veins were clearly visible on the leaf. It appeared to be bilaterally symmetrical.
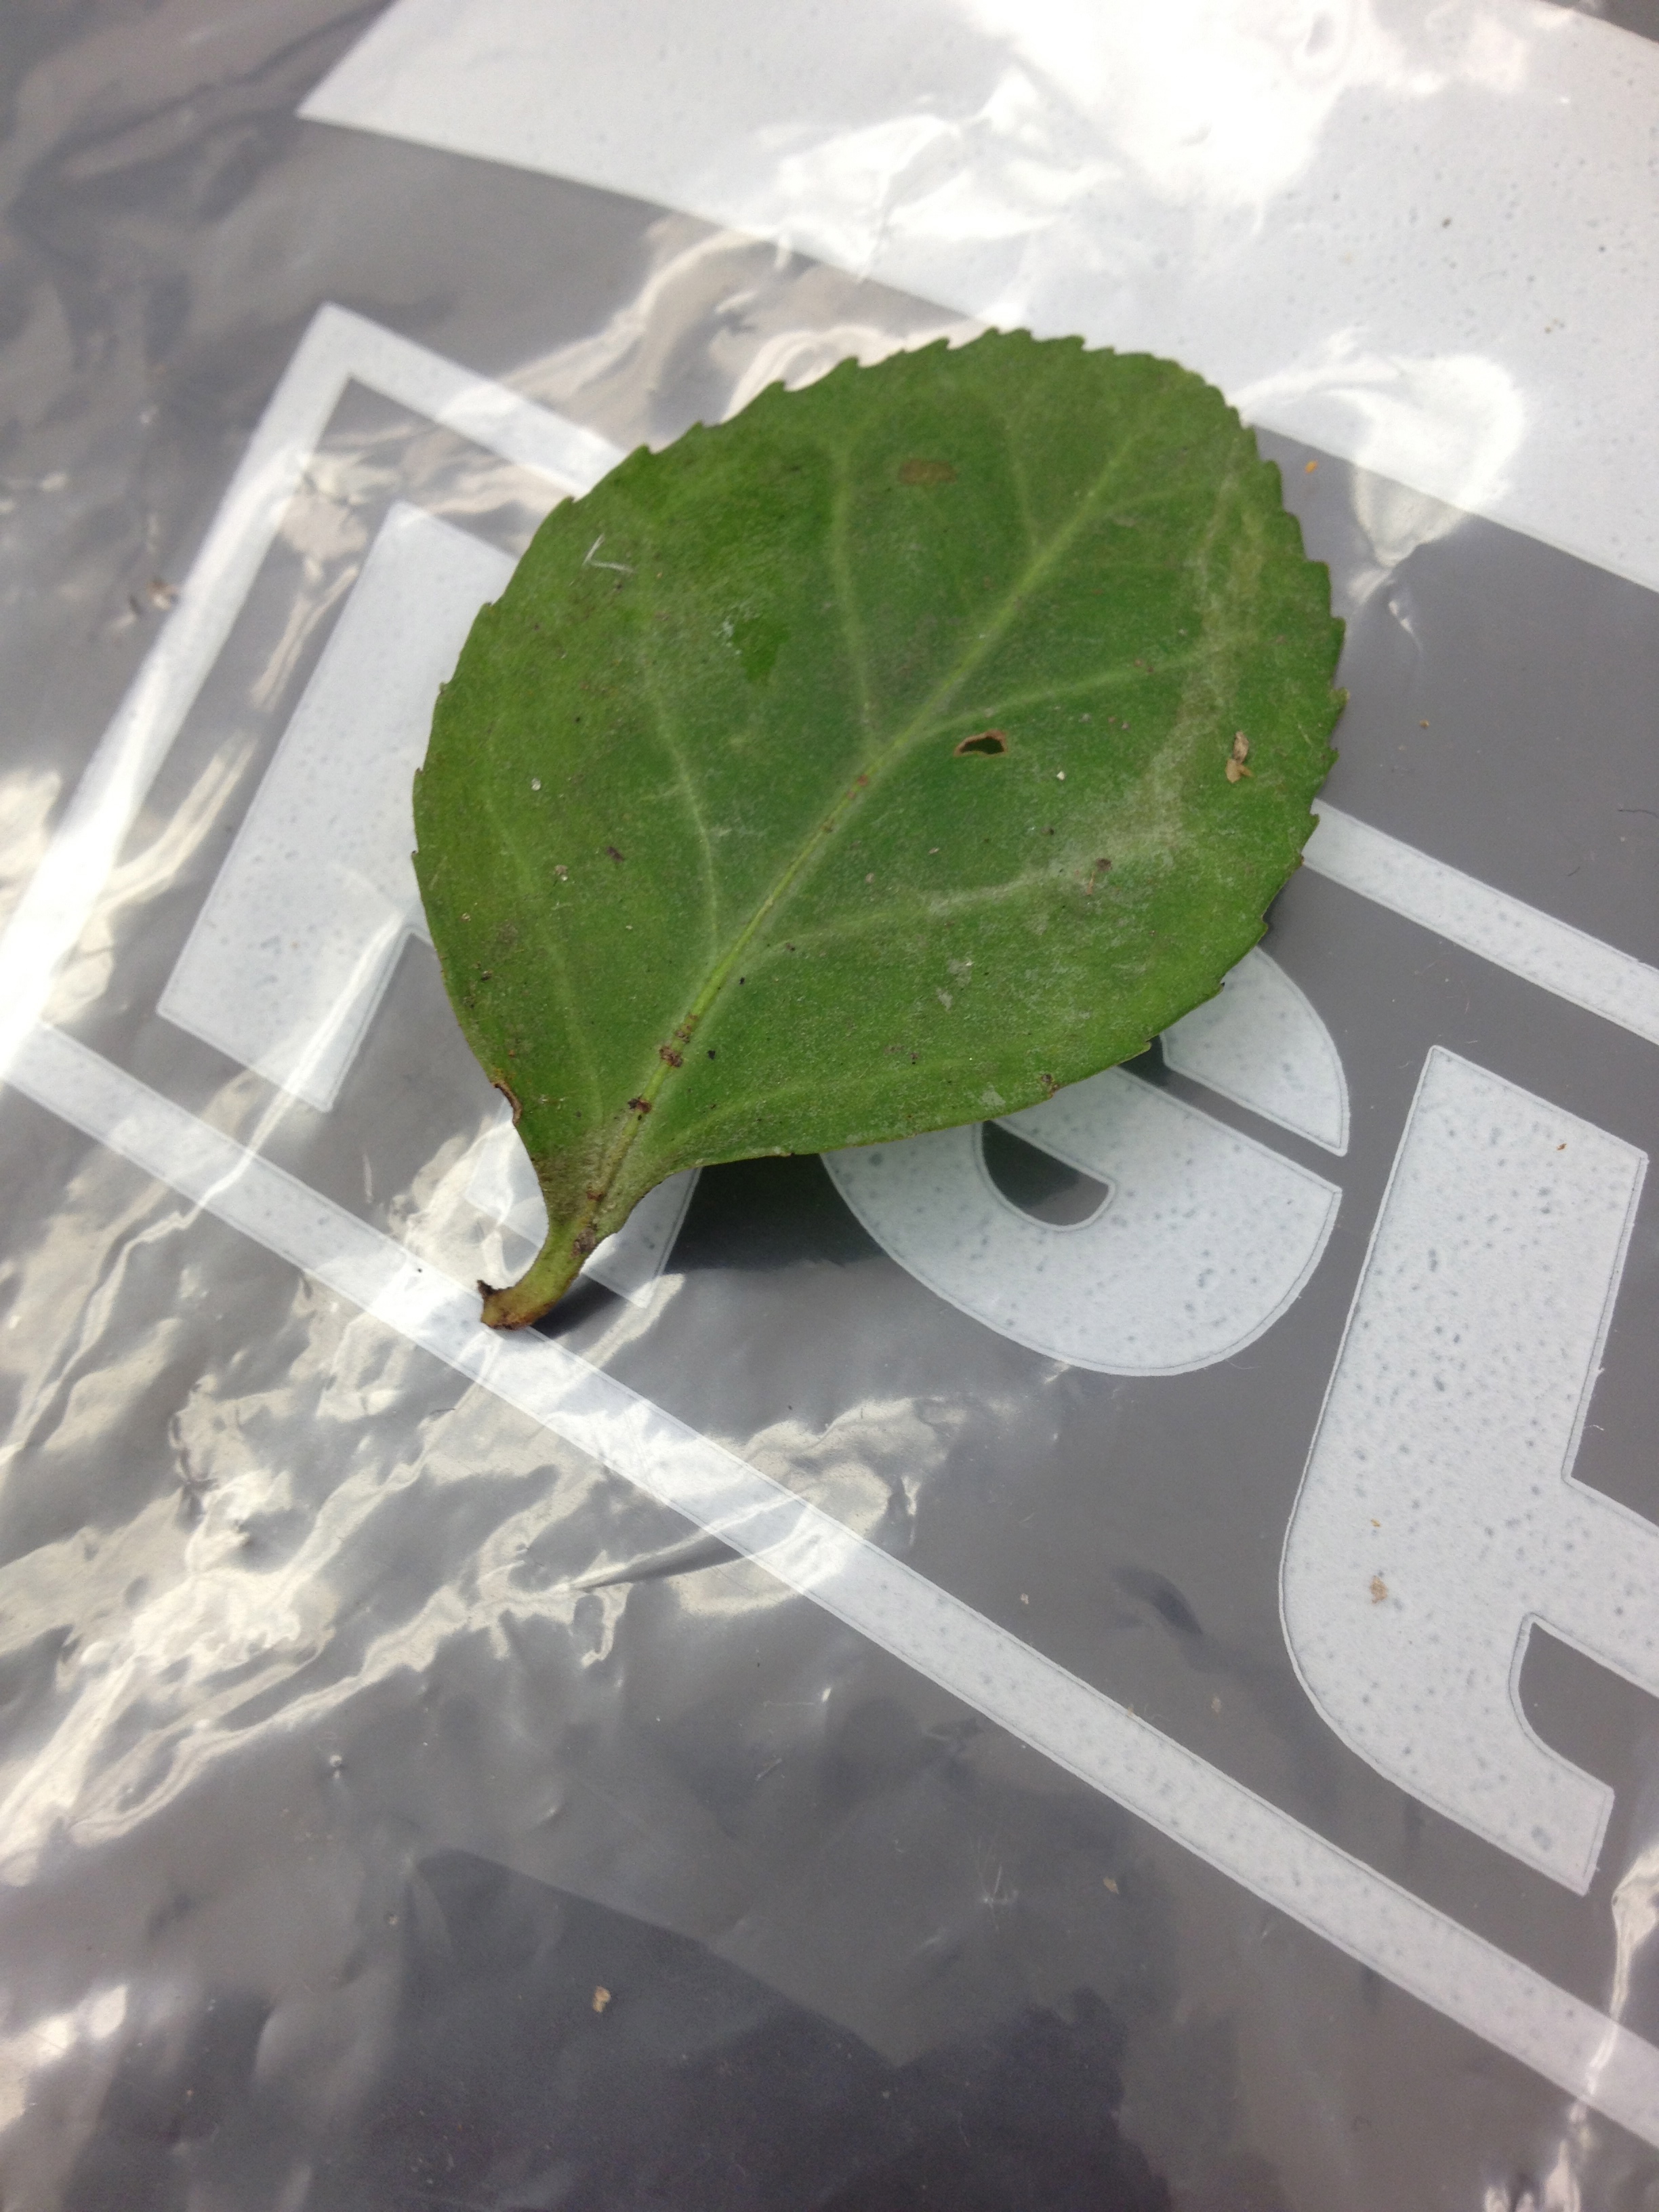
The third sample was a triangular leaf also from the floor of the transect. The veins were easily visible, but the leaf color itself had more hints of purple within the dark green. It was a dicot angiosperm.
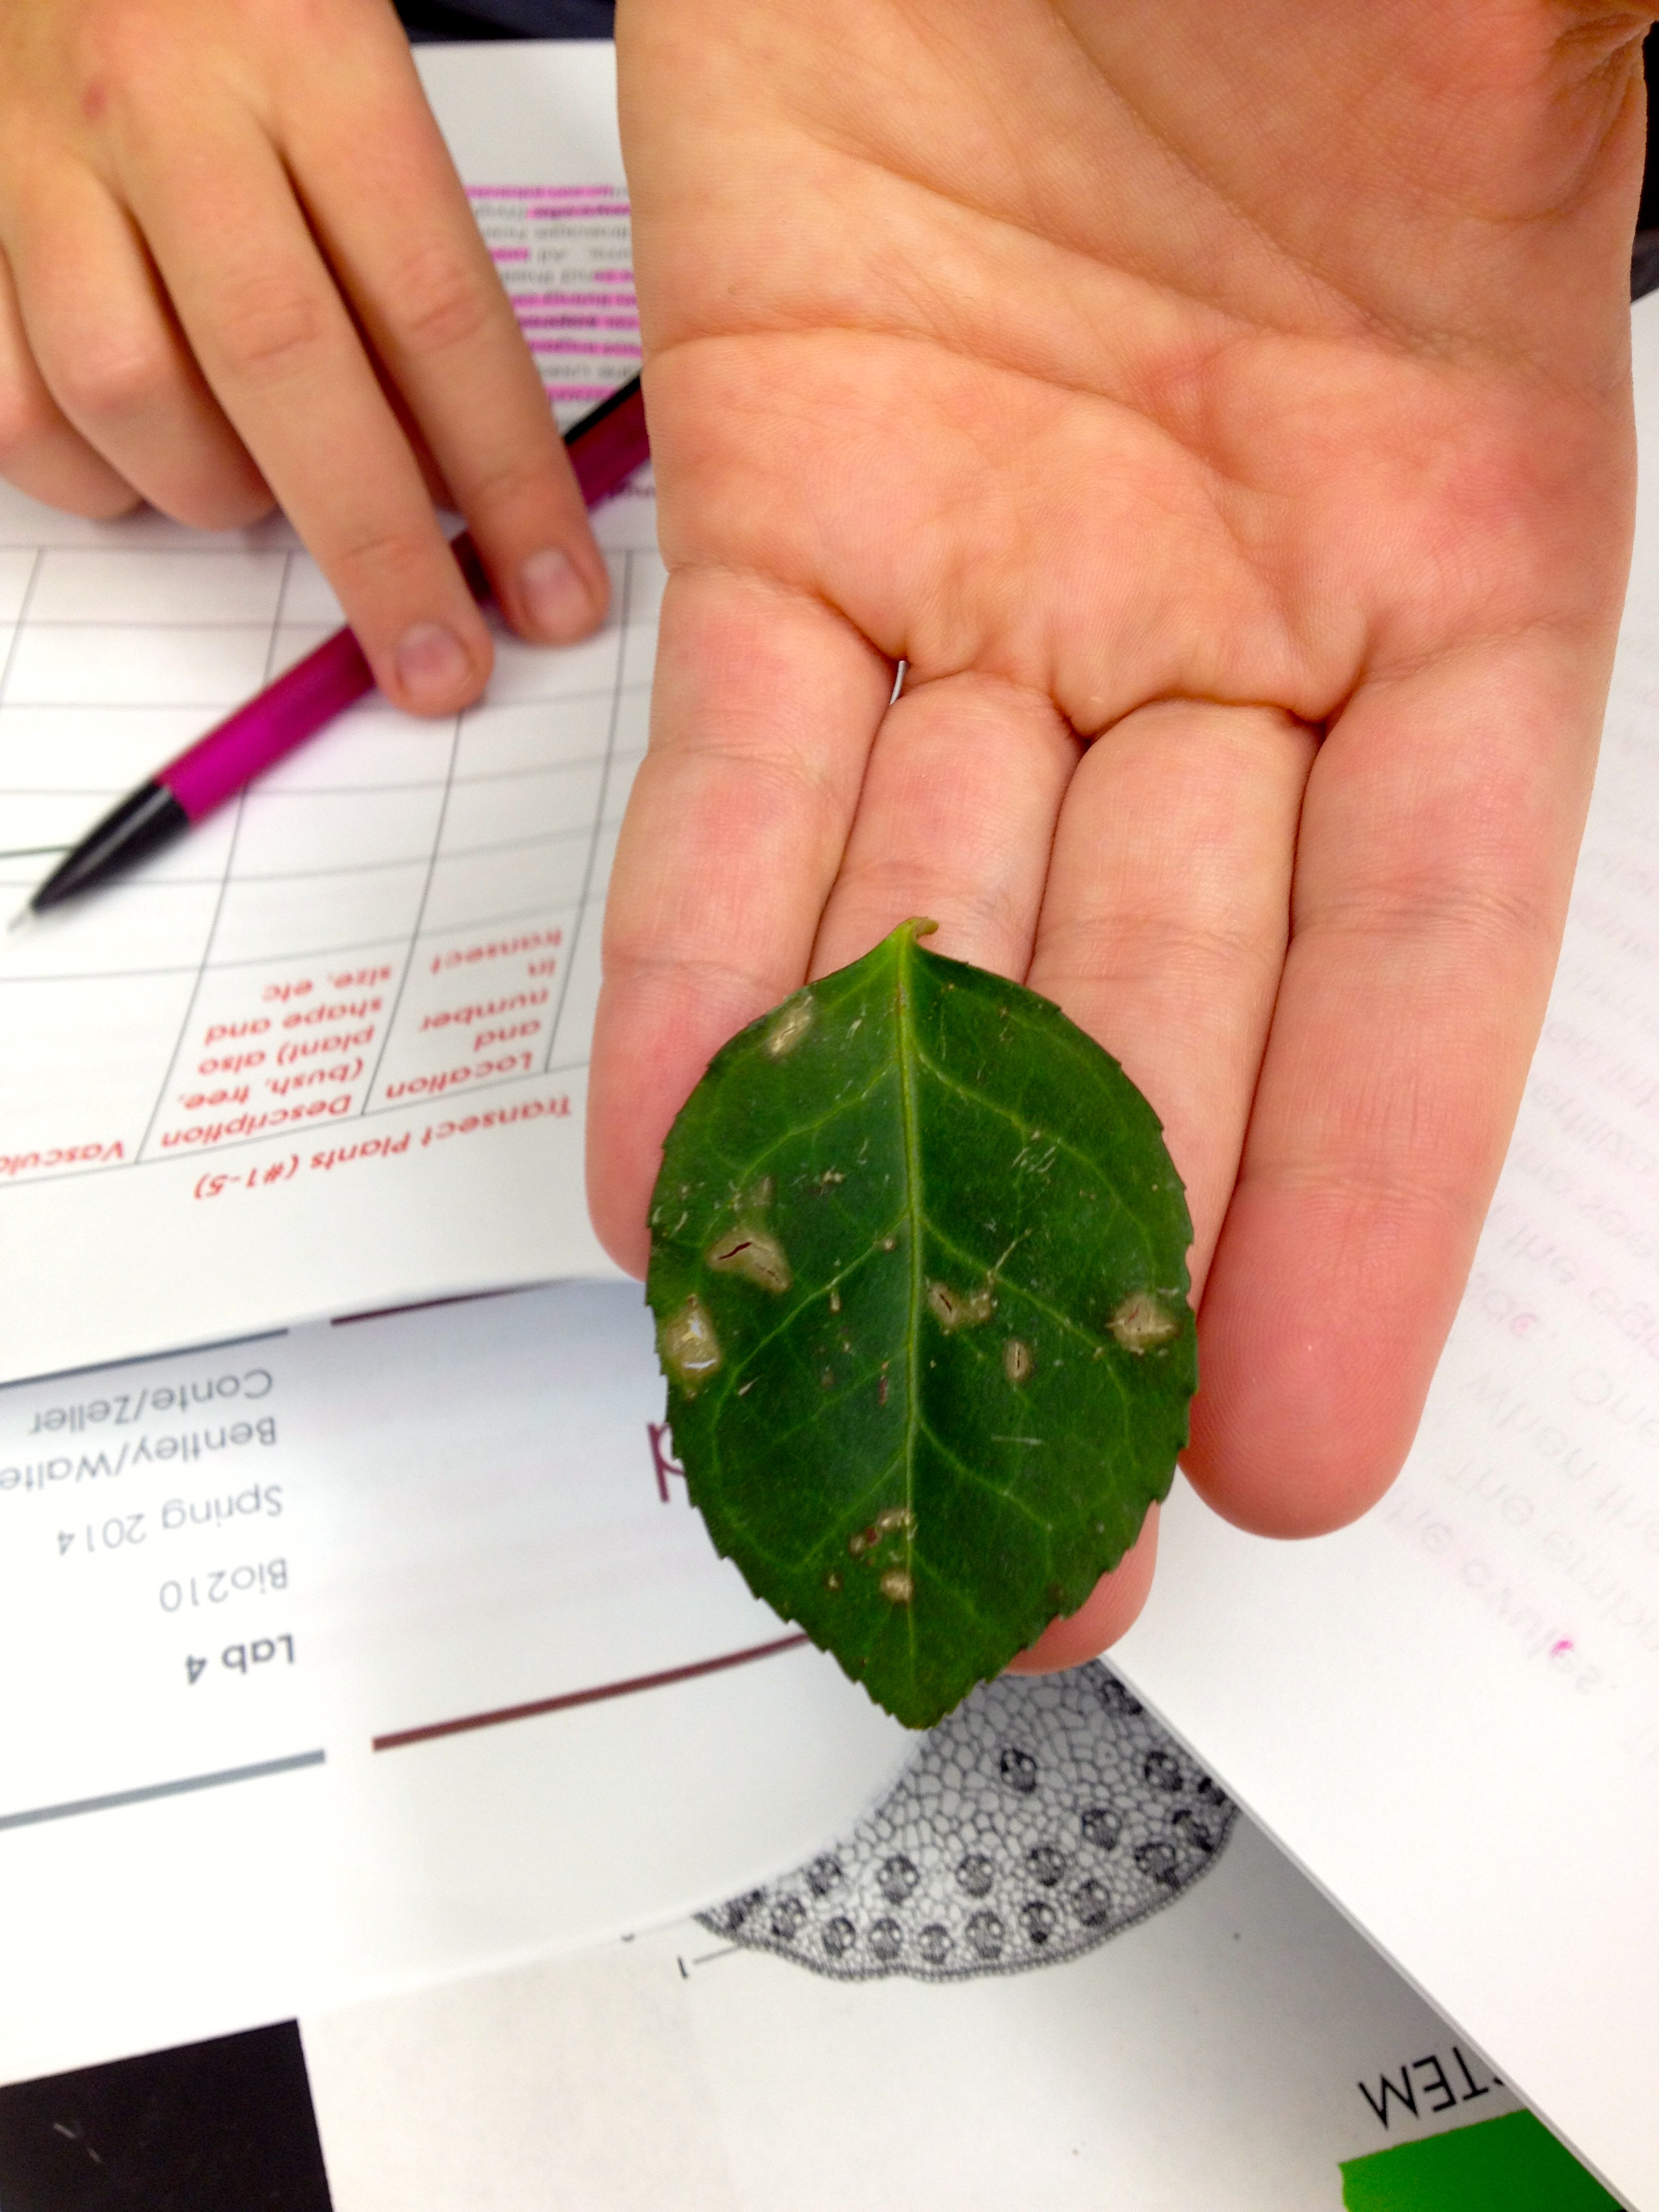
The fourth sample was a rounded green lead from the ivy on the floor of the transect. It appeared to come from one of the plants that formed the undergrowth in the transect. It was similar in its characteristics to the second sample, but shared traits that marked it as from a flowering bush or tree. This sample was a dicot. Under the microscope it was easy to follow the veins and they were clearly defined.
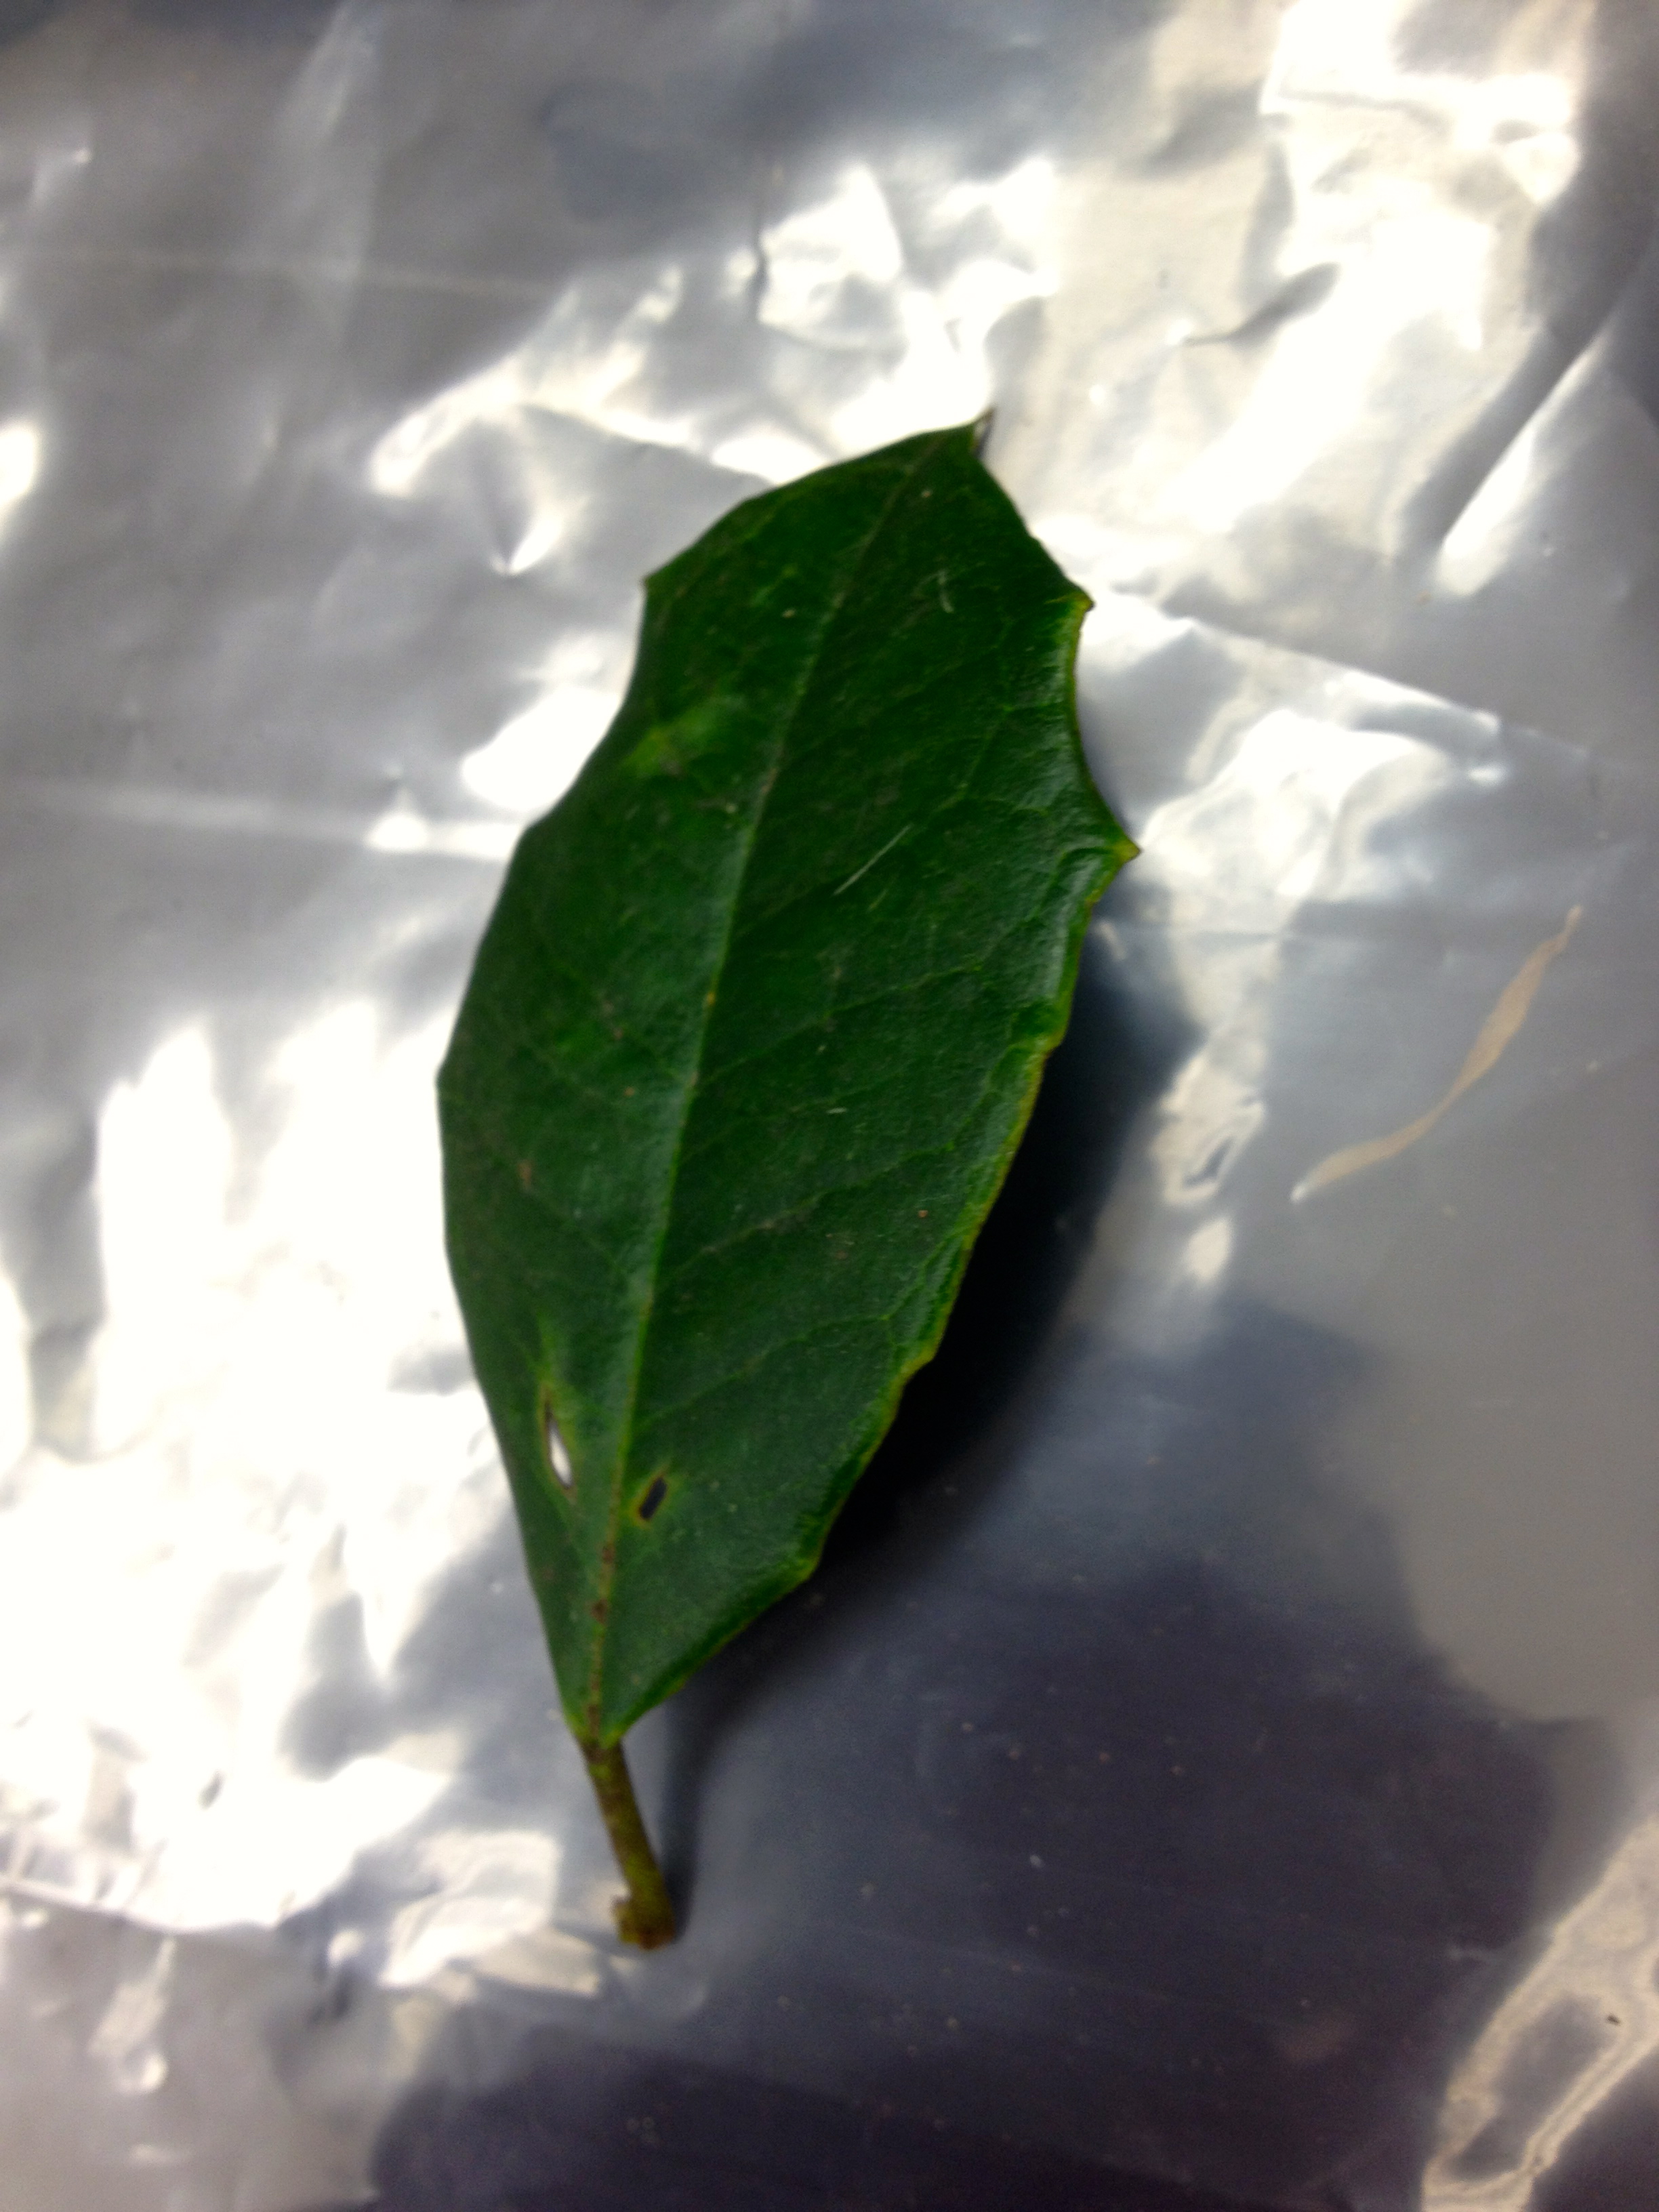
The fifth sample was selected from a branch that had fallen from the holly tree within our transect. It was significantly thicker than the other samples we collected. It was lighter in color and had a smoother texture than the other leaves. The xylem and phloem were more difficult to see in the dissecting microscope because of the thickness of the plant cells. It was a dicot. The edges of the leaf were drawn into points and sharp. This holly tree had some flowers and berries present, signifying an angiosperm.
Table 1: Transect Samples
| Transect Sample | Type of leaf | Description | Vascularization | Leaves and Special Characteristics | Seeds, Evidence of Flowers, or other Reproductive Parts |
| 1 | Pine tree needle | Tall tree | Long, thin needles; Seeds on the bottom | Gymnosperm, pinecones present on tree | |
| 2 | Green Leaf 1 | Ivy on the ground | Dicot: xylem and phloem | Evenly distributed veins | No Spore evidence - Angiosperm |
| 3 | Green Leaf 2 | Low-lying broad leafy plant | Dicot: xylem and phloem | Broad network of veins | No Spore evidence - Angiosperm |
| 4 | Oval green leaf | Ivy-esque leaf | Dicot | Ridges on leaf veins | No Spore evidence - Angiosperm |
| 5 | Holly leaf | Tall tree (holly) | Dicot | Xylem and Phloem visible | Berries on the angiosperm |
Conclusions and Future Plans: This lab demonstrated that our transect's plants shared many characteristics. They thrive in a common environment, which contributes to the similar traits. Next week we will use the leaf litter to collect invertebrates and identify which could survive and thrive in this niche.
Lab 3: January 30, 2014
Microbiology and Identifying Bacteria with DNA
Lab Objective: The purpose of this lab will be to observe the bacteria cultures we prepared in lab 2. This will allow for identification of bacteria and/or fungi that was initially present in our hay infusion and transect. We will utilize both agar plates and agar plates with the antibiotic tetrocycline present. We will select several colonies to characterize using cell morphology, gram staining, and a wet mount. Once we have recorded the results, we will select DNA from our selected bacteria colonies and prepared for PCR testing next week.
Hypothesis/Prediction: There will be a variety of bacteria present in the hay infusion, and several types will overlap across different plates and dilations.
Methods & Procedure: We began the lab by counting the total number of bacteria colonies on each plate. We then multiplied these numbers by the conversion factor warranted by the dilution present on that particular plate. We then compared the number and types of colonies that were on plates with the antibiotic present against the plates that simply had nutrients. This included noting diverging and similar morphology and recording it. After these more general observations, we made a selection of two bacteria colonies from the nutrient agar plates and two bacteria colonies from the tetracycline plates. We made wet mounts and then observed motility, as well as the presence of cilia or flagella that would make i possible. We also viewed our selections under a microscope and recorded more detailed cell morphology to compare within the specimens. The last step in characterizing these slides was by gram staining them. o to this, we used heat from the Bunsen burner to fix the bacteria, and performed several rounds of washing and rinsing the sample with chemicals. Two of these were dyes, one of which adheres to gram positive bacteria because of the presence of the cell wall, and the other to the second layer of cell membrane (gram negative). Iodine and ionized water were also used as washes to get rid of excess dye on the plate. The final step was preparing to run PCR next lab by isolating some of the bacteria's DNA using the centrifuge.
Data:
We looked at the hay infusion once again, which has become less cloudy in the last week. This experiment required the counting of the colonies on plates created in the previous dilutions.
The antibiotic plates contained tetracycline and agar, while the control plates simply held nutrient agar. Among all our plates, there were more bacteria colonies present on the antibiotic plates. There was a variety of colored bacteria flora on the plates, ranging from white to yellow to an extremely dark black one. From this group, we identified three samples to further investigate.
Table 1: Colonies Present
| Dilution (plate label) | Agar | Colonies | Conversion Factor | Colonies/mL |
| 10^-3 | nutrient | Can't count | x 10^3 | |
| 10^-5 | nutrient | 37 | x 10^5 | 37 x 10^5 |
| 10^-7 | nutrient | 4 | x 10^7 | 4 x 10^7 |
| 10^-9 | nutrient | 0 | x 10^9 | 0 (air bubbles present) |
| 10^-3 | nutrient + tet | 98 | x 10^3 | 98 x 10^3 |
| 10^-5 | nutrient + tet | 5 | x 10^5 | 5 x 10^5 |
| 10^-7 | nutrient + tet | 0 | x 10^7 | 0 (air bubbles present) |
Table 2: Selected Colony Specimens
| Colony Label | Tet or Nutrient | Colony Description (color, shape, texture etc) | Color Description (Motility, shape, arrangement etc) | Gram Positive or Gram Negative) |
| 10^-5 black colony | Nutrient | Black, round/oval shape, diplococcus, circular morphology, slightly raised elevation | Cell wall, coccus, single cell | Gram negative |
| 10^-7 orange colony | Nutrient | Circular form, egg yolk color, raised convex elevation | coccus, no visible cell wall, darker in the middle, smooth | Gram negative |
| 10^-3 orange colony | Tetrocycline | cicular form, egg yolk color, raised elevation, entire edge | circular edge, no real visible cell wall, smooth | Gram negative |
The first sample we collected was the odd black colored one present on the 10^-5 nutrient agar plate. This colony was black, with a round/ovalish shape. It also was diplococcus with circular morphology. There is a slightly raised elevation to the colony. This was the only cell in which motility was easily visible, with a flagella pushing it through the water and across the wet mount. When the gram stain was performed it was gram negative with the gram staining procedure.
The second colony was on the 10^-7 nutrient agar plate and was orange colony. It had circular form, egg yolk color and a raised convex elevation. There is a coccus shape, no visible cell wall and it is darker in the middle. There was a high concentration of cells which made it difficult to observe motility. It is also smooth and gram negative with the gram staining procedure.
Our last colony was from the tetracycline 10^-3 plate and it was orange. This colony was extremely similar to the 10^-7 agar plate. This colony had a circular form, with the egg yolk color, raised elevation with an entire edge. This sample had a circular edge with no real visible cell wall with a smooth surface. Like specimen two, the high volume of cells made it difficult to discern the exact motility. This was also gram negative, also revealing a pink color.
Conclusions and Future Plans: I was surprised to observe the high concentrations of bacteria on our antibiotic agar plates. Though the tetracycline allowed for self-selection of the most resistant bacteria, I did not expect the extreme number of colonies that grew at a slightly faster rate than the nutrient plates. Moving forward, we will send the DNA of our bacteria samples for PCR analysis. With that information, we can provide a more in-depth analysis of the characteristics we observed and that the bacteria is expected to have.
SC
Lab 2: January 30, 2014
Identifying Algae and Protists
Lab Objective: The main objective of this lab is to observe and identify algae and protists that have grown in the hay infusion we collected over the last week. The main objective of this lab is to be able to able to identify our specimens based upon our understanding of the characteristics of protists and algae and to use the provided dichotomous key. We will also begin preparation for next week's lab.
Hypothesis/Prediction: There will be a presence of algae and protists in the culture, based upon the location of initial transect and where we took our initial sample.
Methods & Procedure: This lab began with the observation of common algae and protists under the microscope. We began with brown algae, and green algae, and then saw a variety of protists. Based upon the usage of the dichotomous key with these known samples, we moved on to the main objective of the lab: identifying those from our transect. We collected three samples, electing to use the top, middle, and bottom niches of the hay infusions. These were the most clear divisions, with the settling serving as distinct separation from the heavy dirt at the bottom, milky tones in the middle and film on the top. We created a wet mount for each niche and observed them under the microscope.
We then prepared for the next lab by creating serial dilutions from way had grown in our hay infusion. This was completed by beginning with a heavily concentration volume of the sample, and gradually diluting it through movements of small volume to another container, mixing, and moving another small sample to the next container. We then prepared agar plates using each dilution. 4 dilutions were prepared as controls, while 3 served as test plates with tetracycline present. The math needed to complete this will be uploaded.
Data:
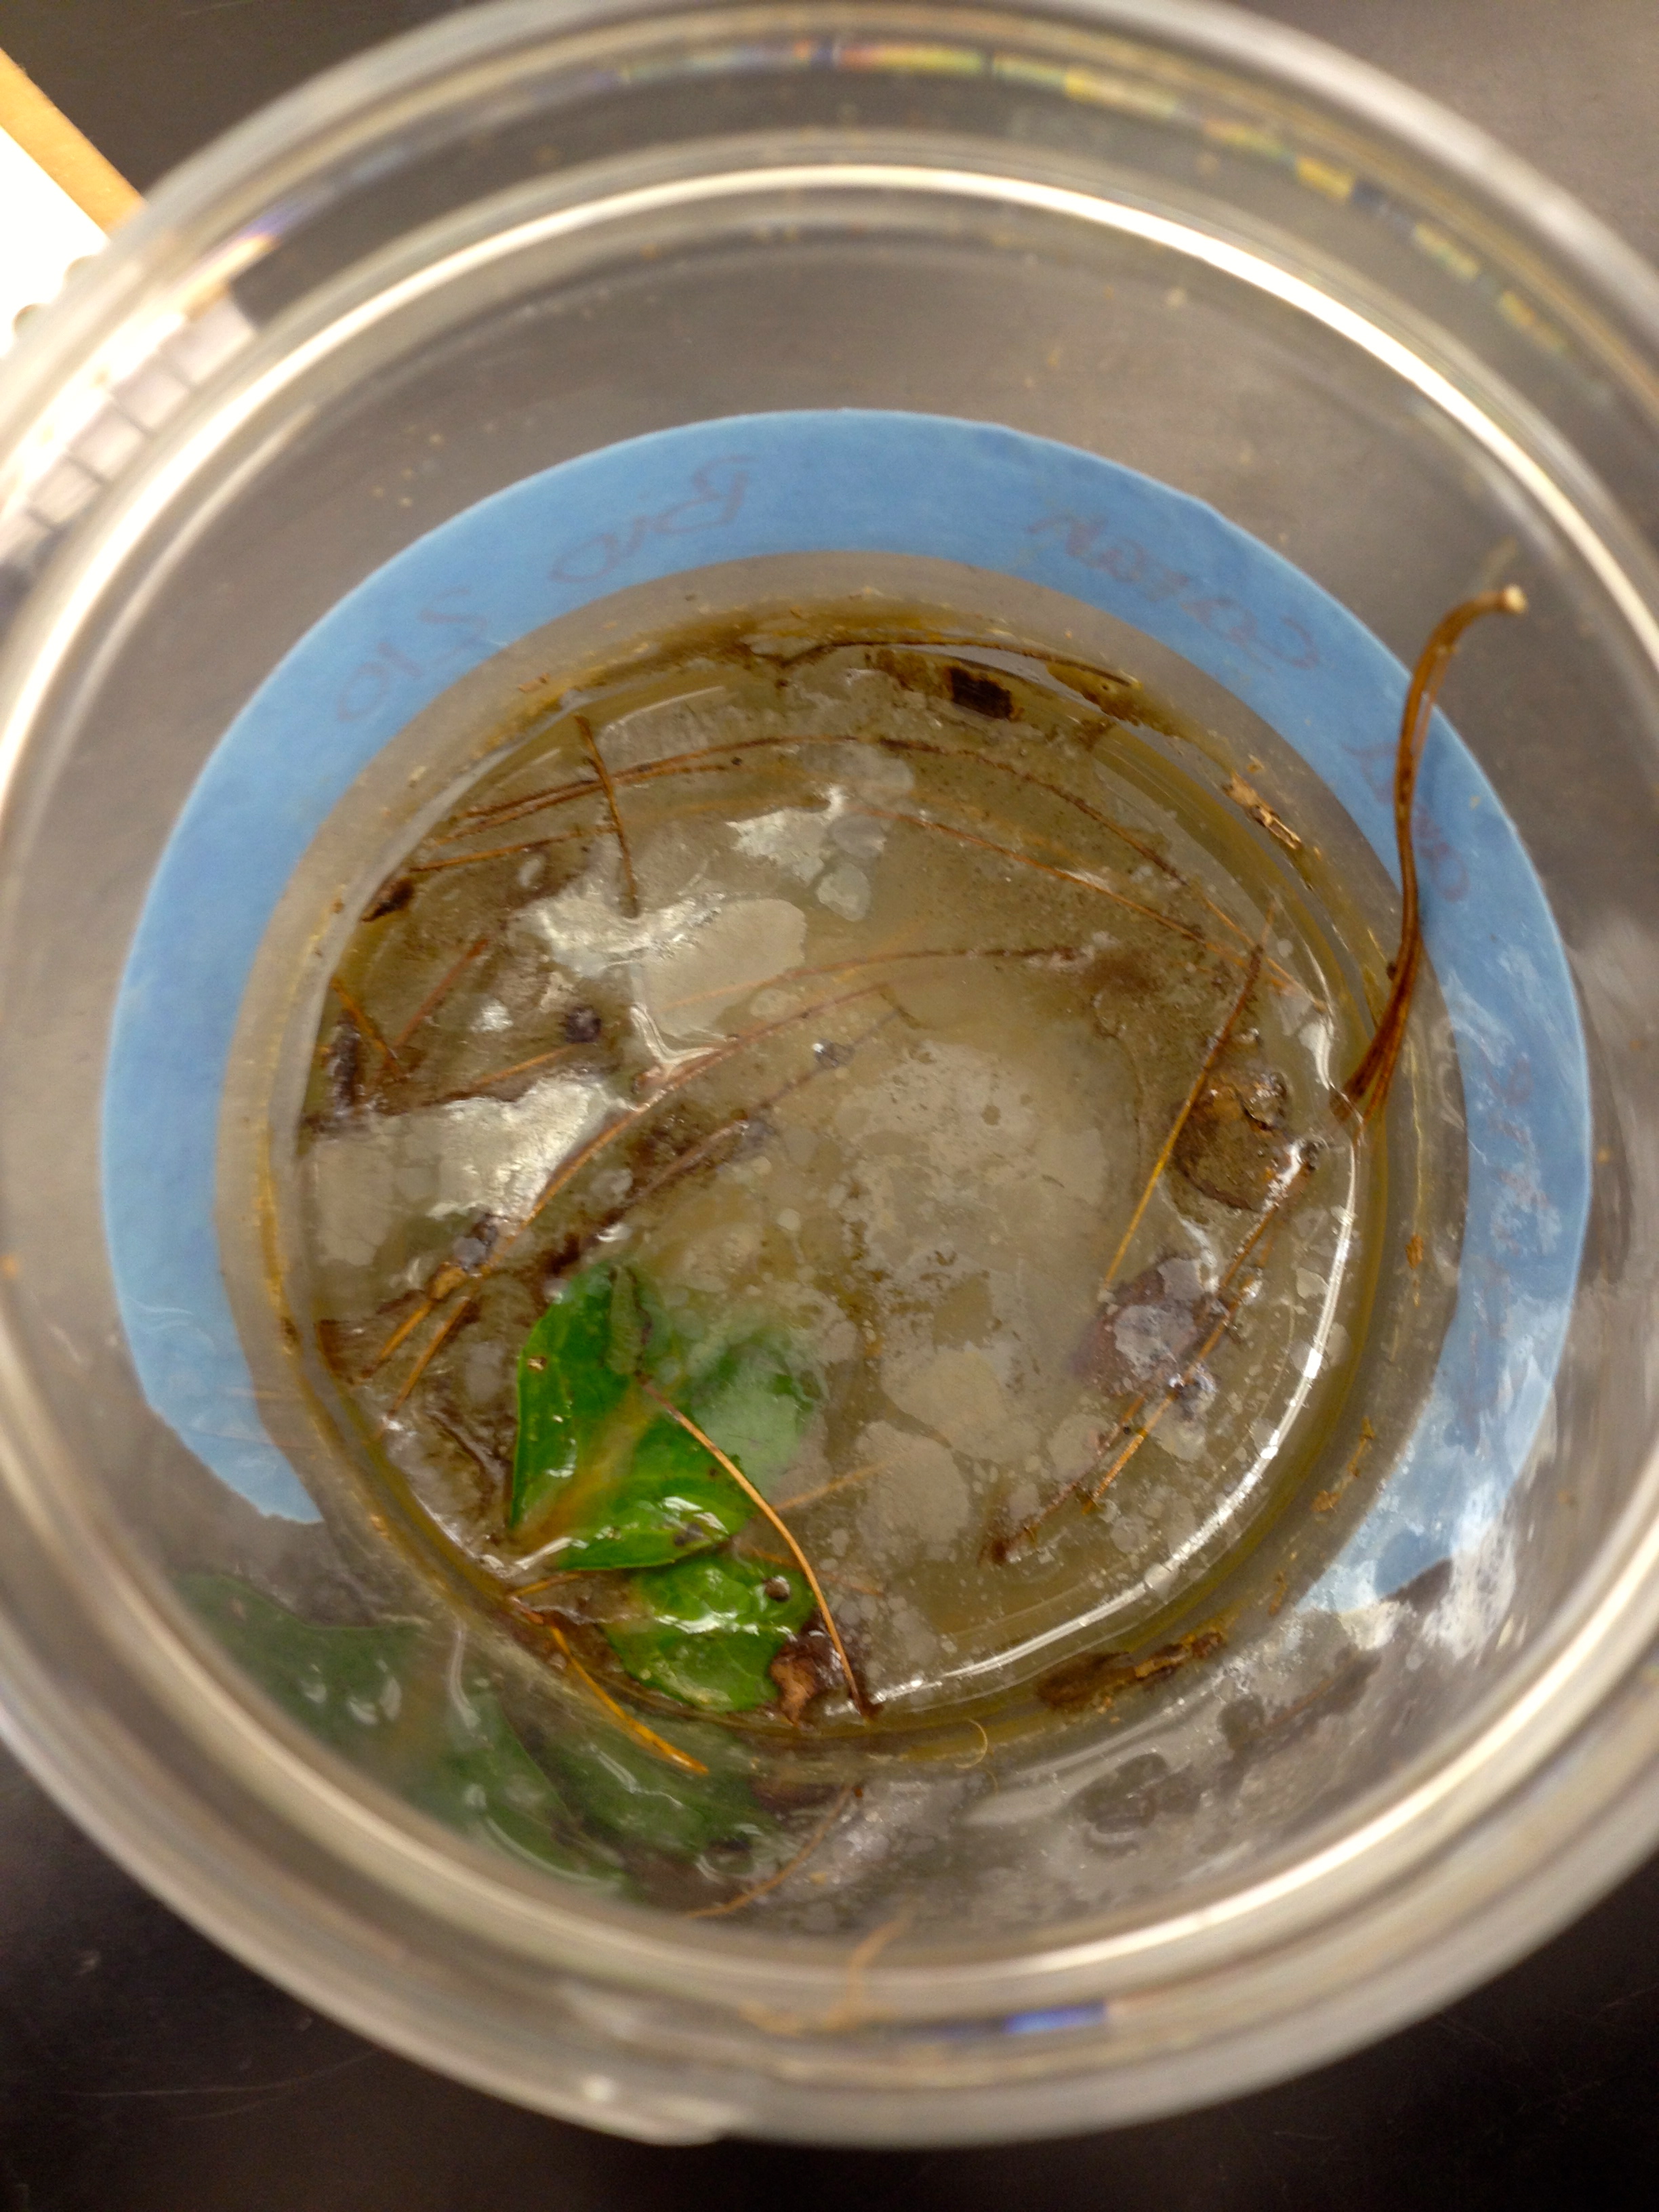
Hay Infusion Observations: Our infusion is extremely smelly, which may be accountable to the presence of rotting leaves. The bottom niche is a deep green-brown, where a layer of dirt has settled. This color gradually lightens to a very cloudy grey as you move up the different niches. The small sticks and leaves that we collected tend to be in the middle and top of the infusion. The top niche consists of a film, that can perhaps be linked to the milk powder we added as a nutrient.
Figure 1: Hay Infusion - Side View
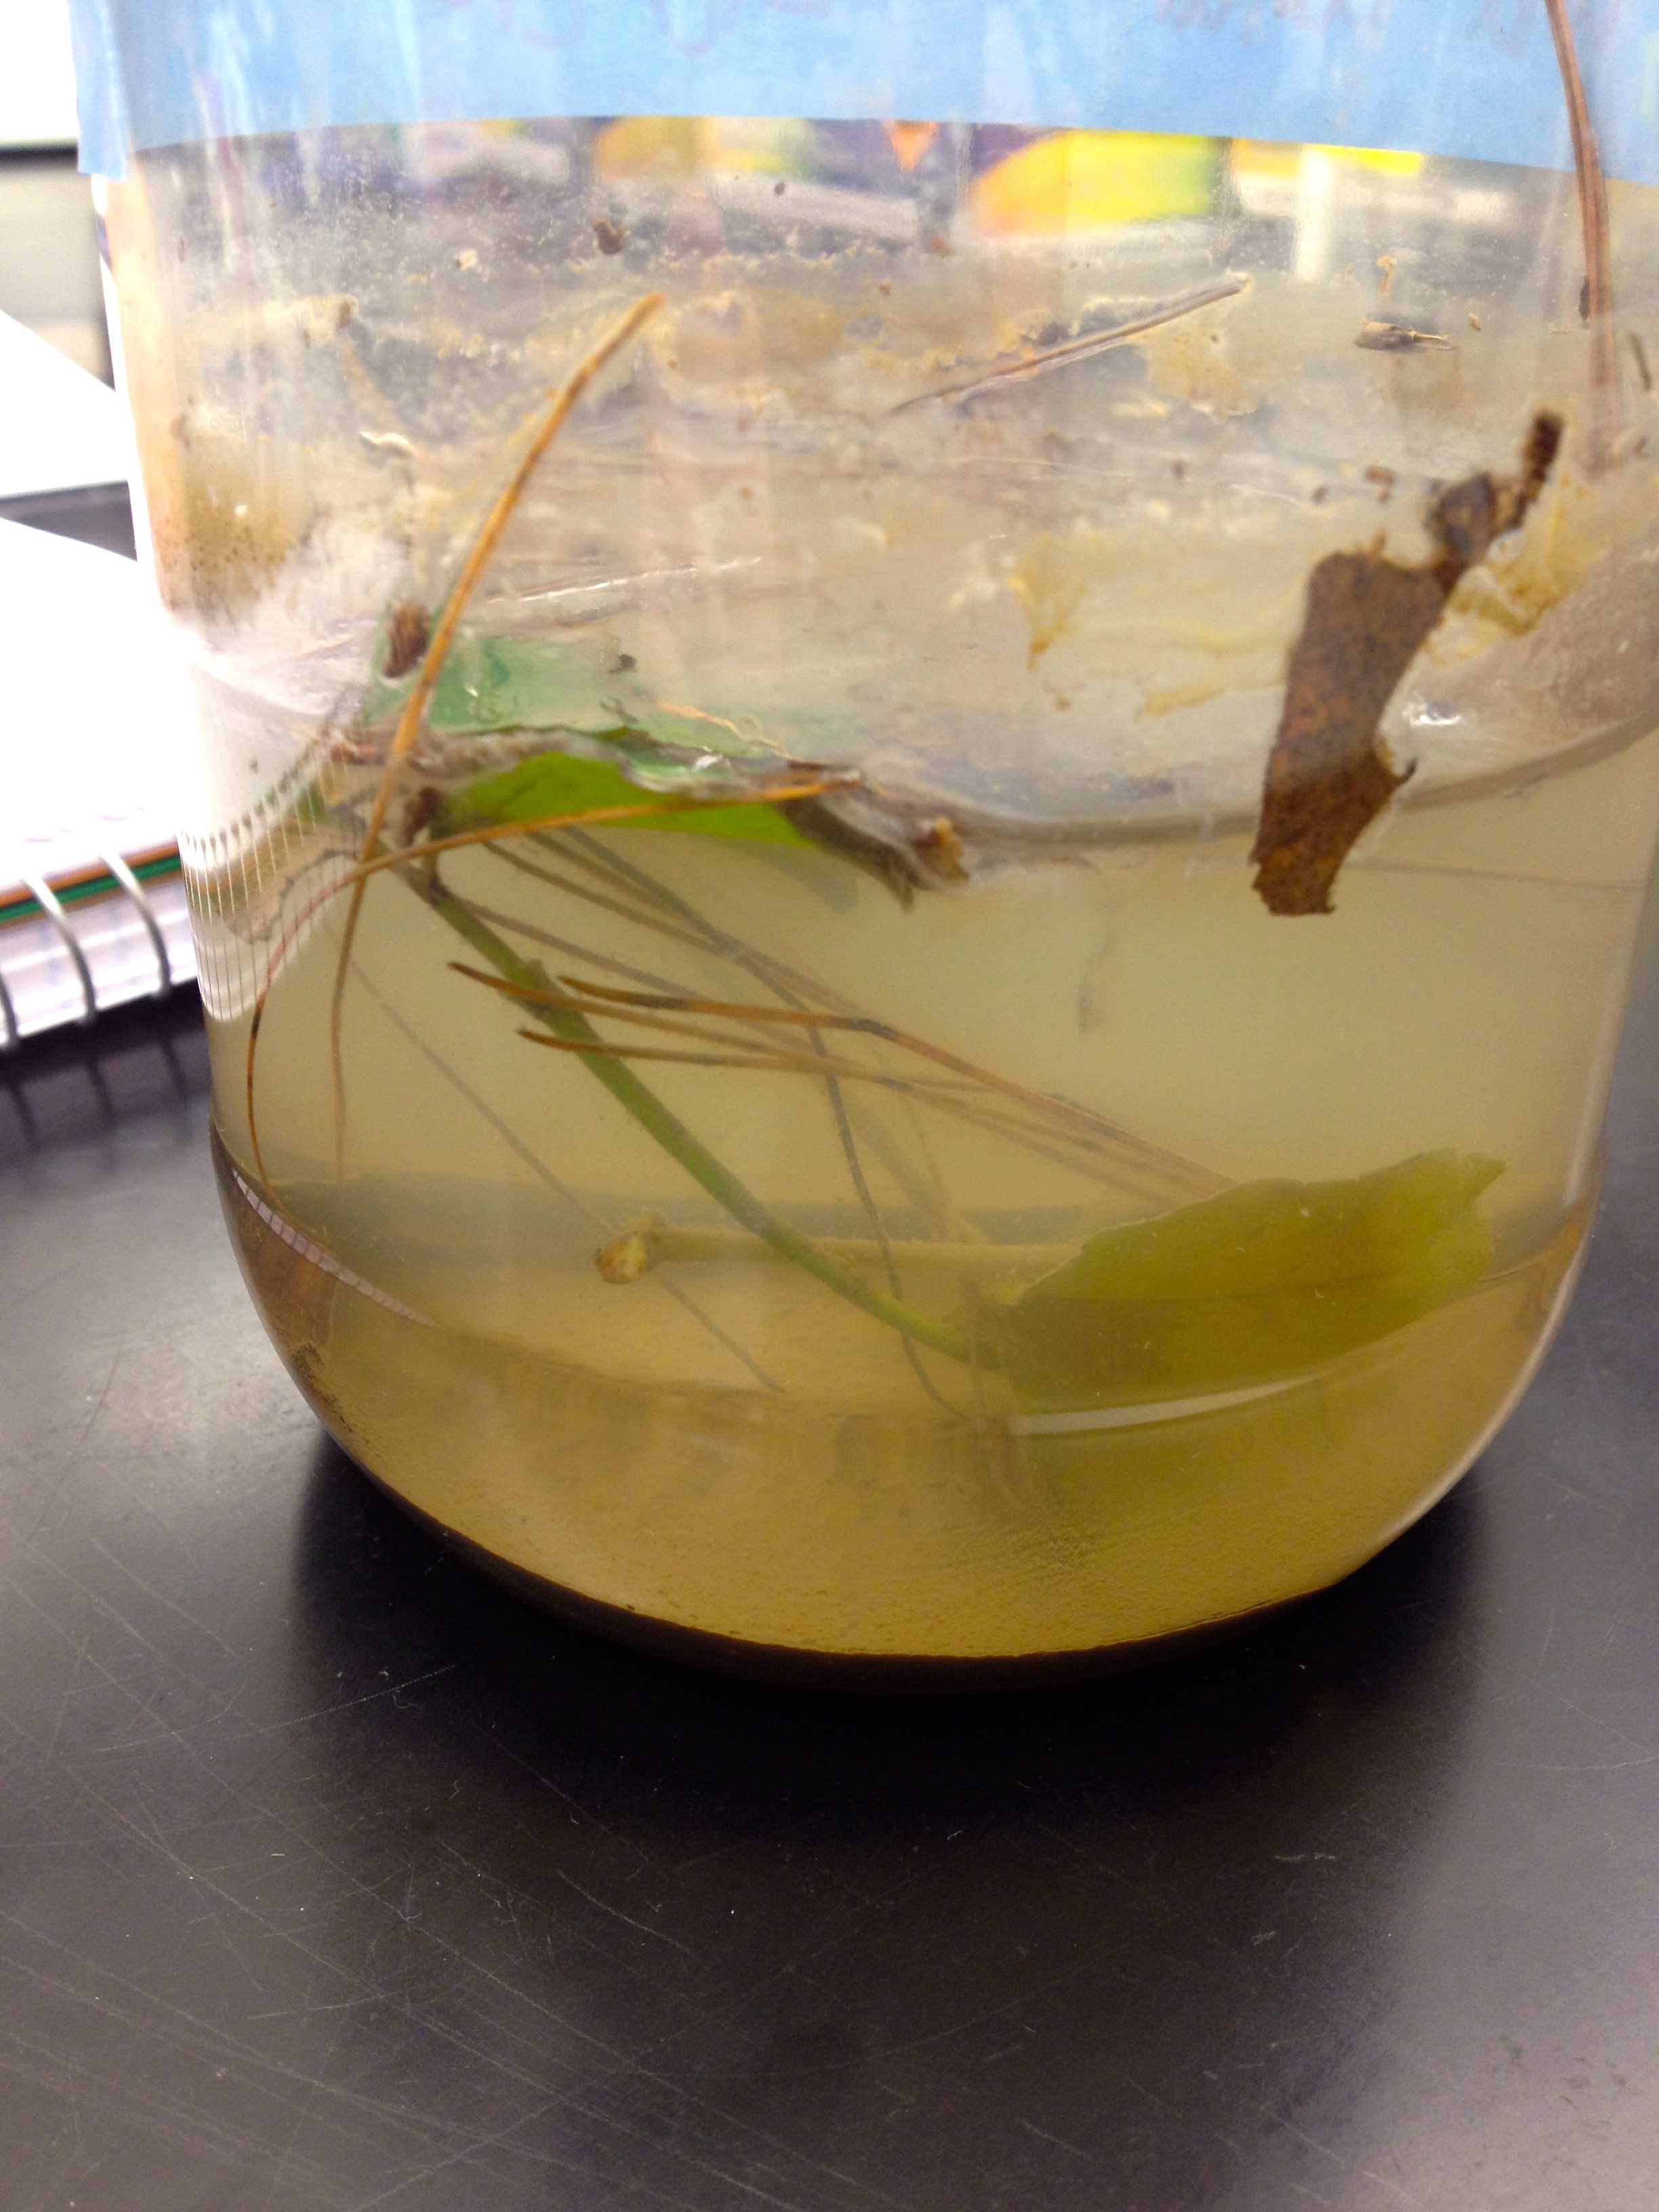
Figure 2: Hay Infusion - Top View
Protists and Algae Observations: As noted earlier, we elected to take samples from the top, middle and bottom niches. On the top level, we identified our largest sample of Gonium (~80 micrometers). The sample had between 15 and 18 cells in the colony, with green and brown extending arms. The top layer also yielded Volvox (~400 micrometers). This was more complex than the Gonium but shared the color and arm traits previously observed. On the middle level, we observed a smaller Gonium (~60 micrometers). This could have been attributed to less direct sunlight presence or nutrients available. The second organism observed in the middle was a chilomonas protist (~20 micrometers). This protist had a more oval, or elongated shape, with a difficult to observe flagella, and was a clear color. On the bottom of the hay infusion, we identified a paramecium (~5 micrometers). It was immobile with a reddish tint to it, yet what still mostly clear. The bottom layer also yielded what appeared to be a Goniu, but we were not quite sure because of its small size (16 cells). It was green brown like our other Gonium samples and had an oval shape.
Conclusions and Future Plans: It was interesting to observe the variety of organisms in the hay infusion. Based upon my past class in infectious diseases, the next lab will be even more enlightening in terms of the response to the tetrocycline at the different dilution levels. SC
Lab 1: January 23, 2014
Initial Transect Activity
Lab Objective: The objective of this lab was to examine a transect on the grounds of American University, to gather a baseline for further observation later in the semester. During this excursion, a collection of material at the site will be collected to grow a hay infusion to serve as a source for later laboratory experimentation.
Hypothesis/Prediction: Based upon our assignment to the 'pine trees' area, I predict that the moist leaves in the transect will provide a medium to grow a variety of bacteria growth in the future.
Methods & Procedure: For this experiment, we simply observed our assigned location on campus. Once we had arrived from our trek down Massachusetts Avenue, Kaitie and I took notes and photographs of the immediate area. We identified a variety of trees in the niche, as well as a variety of low-growing vegetation. We selected an area in the center of our sector about two feet in front of the largest tree to gather our sample, in which we included ivy leaves, pine needles, soil and rotting leaves from about two inches underneath the top level.
Data:
Location: Tree area near the seminary
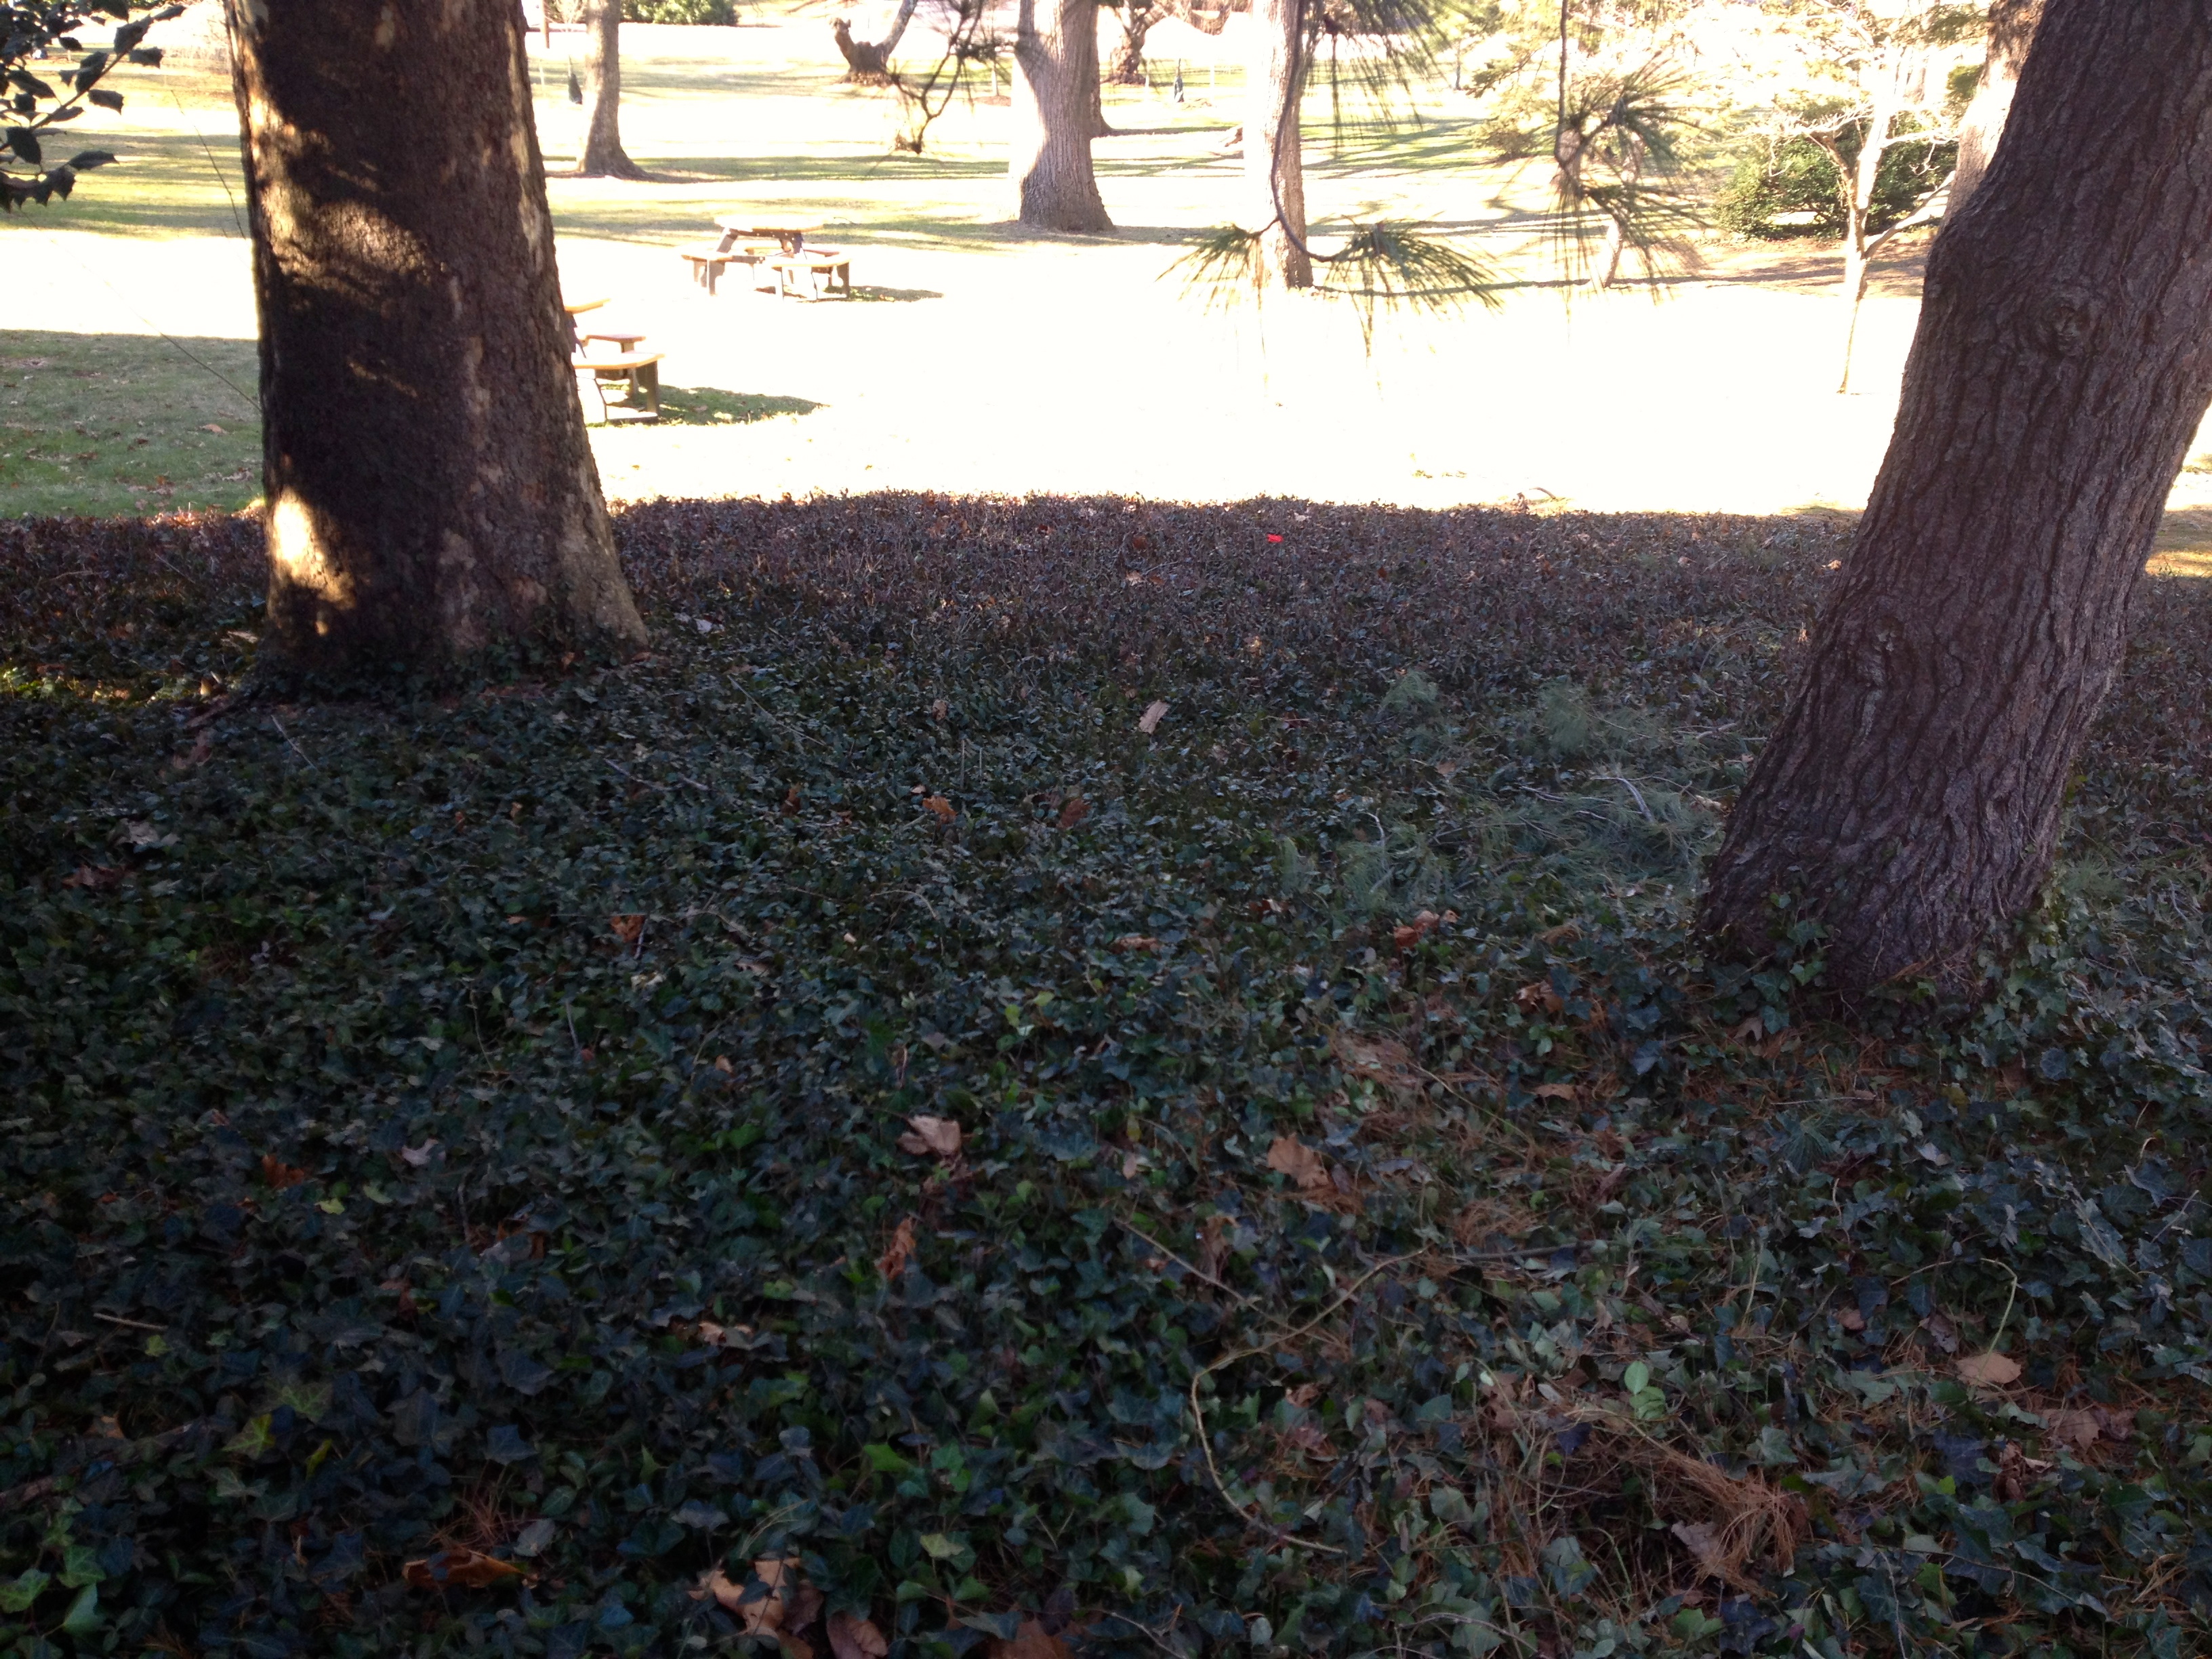
Topography: On a steep hill, with thick ground vegetation. Located in proximity to a brick building in the seminary. This is high potential of human impact at the site because of its proximity to Massachusetts Avenue and a public picnic area. In warmer weather, this area would be frequently visited by members of the seminary and community at large.
Abiotic components: Breeze slightly blocked by hill. Building outside of the marked area impacts the wind and water available to the root systems of the trees. There was some discarded wrapped strewn within the leaves.
Biotic components: Thick ivy on the ground, soil, pebbles, rotting leaves from surrounding trees. One pine tree, one sycamore tree and one holly tree. All were quite old due to the thickness of their stumps, though the holly was thinnest. There was a small stump, recently cut, behind the large sycamore tree that demonstrated the impact that human interaction has had on this area (beyond growing it). Full canopies on the holly and pine trees, while the birch was missing several branches and had no leaves. There were squirrels and birds in the branches, and evidence of deer based upon droppings that Laina pointed out.
Our sample was collected from a location upon my diagram of the site.
Figure 1: Transect View - Day 1
Conclusions and Future Plans: Our transect will be interesting to observe as the weather transitions to the spring because of its proximity to many other living organisms. Our hay infusion has the potential to yield some very interesting results based upon the variety of vegetation present in the transect. SC
