User:Nii Mills/Notebook/Biology 210 at AU
Lab 6 This lab was conducted on 2/19/14 This lab report written on 3/22/14
Introduction: In Biological Life of AU Lab 6: Embryology & Zebra Fish Development the class was given the opportunity to witness one of life’s miracles, the development of an organism as fetus to adulthood under conditions not natural to Zebra fish. The fish were used for this study because of their ideal development, which includes a period of transparency allowing for irregularities and deformities to be easily identifiable. The variable used for this study were various concentrations of nicotine along with a control group of monitored zebra fish that were compared to the variable affected fish over a period of days. Our research’s purpose was to gain a better knowledge of the affects of nicotine on the zebra fish at a young development and its growth into adulthood.
Materials &Methods Three petri dishes were used filled with zebra fish eggs. One dish remained as a control for the study, and the other two were filled with different concentrations of nicotine. The development of the eggs into larvae and then into adults took place over a period of days, where they were periodically monitored for any noticeable changes to the expected development of the organisms.
Procedure: The study called for dividing 20 translucent eggs of zebra fish into three petri dishes, however this number was doubled if not more purposely, but was instead a decision made as a precaution if many eggs died before even hatching. Some eggs had already died we had noticed before the study, hence the additional security. Each petri dish was filled with 20mls of Deerpark Water. Afterwards one petri dish was left alone, while the other two were prepared with concentrations of nicotine. One dish had an addition of 12.5 mg, and the other dish 25mg of nicotine concentration. The dishes were checked in periodically for over two weeks. Dead embryo were counted and removed from the dishes after each observation to prevent contamination to the rest of the petri dish. Unfortunately the study was shortened by outsides factors, which evaporated much of the water from the petri dishes despite replenishing during viewing with 10mls of water or concentration. Also once the fish had reach maturity, they mistakenly went unfed effectively killing all hatchlings. From each petri dish samples of zebra fish were preserved and then used for measuring and observation for differences among them.
Data & Observations
Fig 1: Table 1 Observation of Embryo Groups during 13 days

Fig 2: Table 3 Embryo Ages during development

Fig 3: Table 3 Observation of Embryo Groups after 13 days
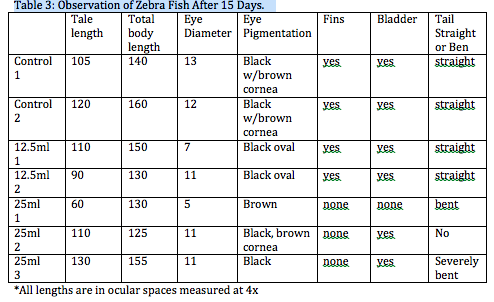 Fig 4. Zebra fish eggs before they hatched
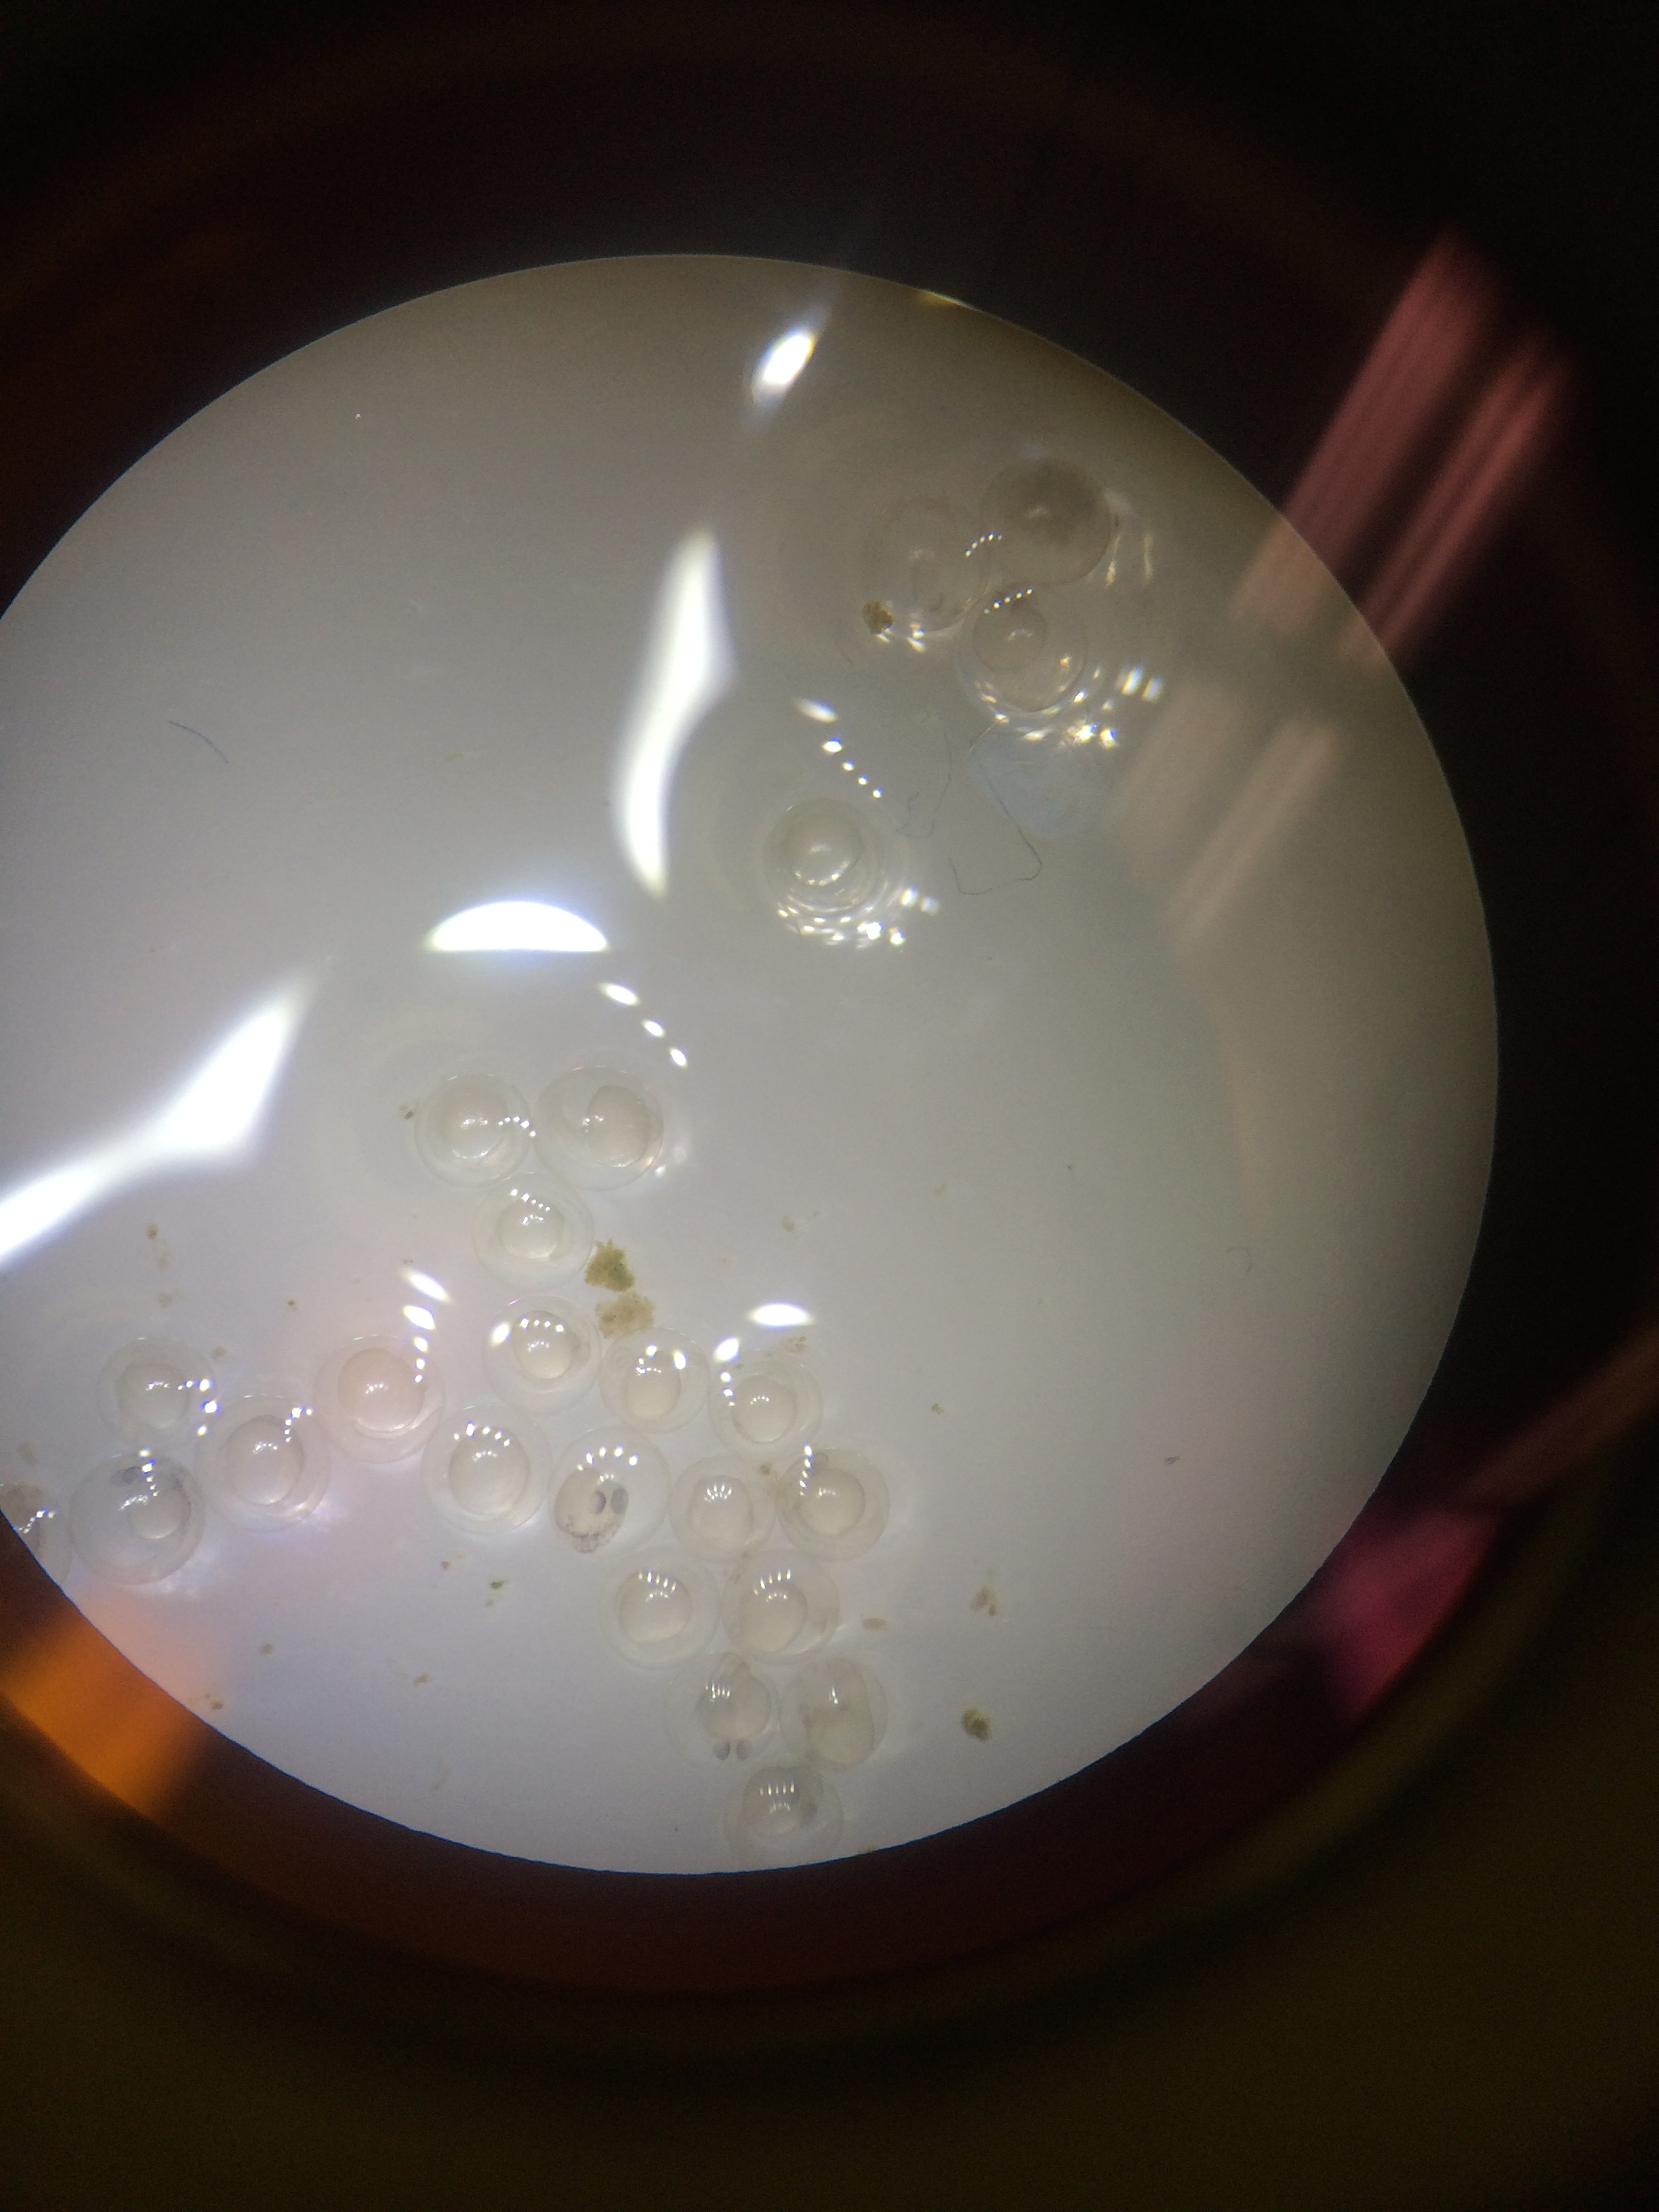 Fig 5. Close of larvae still contained in the egg
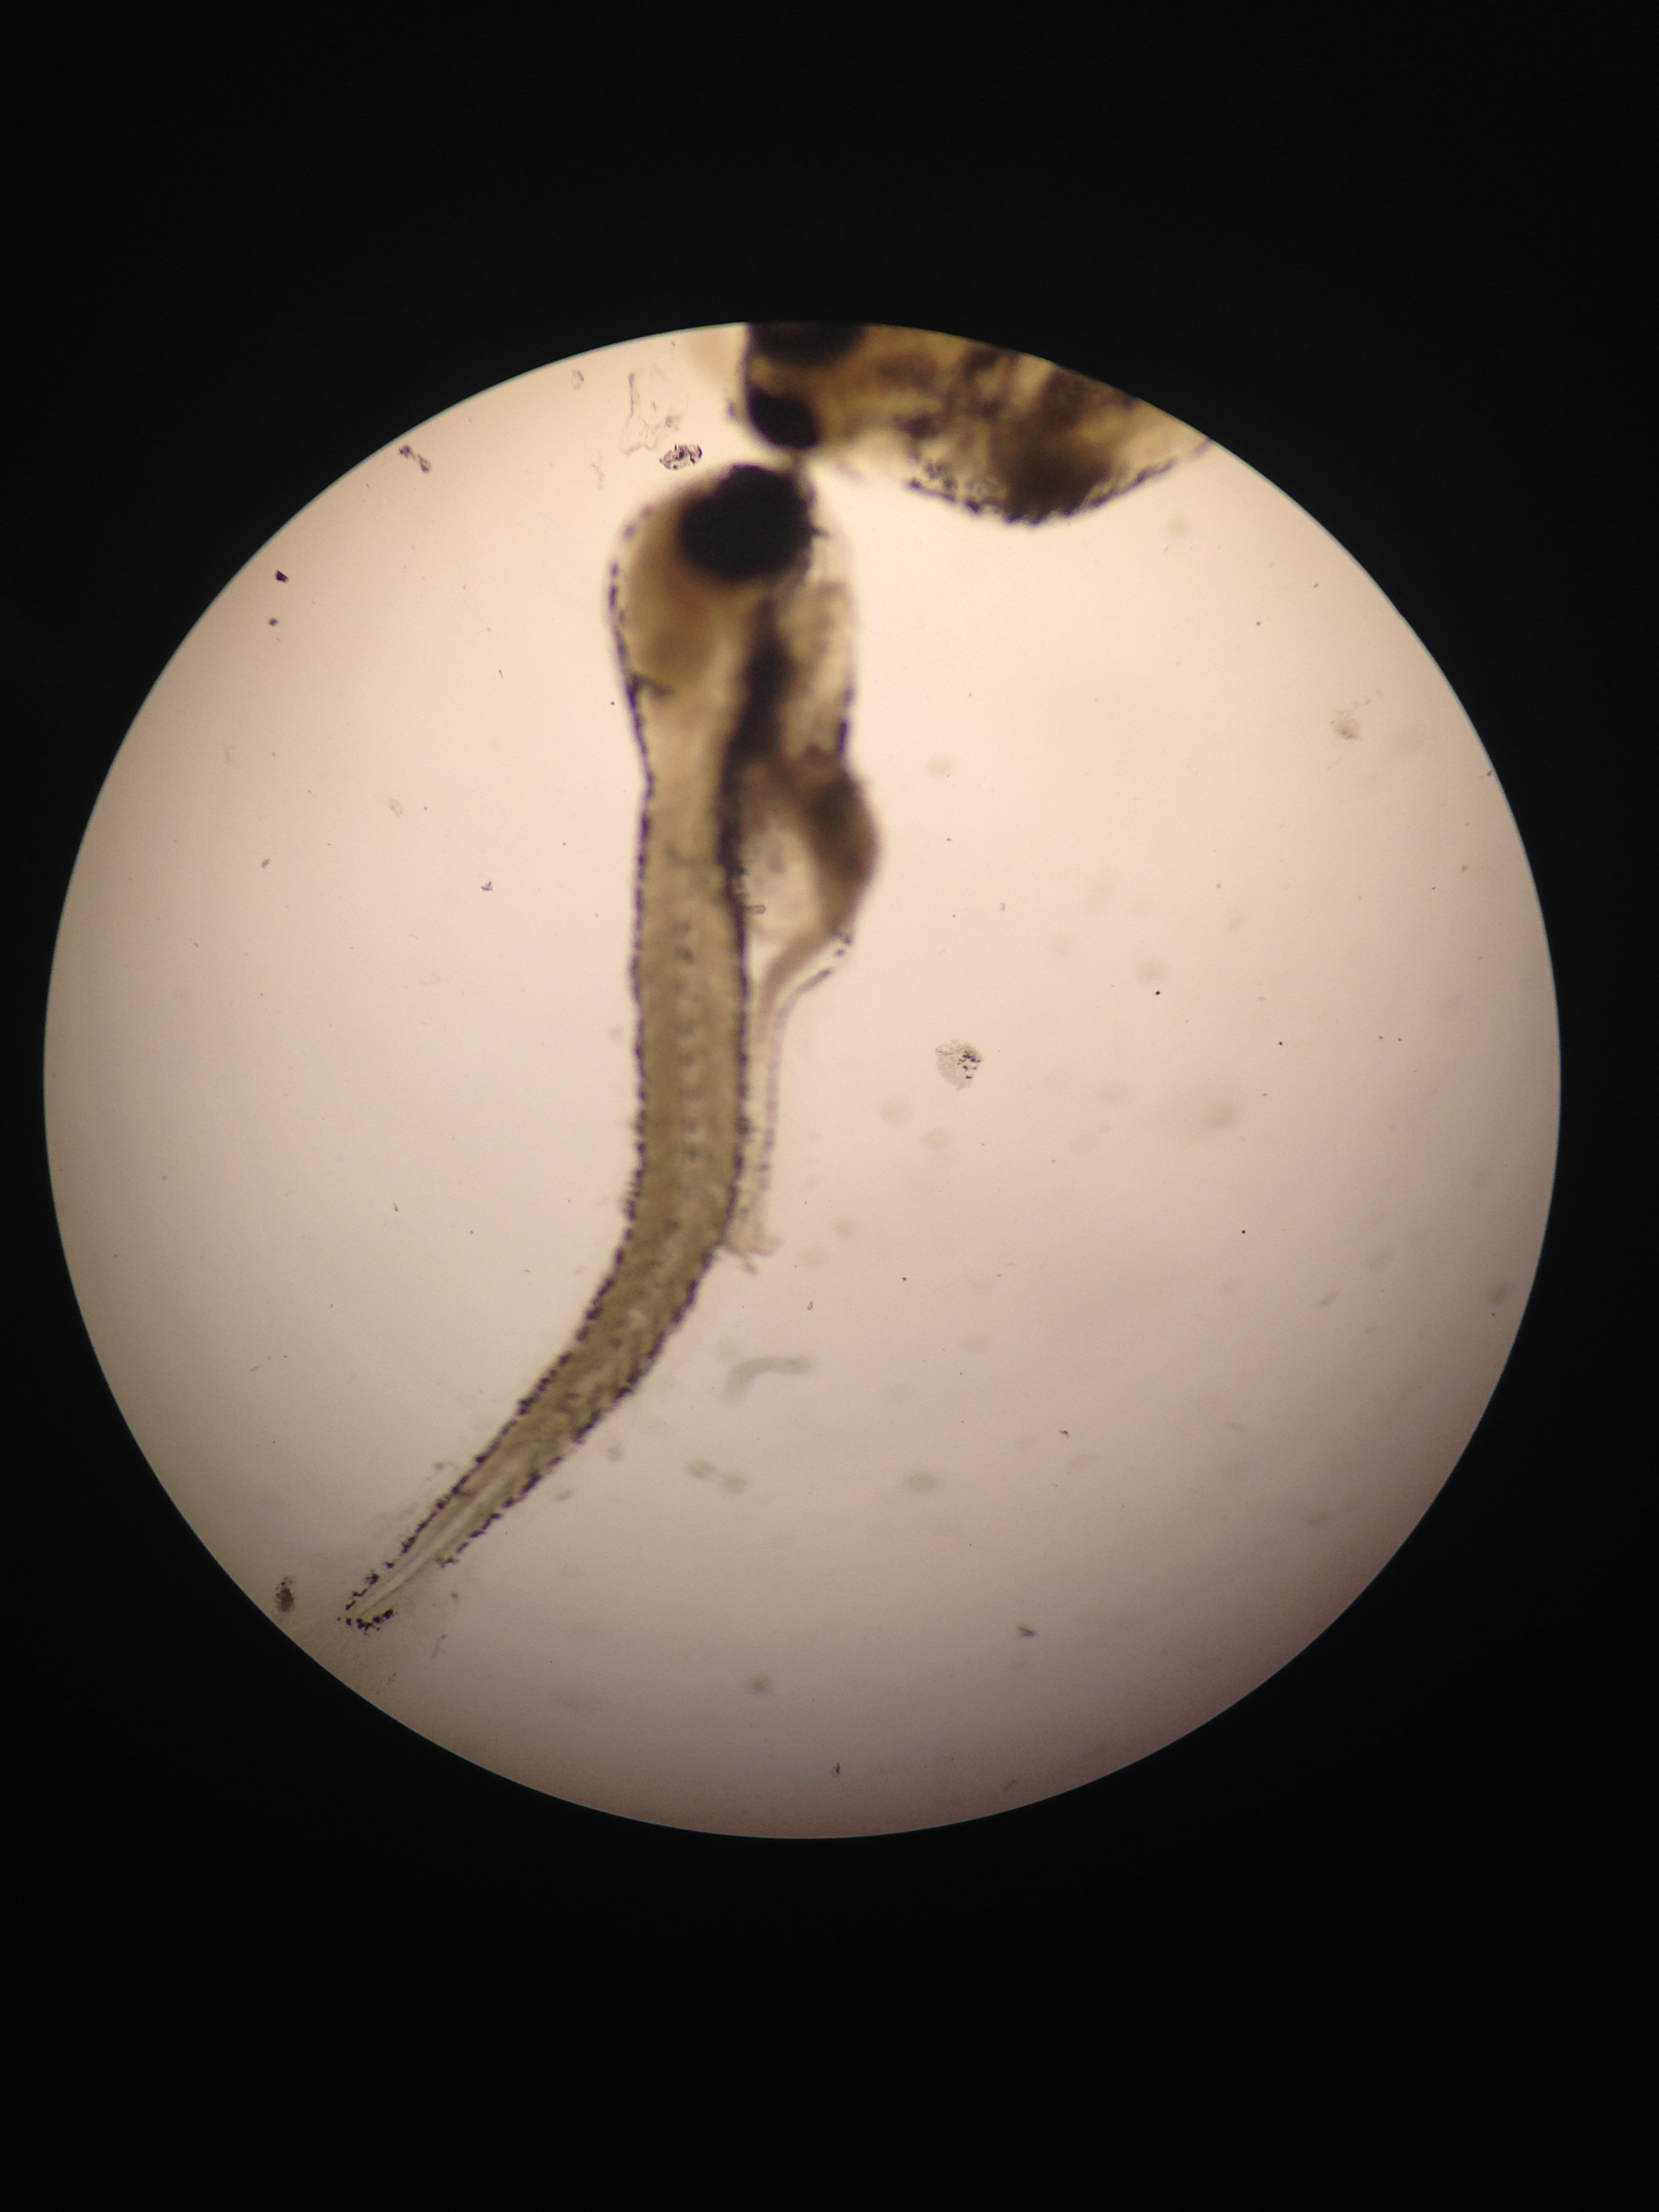
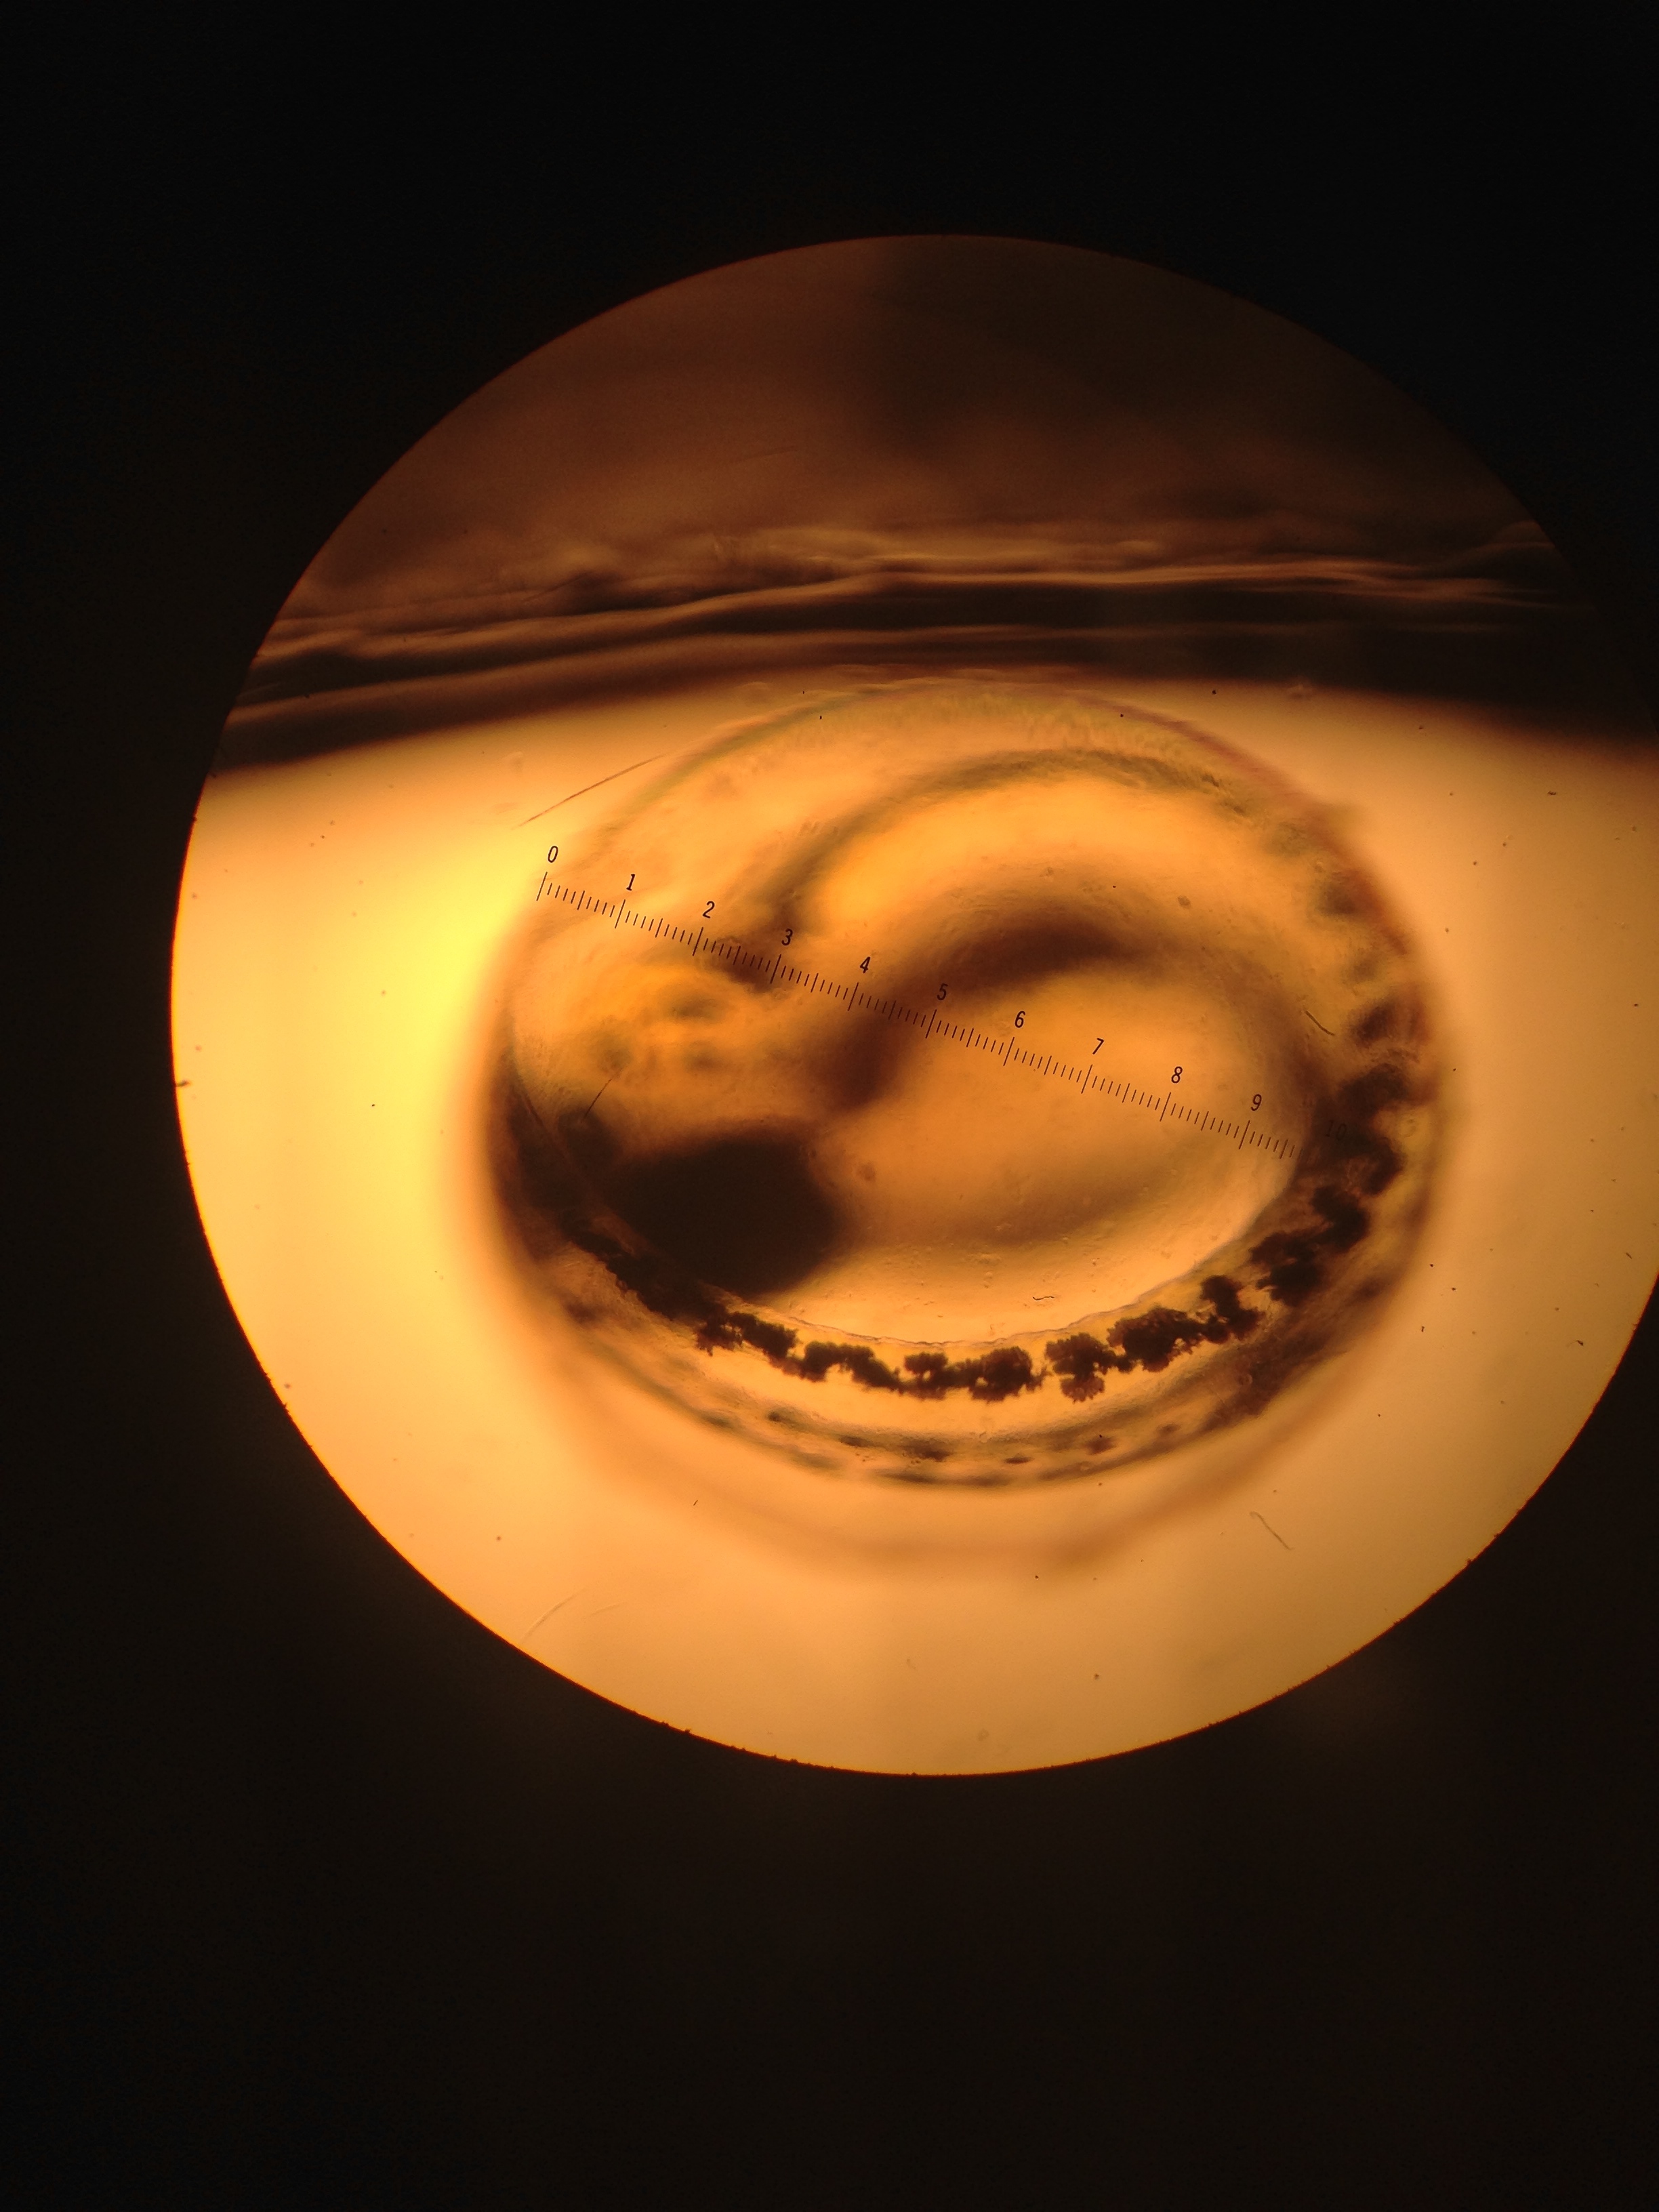 Fig 6. Close up of zebra fish larvae called hatchlings
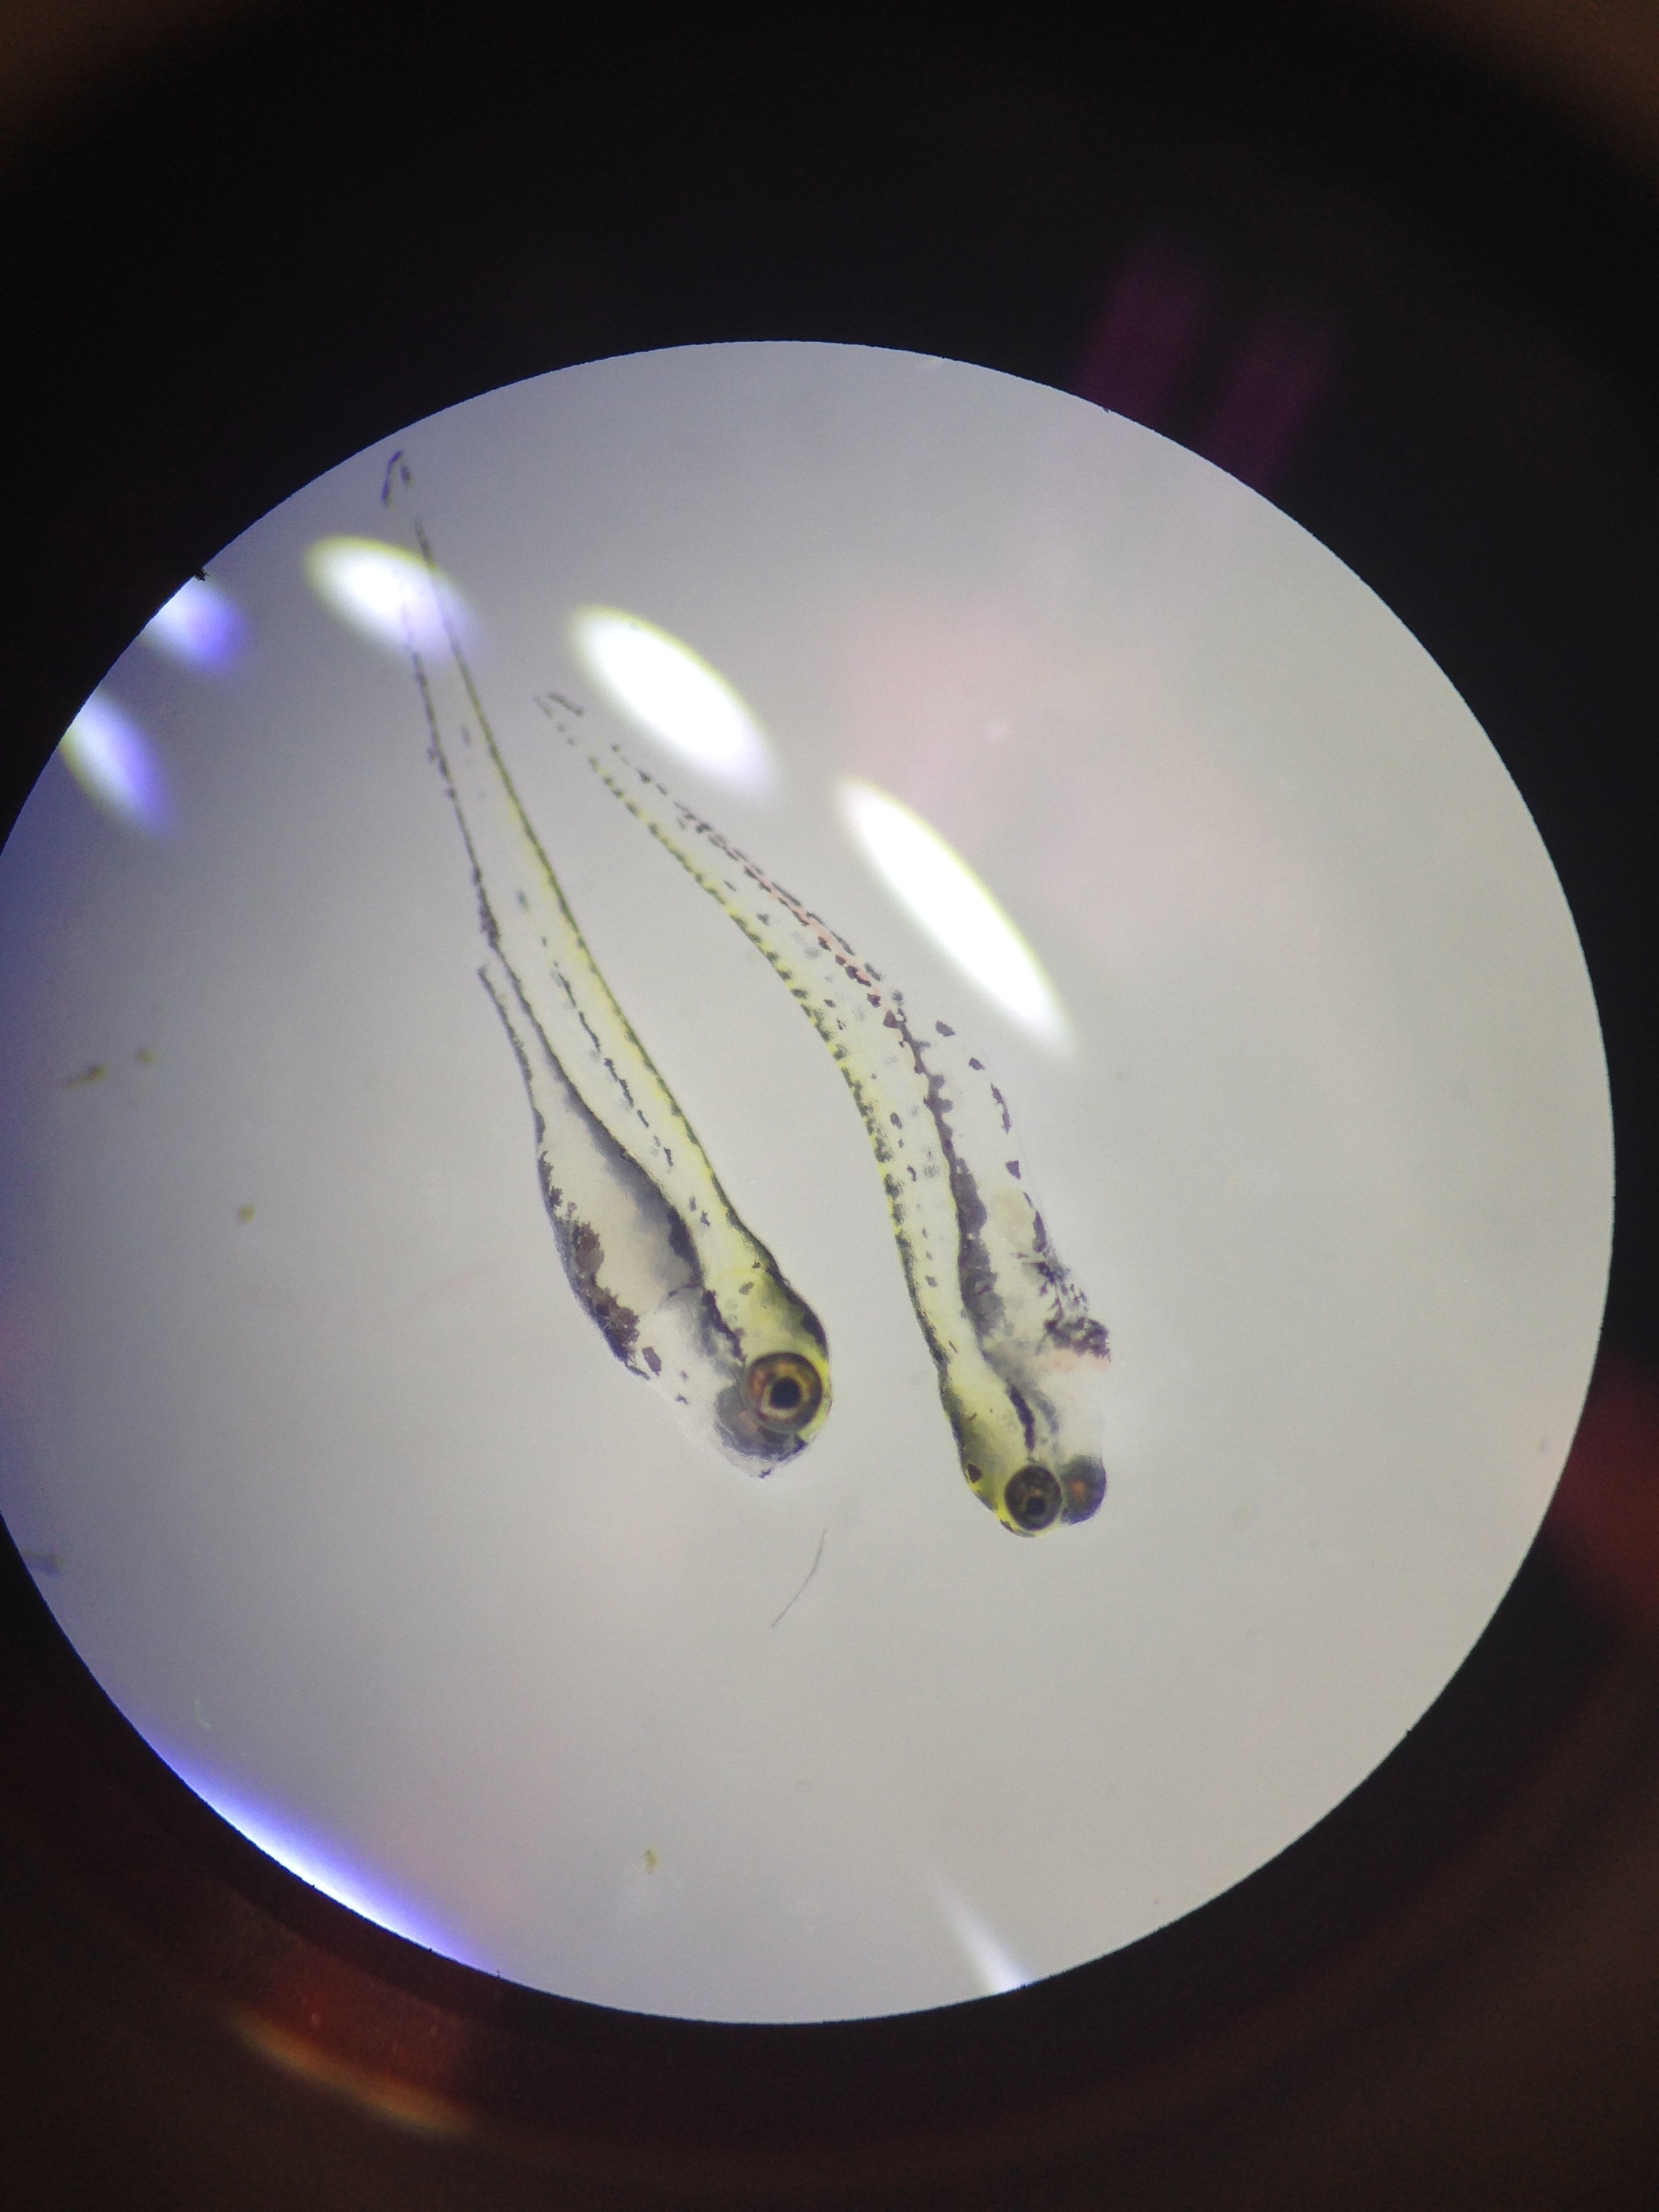 Fig 7. Swimming hatchlings of zebra fish
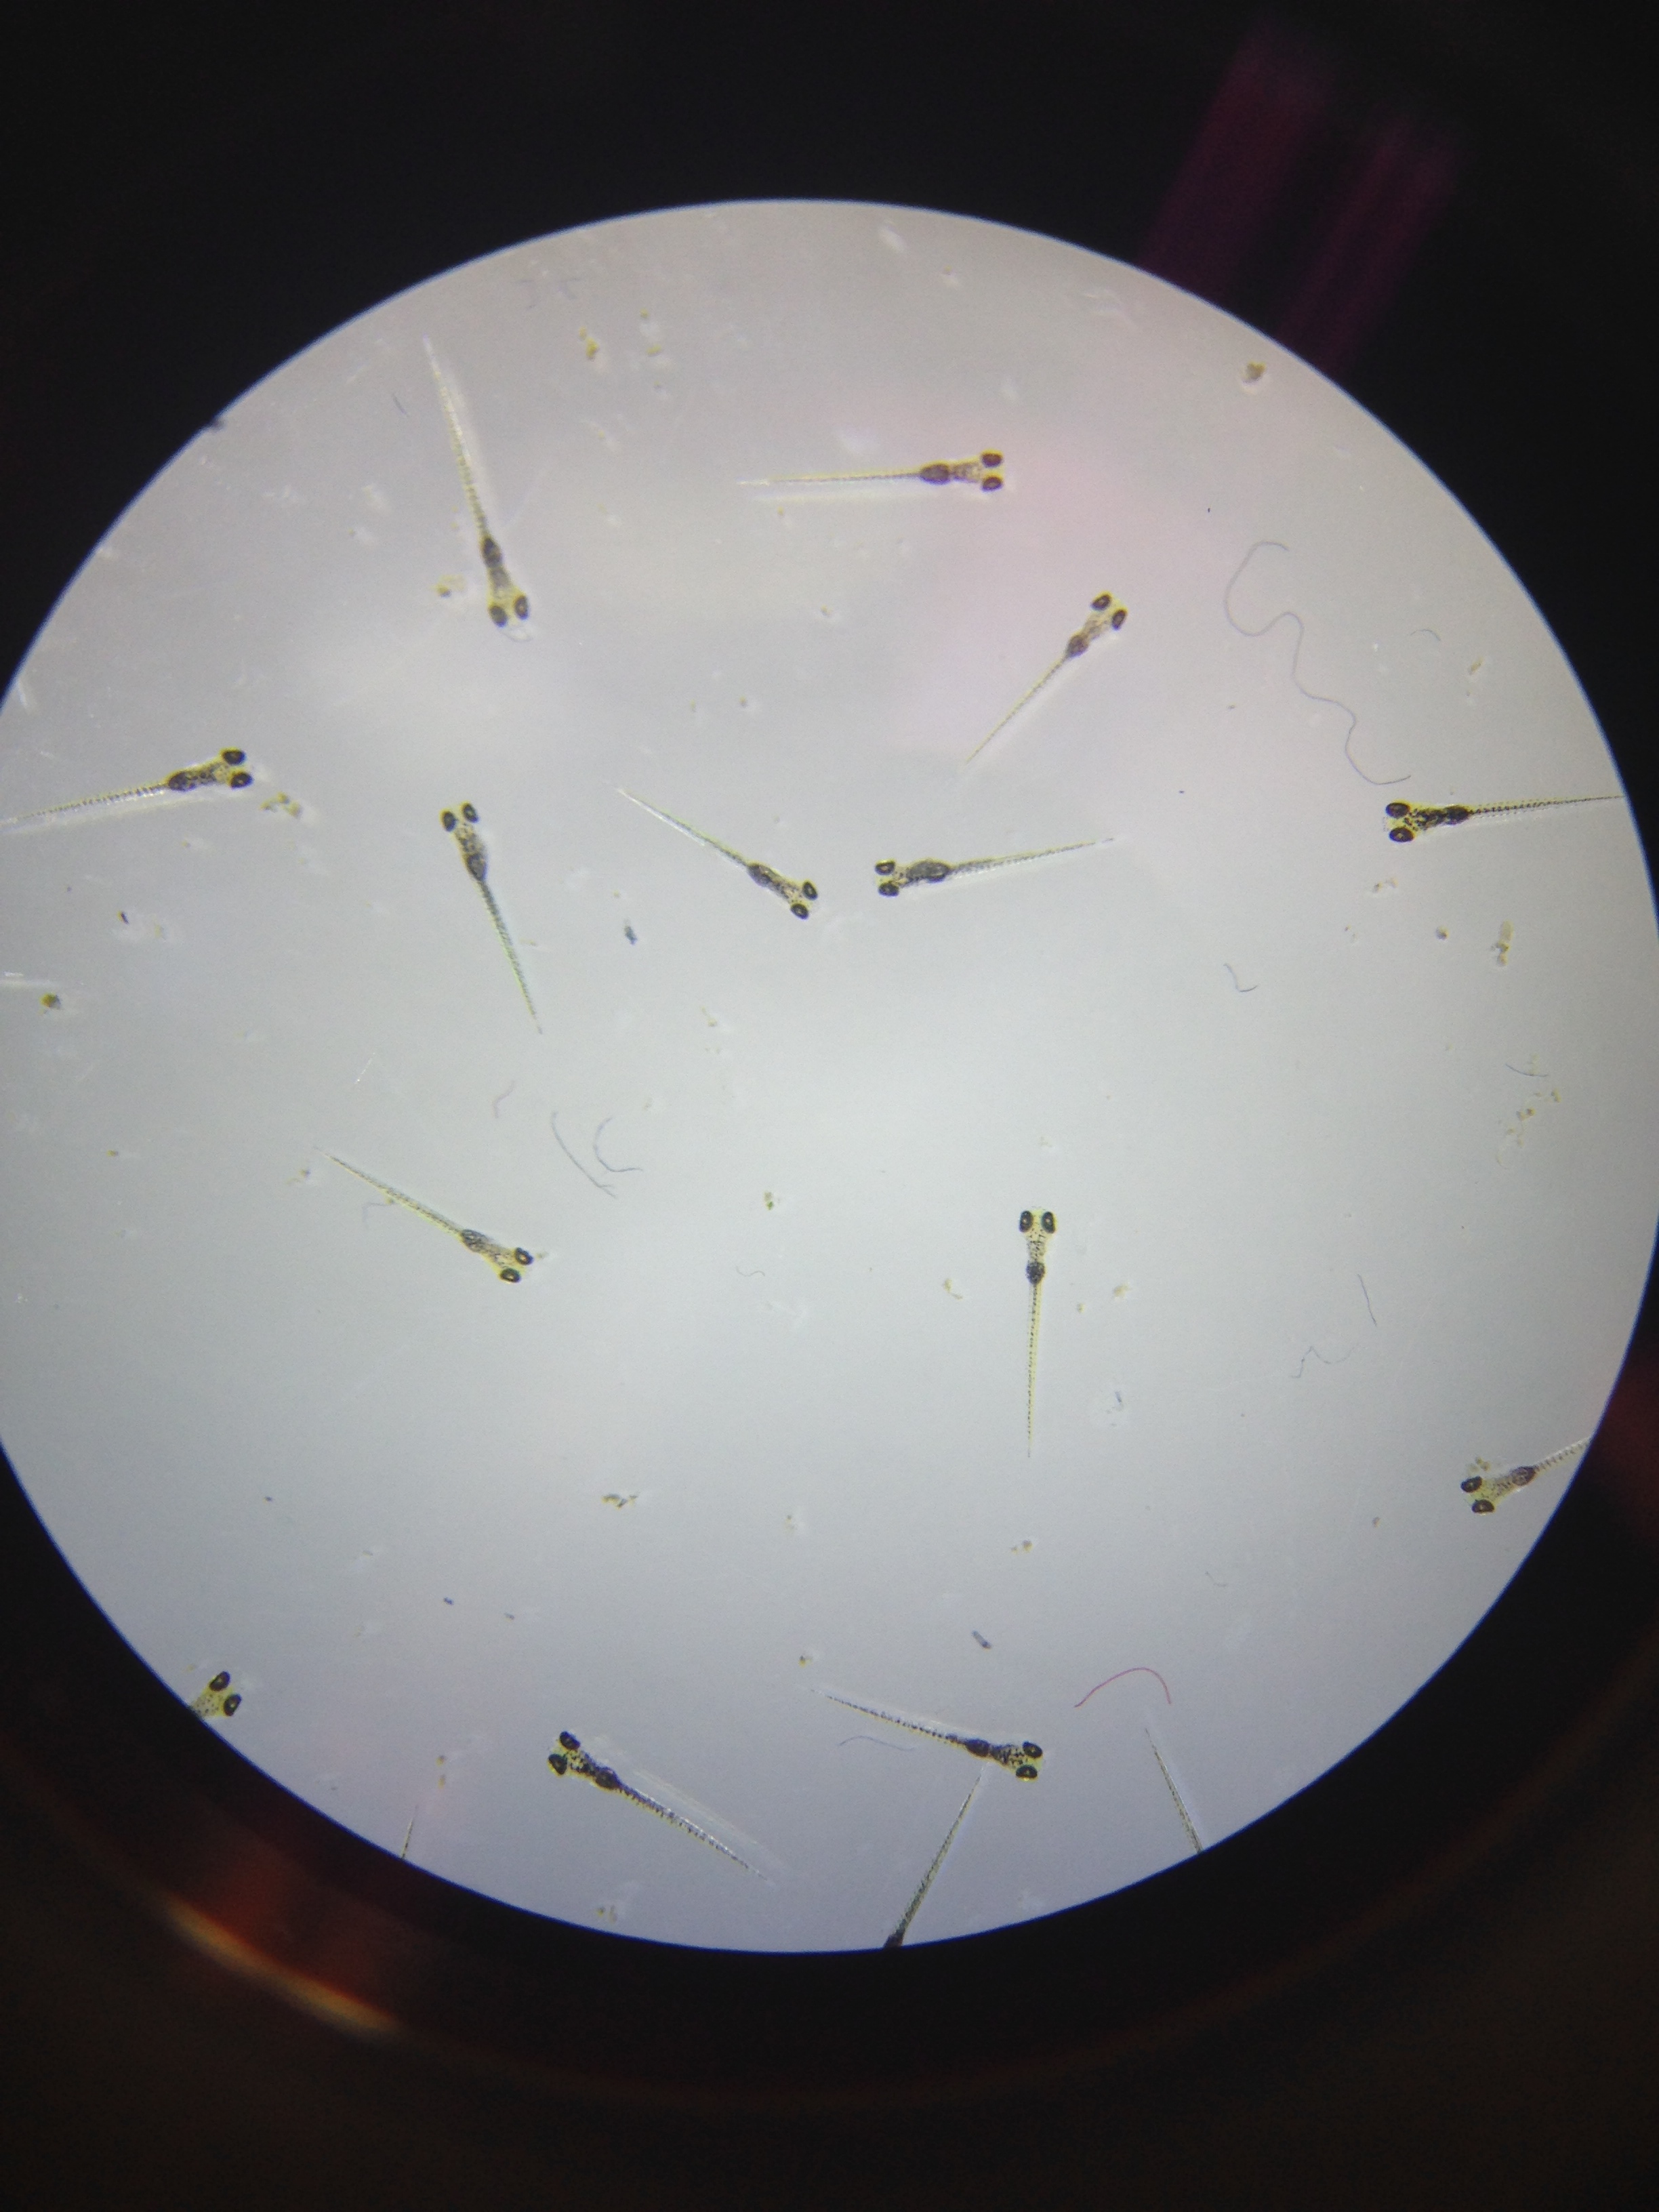 Fig 8. Zebra fish observed in 12.5 ml concentration of nicotine
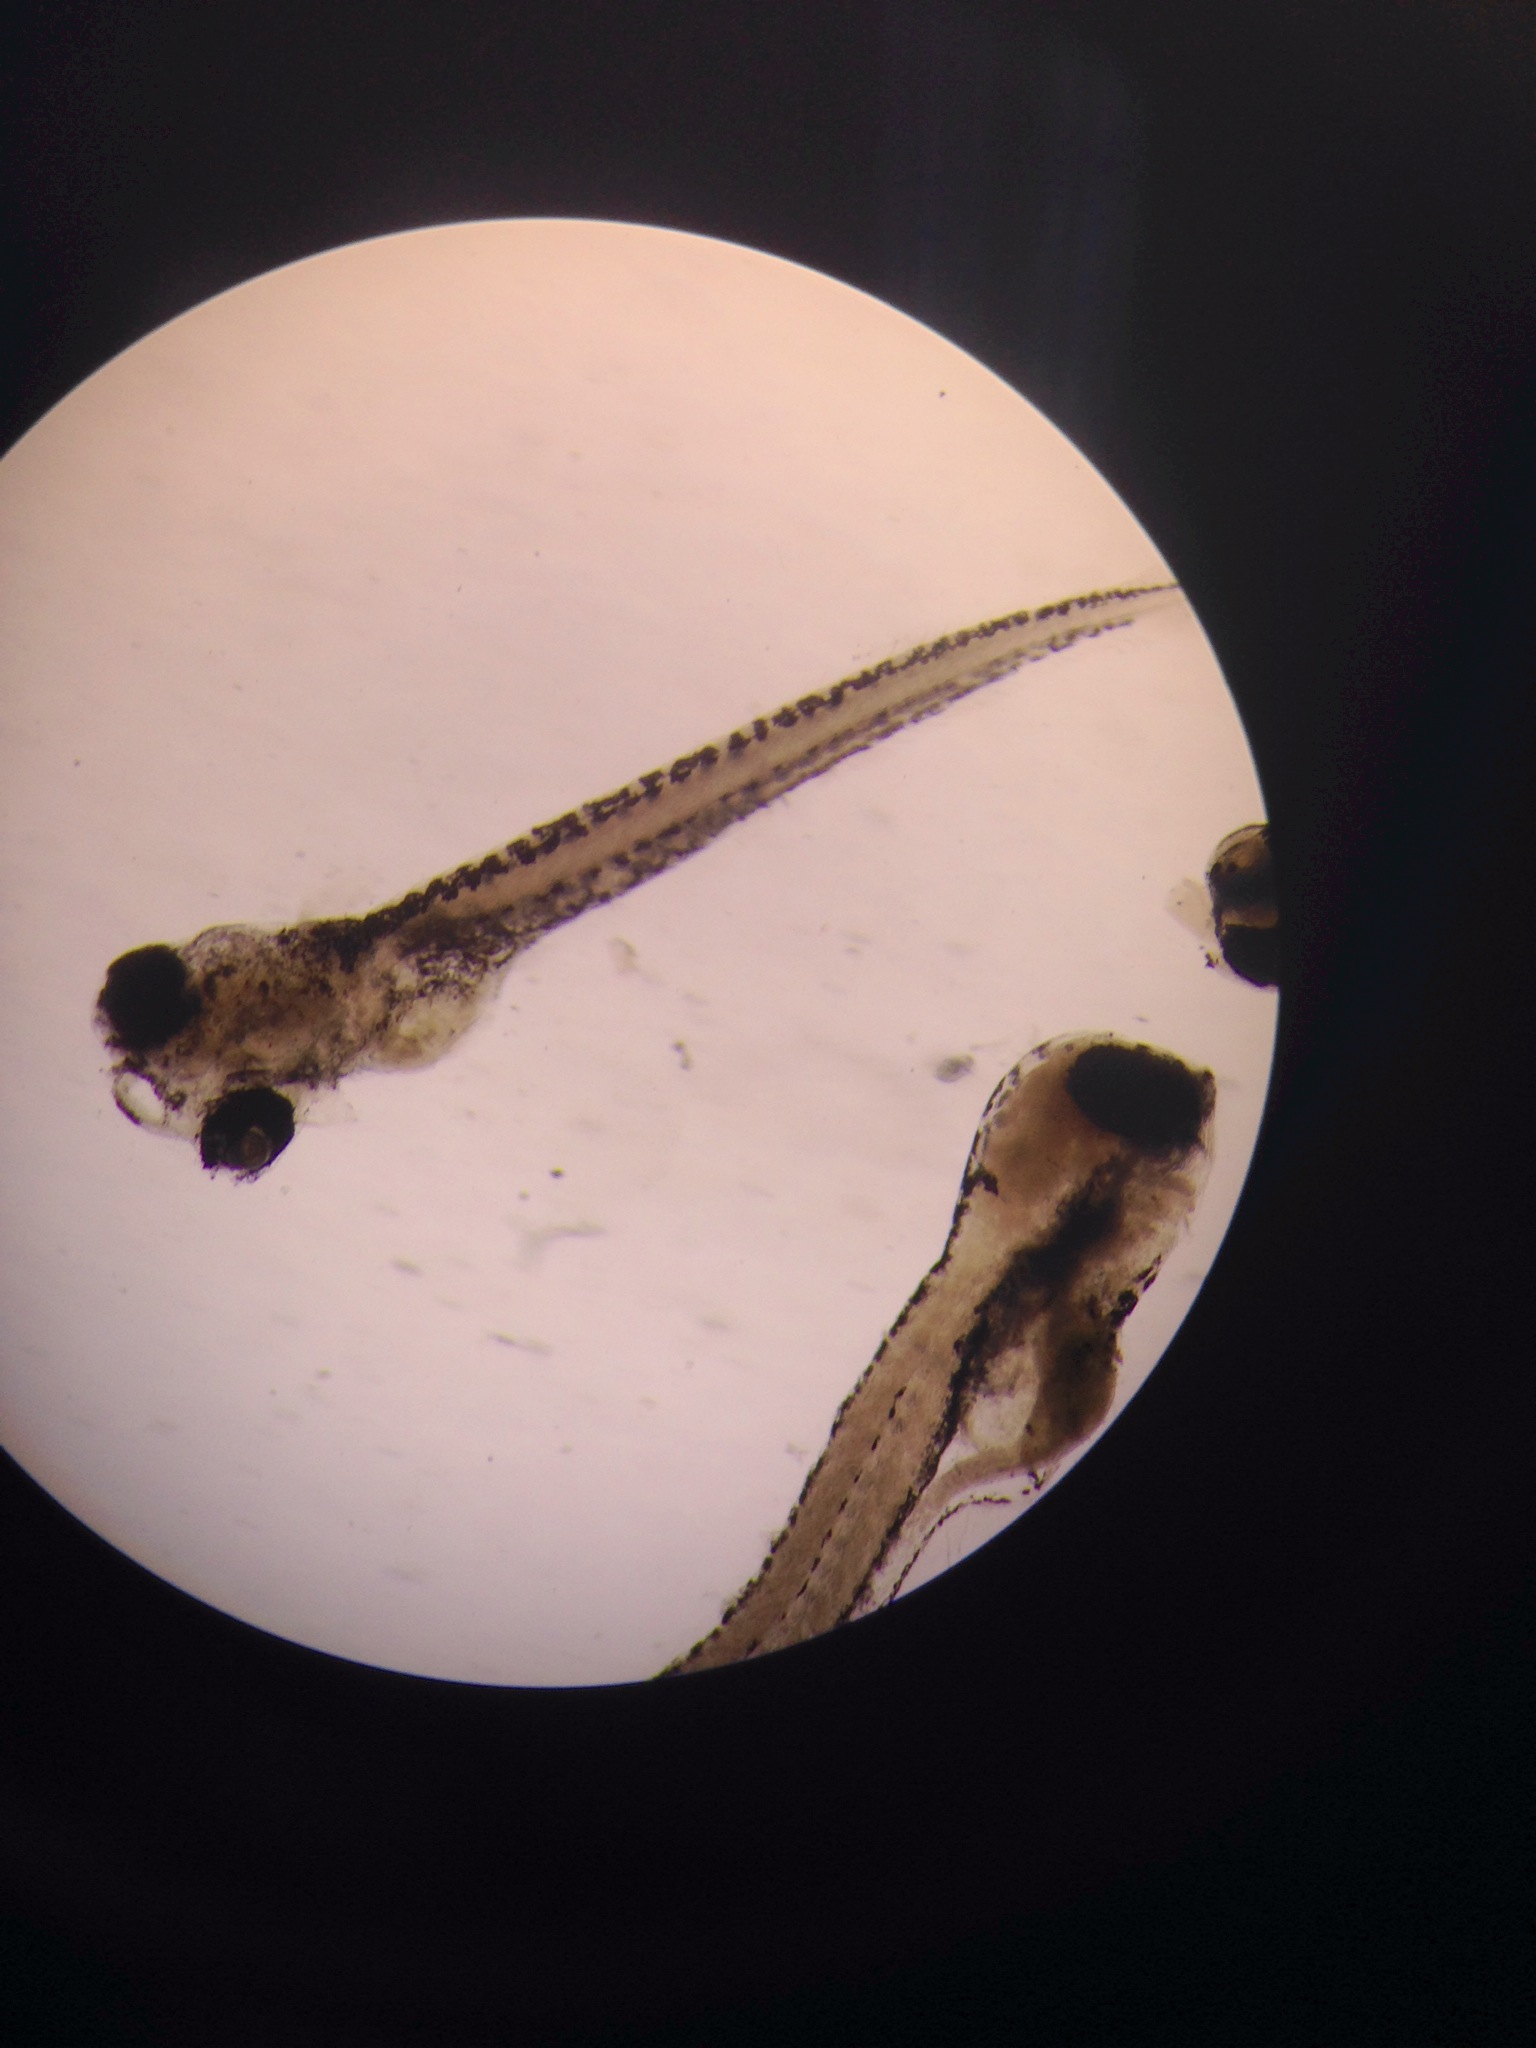 Fig 9. The deformed hatchling seen from the 25ml concentration of nicotine
Conclusion:
While the study was unable to be completed entirely it still provided valuable insight in embryo development. Comparing the control group to the other two concentrations of nicotine might have shown significant differences had the study continued, however within the 15 days of observations there were notable differences in each group’s development. In this way the study was sill able to mimic parts of the results found in a study conducted by Beatrice Parker and Victoria P. Connaughton in their own study of the same nature. Numerous physiological changes and behavioral changes were observed during the course of the experiment, based off the data found in this lab, more comprehensive knowledge can be applied for other studies involving nicotine and embryo development.
- Nii Mills 11:02, 26 March 2014 (EDT):
Lab 5 Lab conduct on Feb. 12, 2014 Lab notebook written on Feb. 23, 2014
Introduction: In Biological Life of AU Lab 5, the observed invertebrates to understand their importance and how these simple organisms evolved with more complex systems. This was possible by using invertebrates collected from Berlese Funnel used previously in lab 4 as well as invertebrates already prepared for slide use.
Materials & Methods: This lab including a Berlese Funnel as well as the ethanol/water solution used to preserve invertebrates thought to be hiding among the collected plant litter collected from each lab groups distinguished transect. Other material included live earthworms (planaria), as well as various other invertebrates used for the purposes of the lab purely to identify their characteristics and label based off these characteristics. A microscope was of course used as well for the duration of the lab.
Procedure I Observing Aceolomates, Pseudocoelomates, and Coelomates • Observe the acoelomate, planaria with a dissecting scope and observe its movements in regards to its simplistic nature. After look at the slides that contain cross-sectional slides of the Planaria with the microscope. Next observe the nematodes and slides of pseudocoelomate structure and consider this organism’s movement as well. Lastly observe the coelmate, Annelida, and look at its internal organs layers of muscle
Procedure II Analyzing Invertebrates Collected with the Burlese Funnel: • Take the preservative solution from tubes to collect under the Burlese Funnel and place that solution in a petri dish to be examined for invertebrates. Use a key to help identify these organism
Procedure III Vertebrates and Niches: • In the last part of the lab look at the vertebrates and identify five that may inhabit Transect #1. Then determine the classification of each, starting, with the phylum through to the species. Next time describe the biotic and abiotic characteristics of the transect that would benefit each species. As a summary construct a food web based on the organisms observed in Transect #1.
Data Observations:
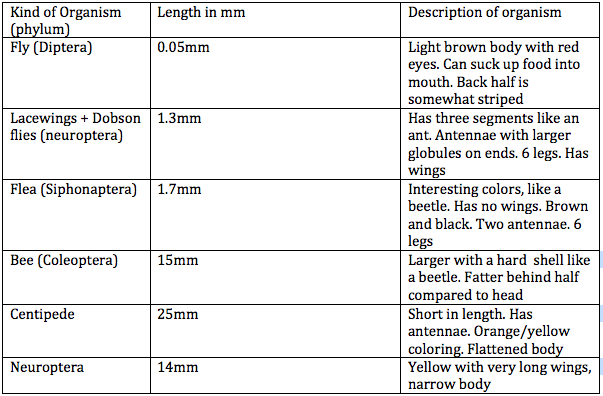 Figure 1: Table 1 Transect #1 Invertebrates
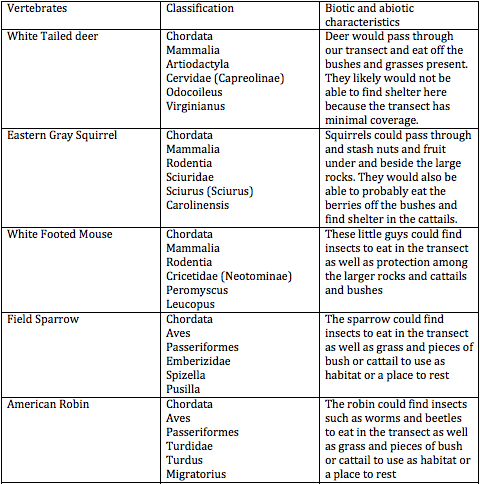 Figure 2: Table 2 Vertebrates likely found in Transect #1
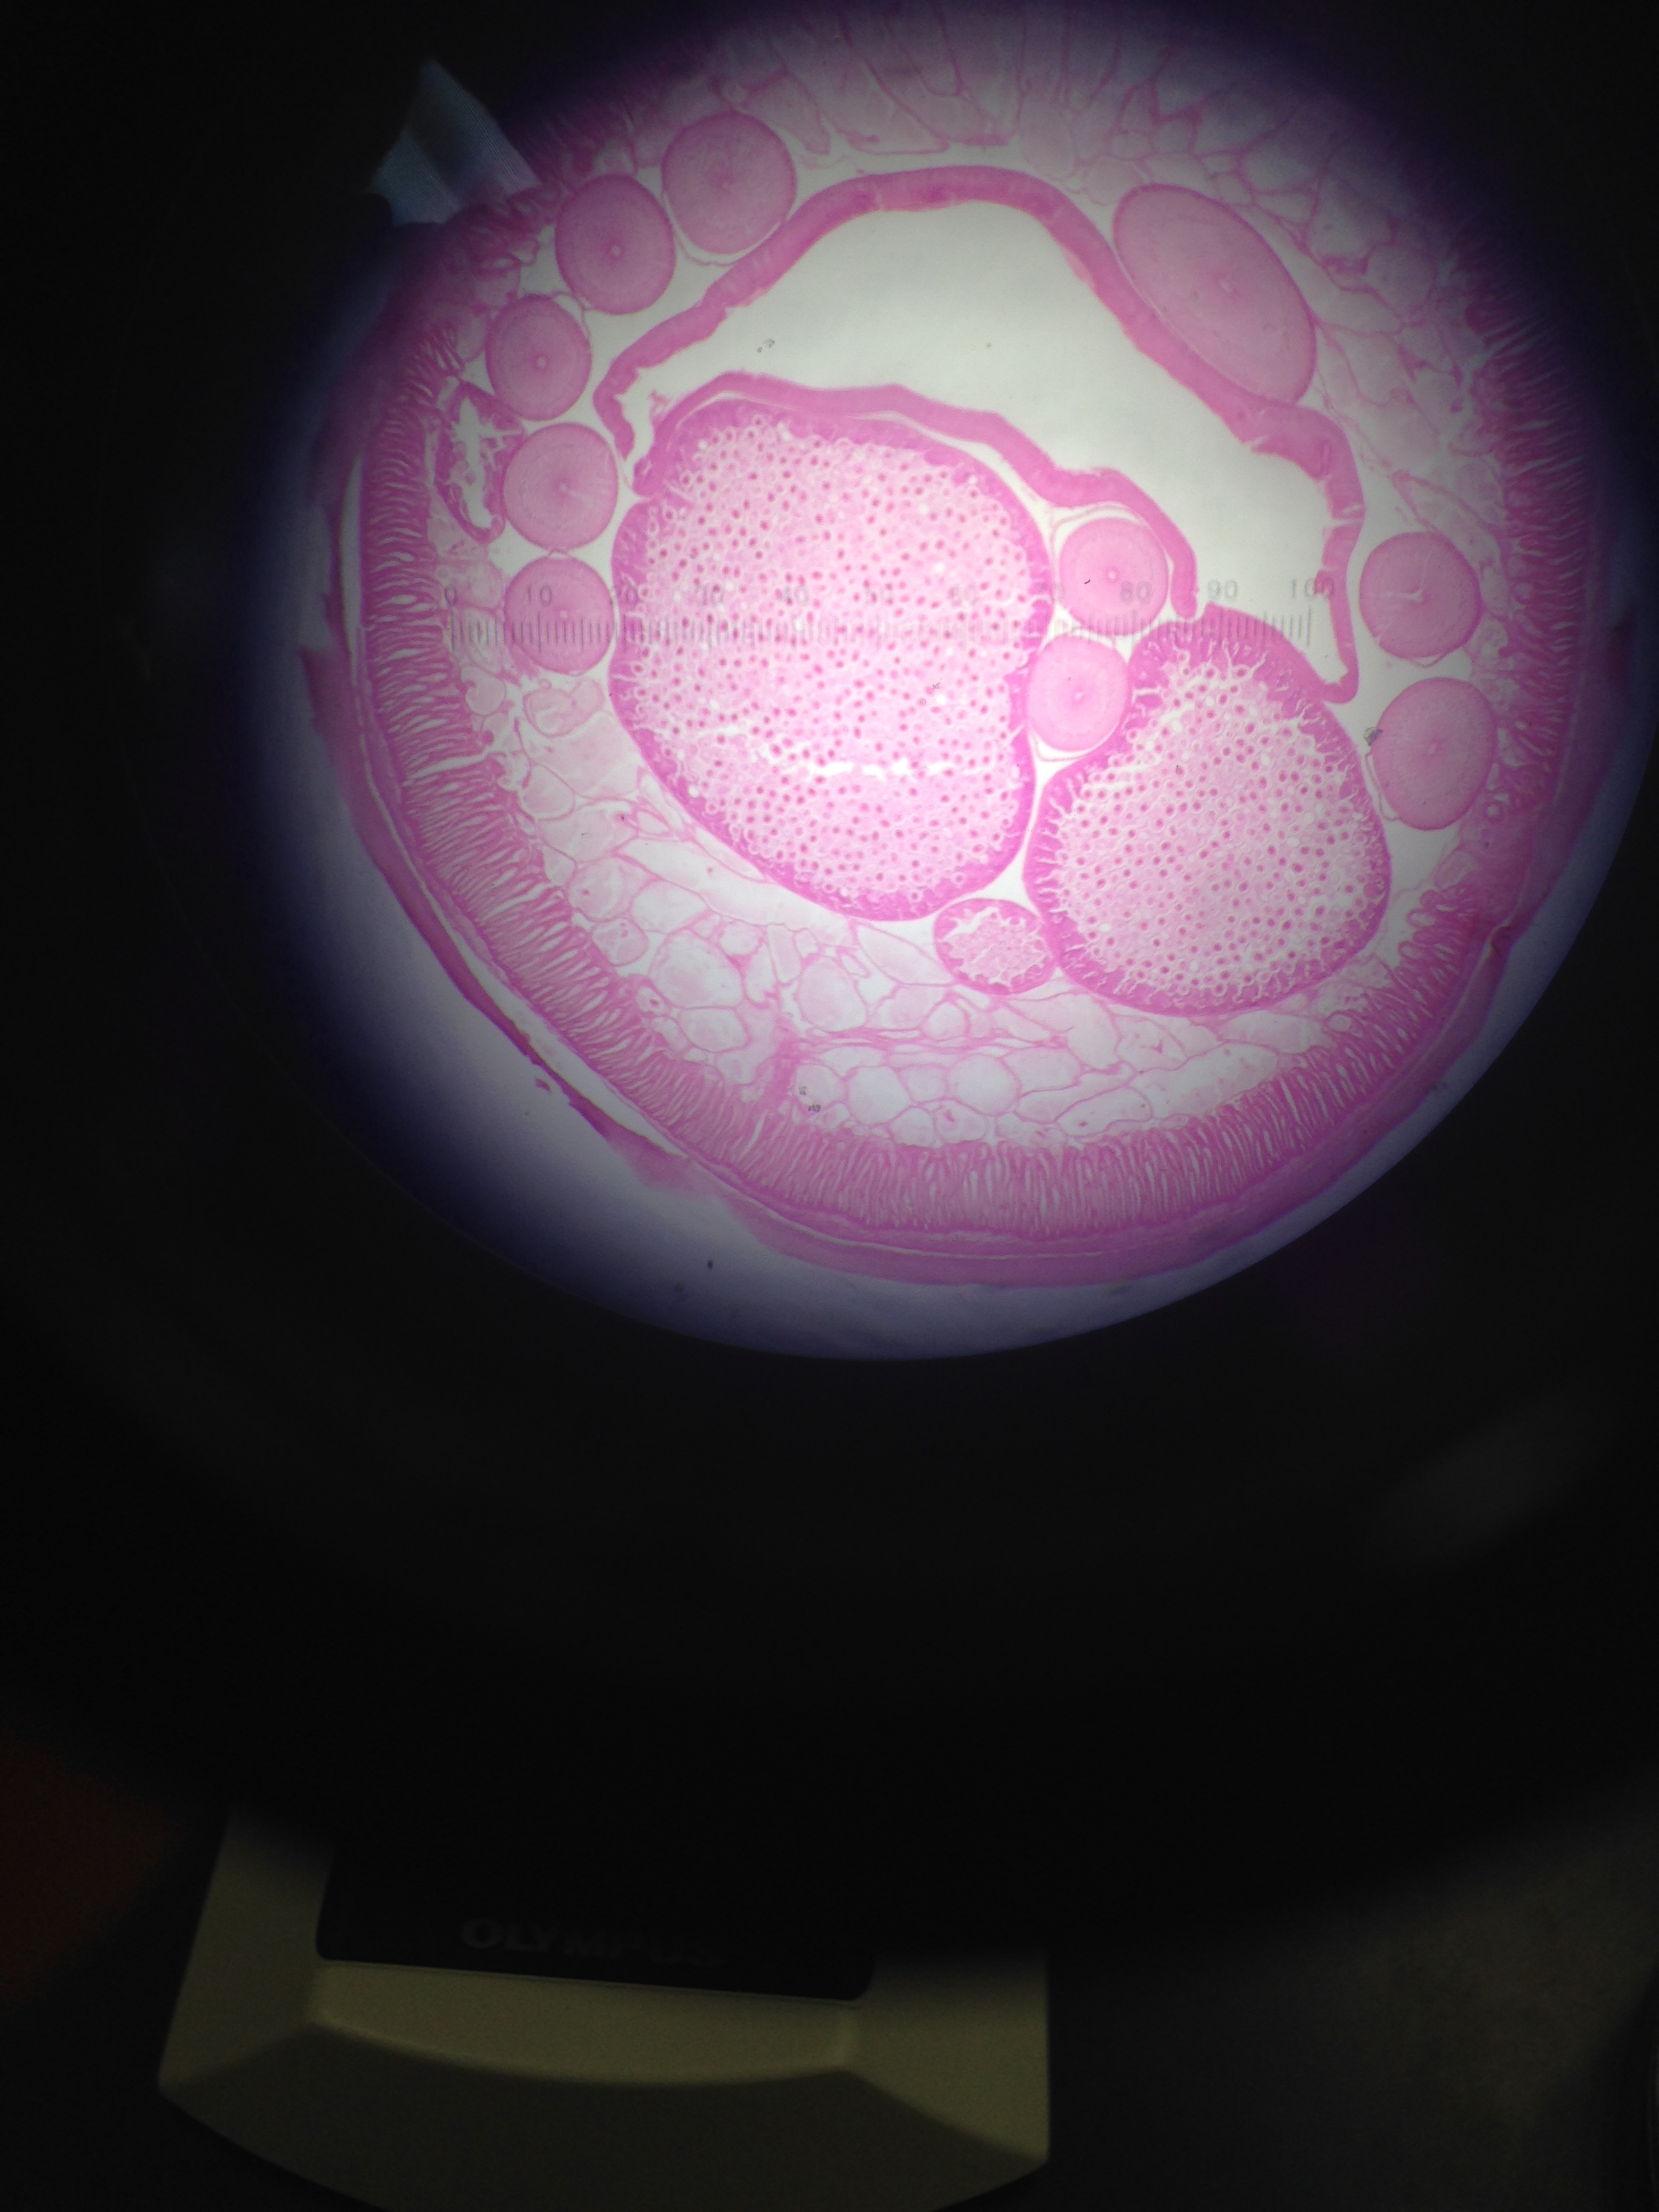 Figure 3: This figure shows the cross sectional slide of their pseudocoelomate structure
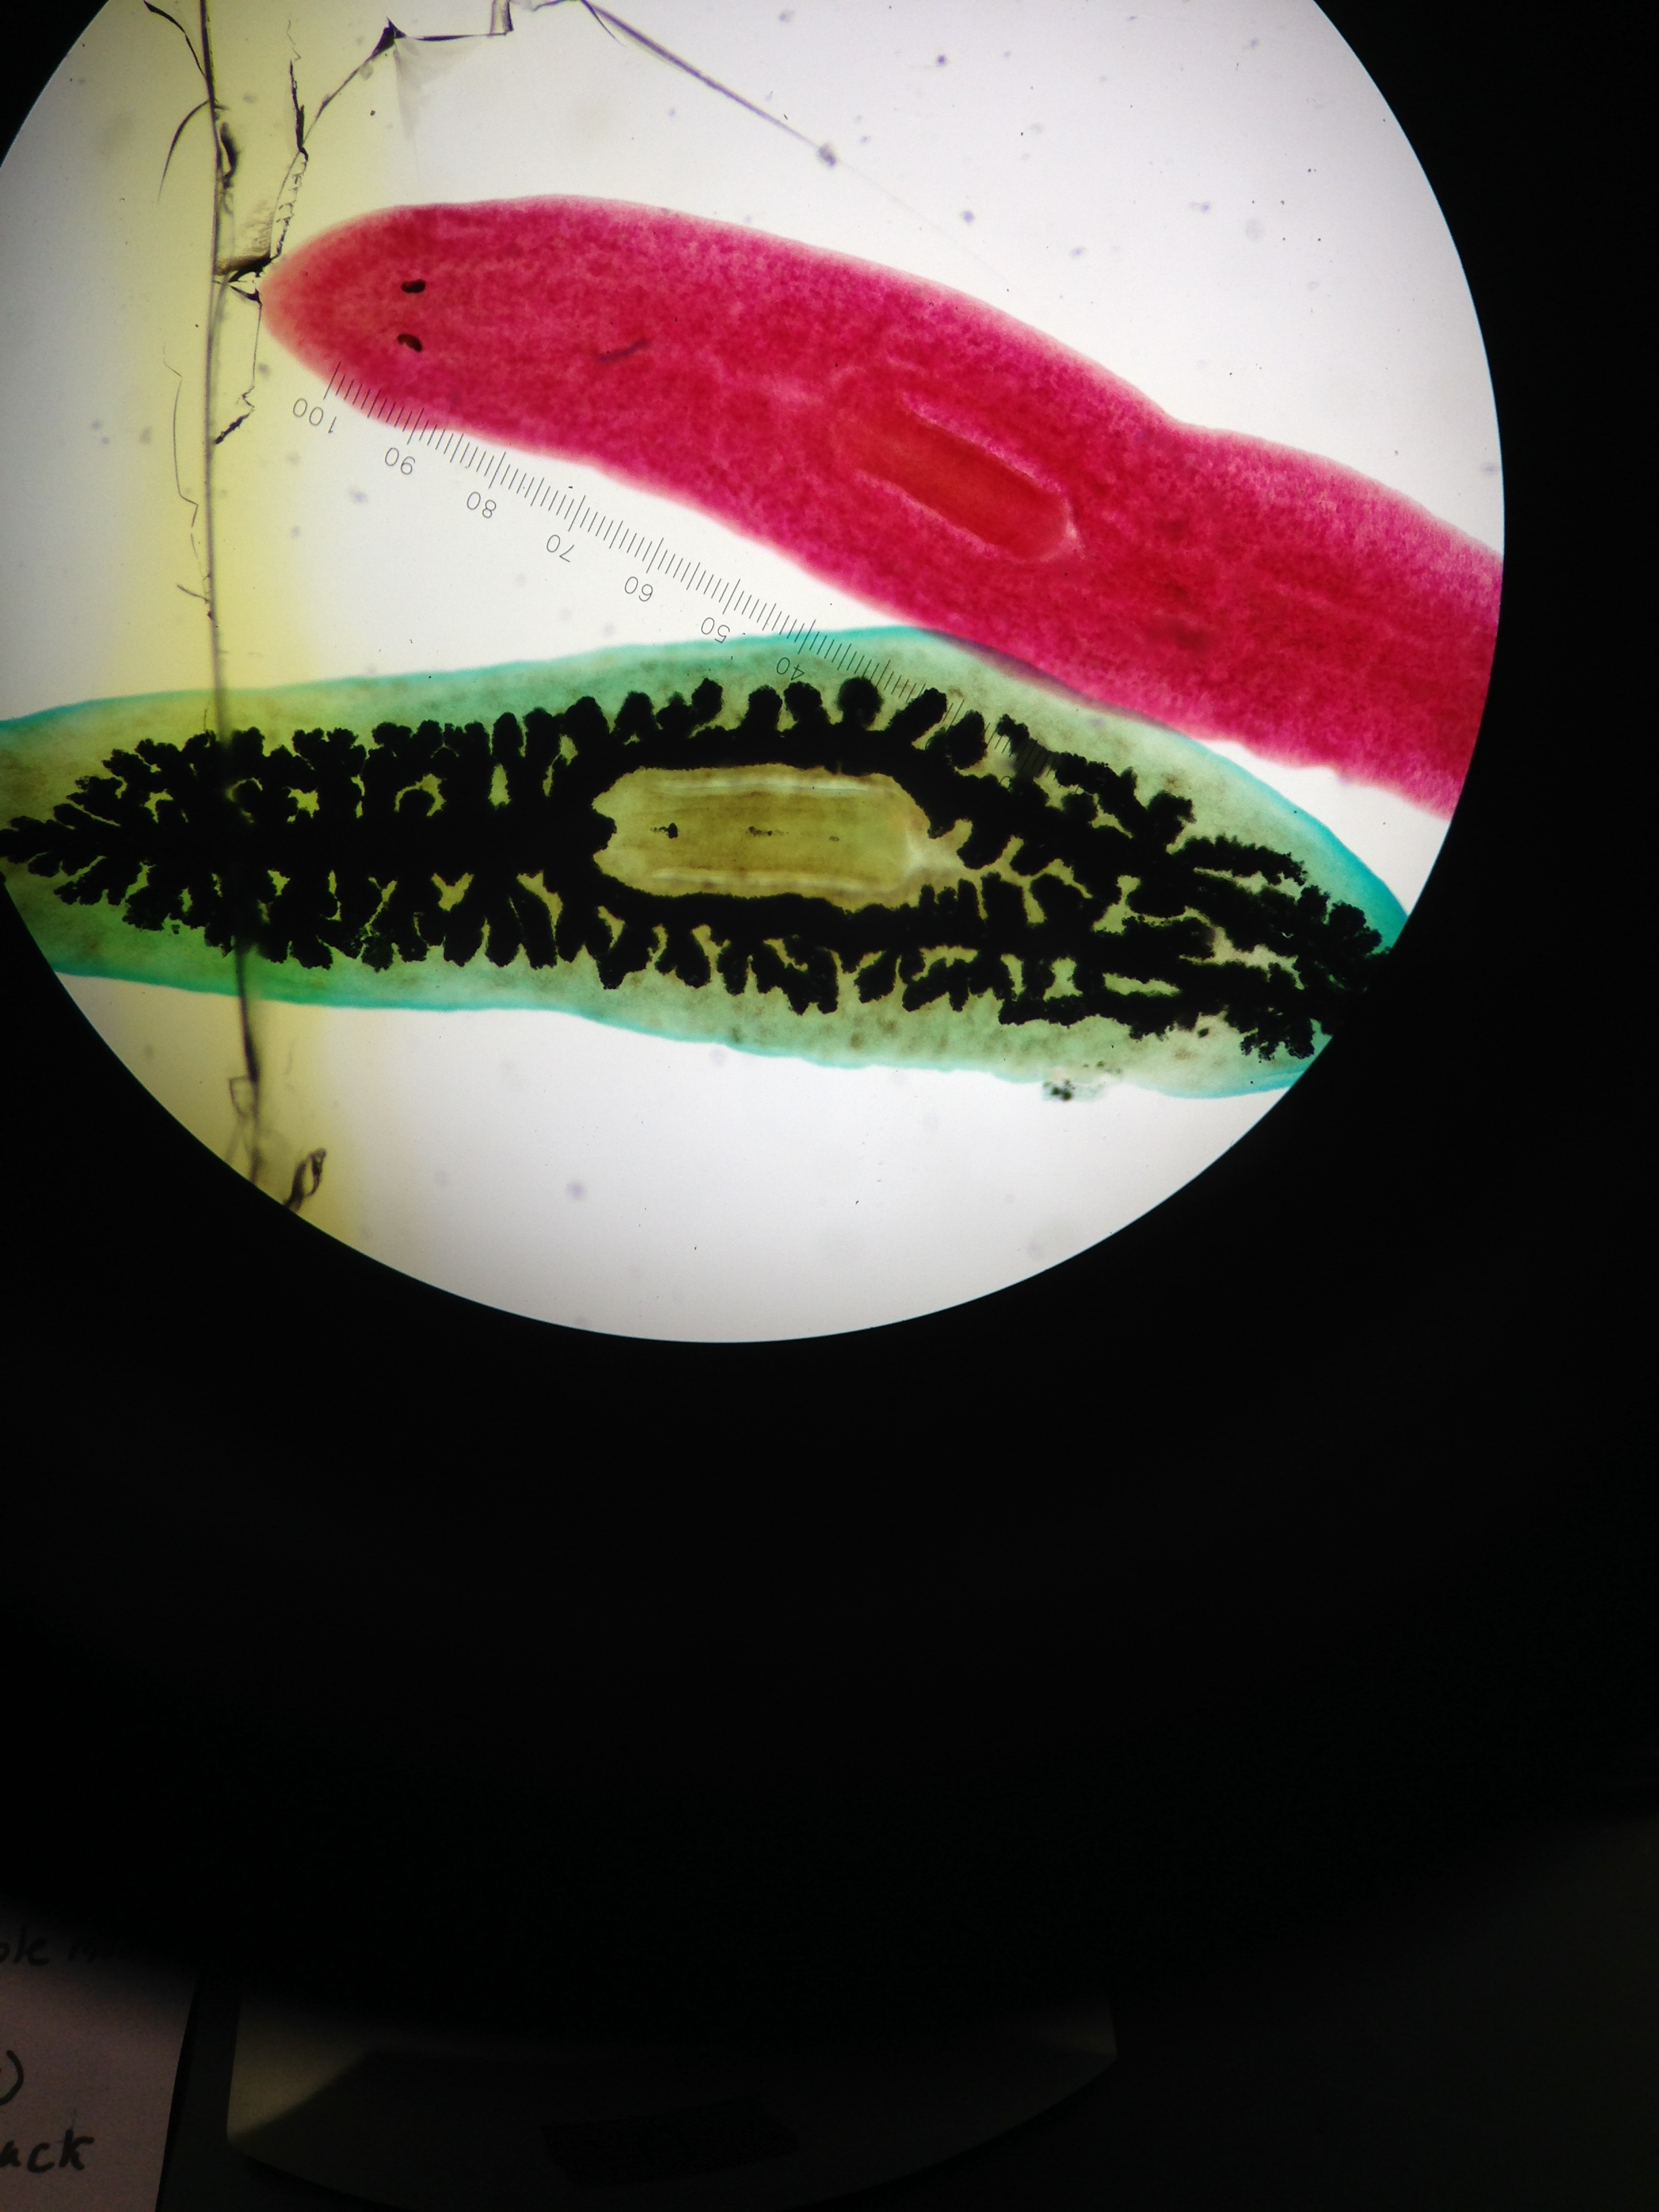 Figure 4: This figure shows the planaria stained red and the digestive track as black
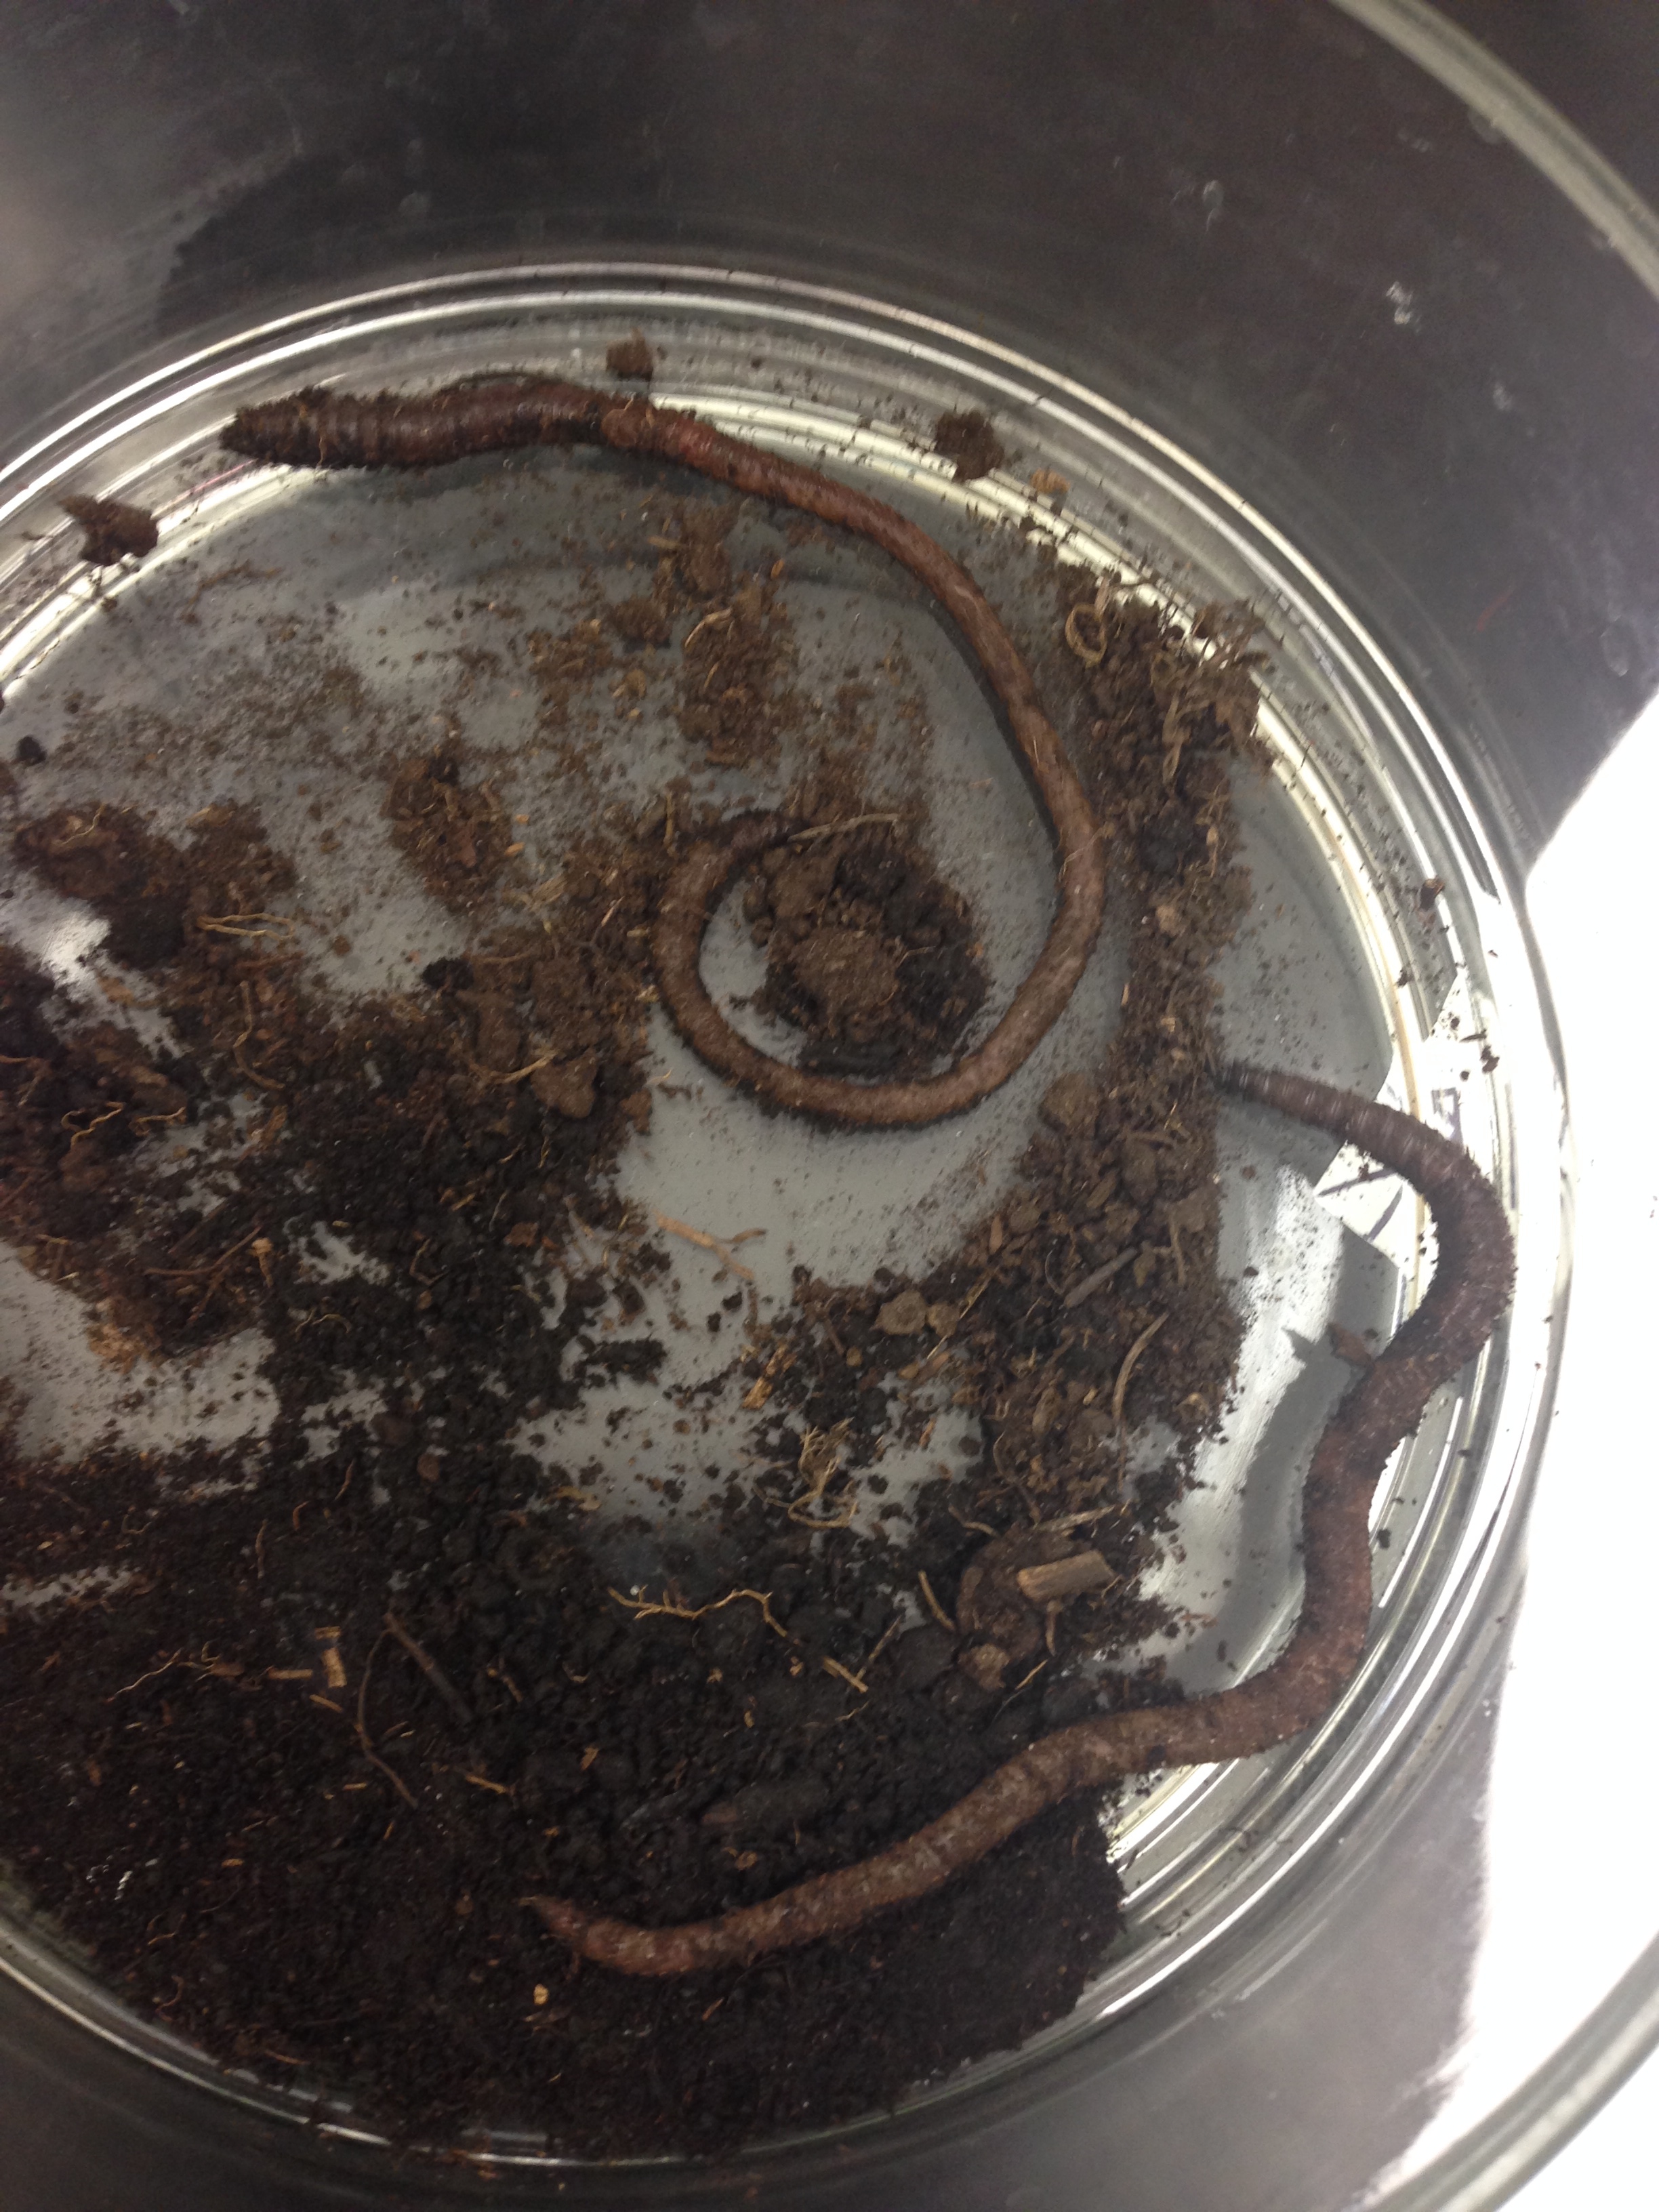 Figure 5: This figure shows the earthworms observed
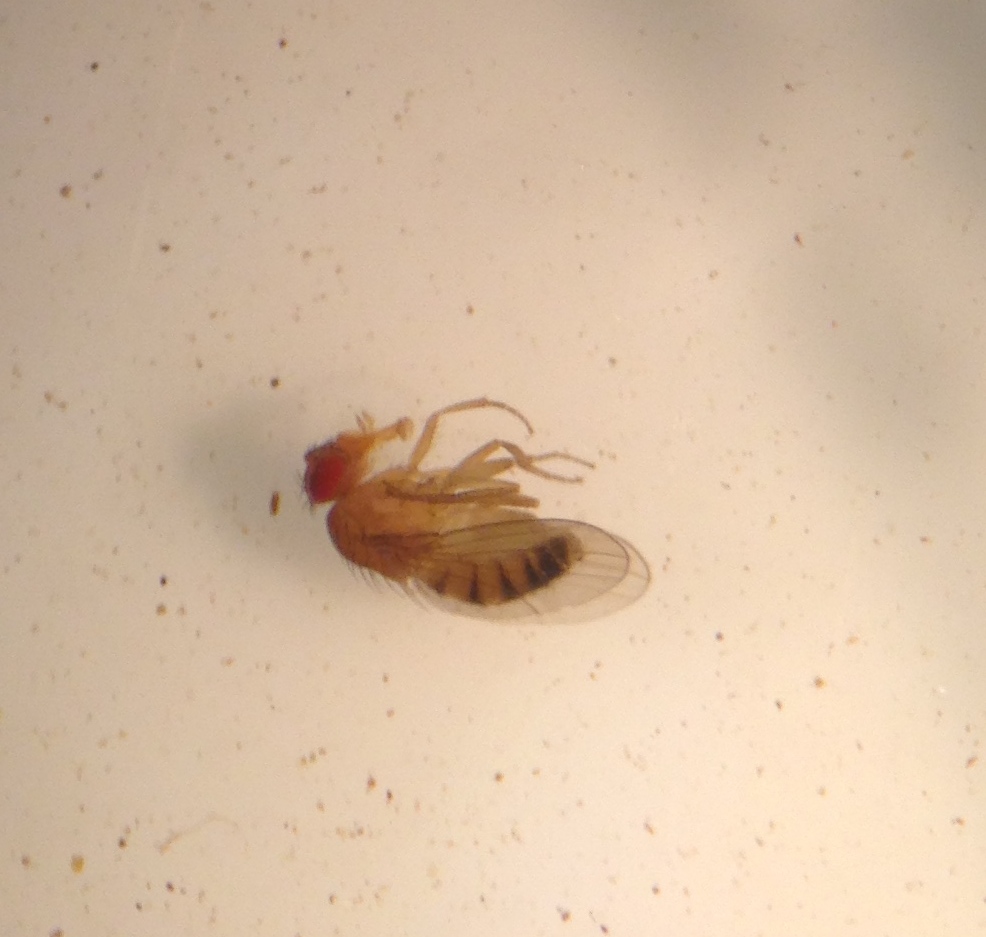 Figure 6: This figure shows the fly like invertebrate from the transect
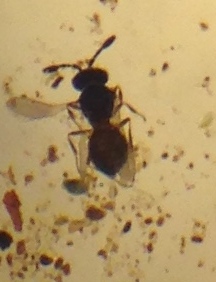 Figure 7: This figure shows the ant like invertebrate from the transect
Conclusion: By the end of the lab, our group has learned the evolutionary possibilities of invertebrates and their complexity as well as their sheer numbers outnumber more than the billions. Invertebrates are significant to our environment but also to our transect.
- Nii Mills 04:12, 19 March 2014 (EDT):
Lab 4 Lab conducted on Feb. 05, 2014 Lab notebook written on Feb 23, 2014
Introduction: In Biological Life of AU Lab 4, the class identified the characteristics of plant evolution by observing various plant samples that included Bryophote moss, Mnium, Lilium, as well as five plant samples from transect #1 used in previous labs. In particular features such as vascularization, specialized structures, and reproduction were specifically observed for indications of evolutionary progression.
Materials & Methods: A collection of samples from Transect #1 was taken with my lab partner to fully encompass the diverse plant life available in that particular niche. There was not a lot of plant life but was present including grass, leaves, cattails, bushes, and various weeds. While collecting the samples, our lab group also collected clumps of leaf and grass from the ground level of our Transect to be later used to create a Berlese Funnel, which would collect invertebrates possibly hidden among the plant material to be preserved in a alcohol solution. These invertebrates would be used in Lab 5. Materials also included a Tiger Lilly and a clump of moss that were used to observe the different parts of plant and it’s specialized structures used for specific living functions. One other material used during the lab was fungi, called black mold, fond usually on decaying bread fibers, this was observed under a microscope to note the spores, rhizoid, and hyphae.
Procedure I Collecting Plant Samples from Transect 1: • We used three bags to collect plant samples from Transect 1. After we had arrived at the location of our niche, my partner and I dug into the top layer of soil and to gather some of the ground layer of dead leaves, soft soil, and grass. We filled about an entire bag of this plant matter, estimating the size to be about 500g of litter. This bag would be used to create the Berlese Funnel for collecting invertebrates for next week’s lab. After that bag had been filled then came collected five samples of plant material that represented the Transect #1 at best in its diversity.
Procedure II Plant Vascularaztion: • Compare samples of moss with the stem of the angiosperm, lily to see how structures like vascular tissue, xylem, and phloem allow for the transport of water and nutrients throughout the plant
Procedure III Plant Specialization: • Look at the shape, size, and cluster arrangement of leaves seen from the transect #1 plants. If no leaves are present instead examine the. This examination is primarily a chance to look for and see the cuticle of a leaf and specialized cells in the plant’s leaf that allow for the exchanging of gasses and permit the loss of water vapor.
Procedure IV Plant Reproduction: • In this part of the lab study the diagram of bryophyte reproductive cycle. Examine the moss, Polytrichum. Identify the male and female gametophyte and sporophyte, as well as note the parts of the life cycle that are haploid and diploid. Next dissect a lily flower sporophyte and identify its anther, stigma, and style. The soaking seeds brought from transect 1 should also be dissected and its parts identified. These seeds should be recognized as either monocot or dicot. Procedure V Observing Fungi: • Agar plates containing fungal organisms were saved from microbiology experiment look at these samples under a dissecting microscope and decide if they are fungi and if so what in which of the three groups of fungi do they belong to. Draw a picture of the findings and explanation your decision for its classification.
Procedure VI Creating a Berlese Funnel for the Collection of Invertebrates : • To create the funnel, pour about 25 ml of 50:50 ethanol/water solution into a flask or bottle. Then fit a piece of screening material into the bottom of the funnel and have the sides of the screen taped so that the leaf matter does not fall in the preservative. Afterwards place the tunnel into the neck of the square-sided bottle. Put the leaf litter sample in the top of the funnel and place a lighted 40 watt lamp above the funnel the incandescent bulb about 1-2 inches from the top of the leaf litter. Finally cover everything with foil and leave the set up alone for a week.
Data & Observations: • The five plant samples collected from transect #1 was grass, maple leaf, cattail, branch from a bush, and weeds. • The grass strands were collected as clumps of short, narrow leaves as one leaf was a representative of the entire plant. The maple leaf was most likely a product of maple tree that had shed it foliage due to the winter months. The maple leaf was relatively the size of hand and included its stem. There were not leaves collected from the cattail, but instead a bulbous appendage at the end of a narrow long stalk was collected. This stalk is in fact the leaf of the cattail and it similar to grass in appearance. The weed (broad leaf plantain) we found be in similar conditions to grass, but was either just blooming or was already dying because of the winter air; the weed had five leaves opening from the center instead. The bush looked to have already shed its leaves when we had gotten there and those that were available to be seen were shriveled.
Figure 1. Table 1 Transect Plants (1-5)Describing Location and Properties
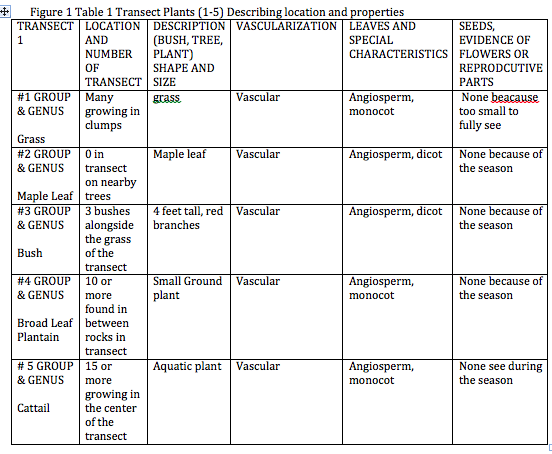
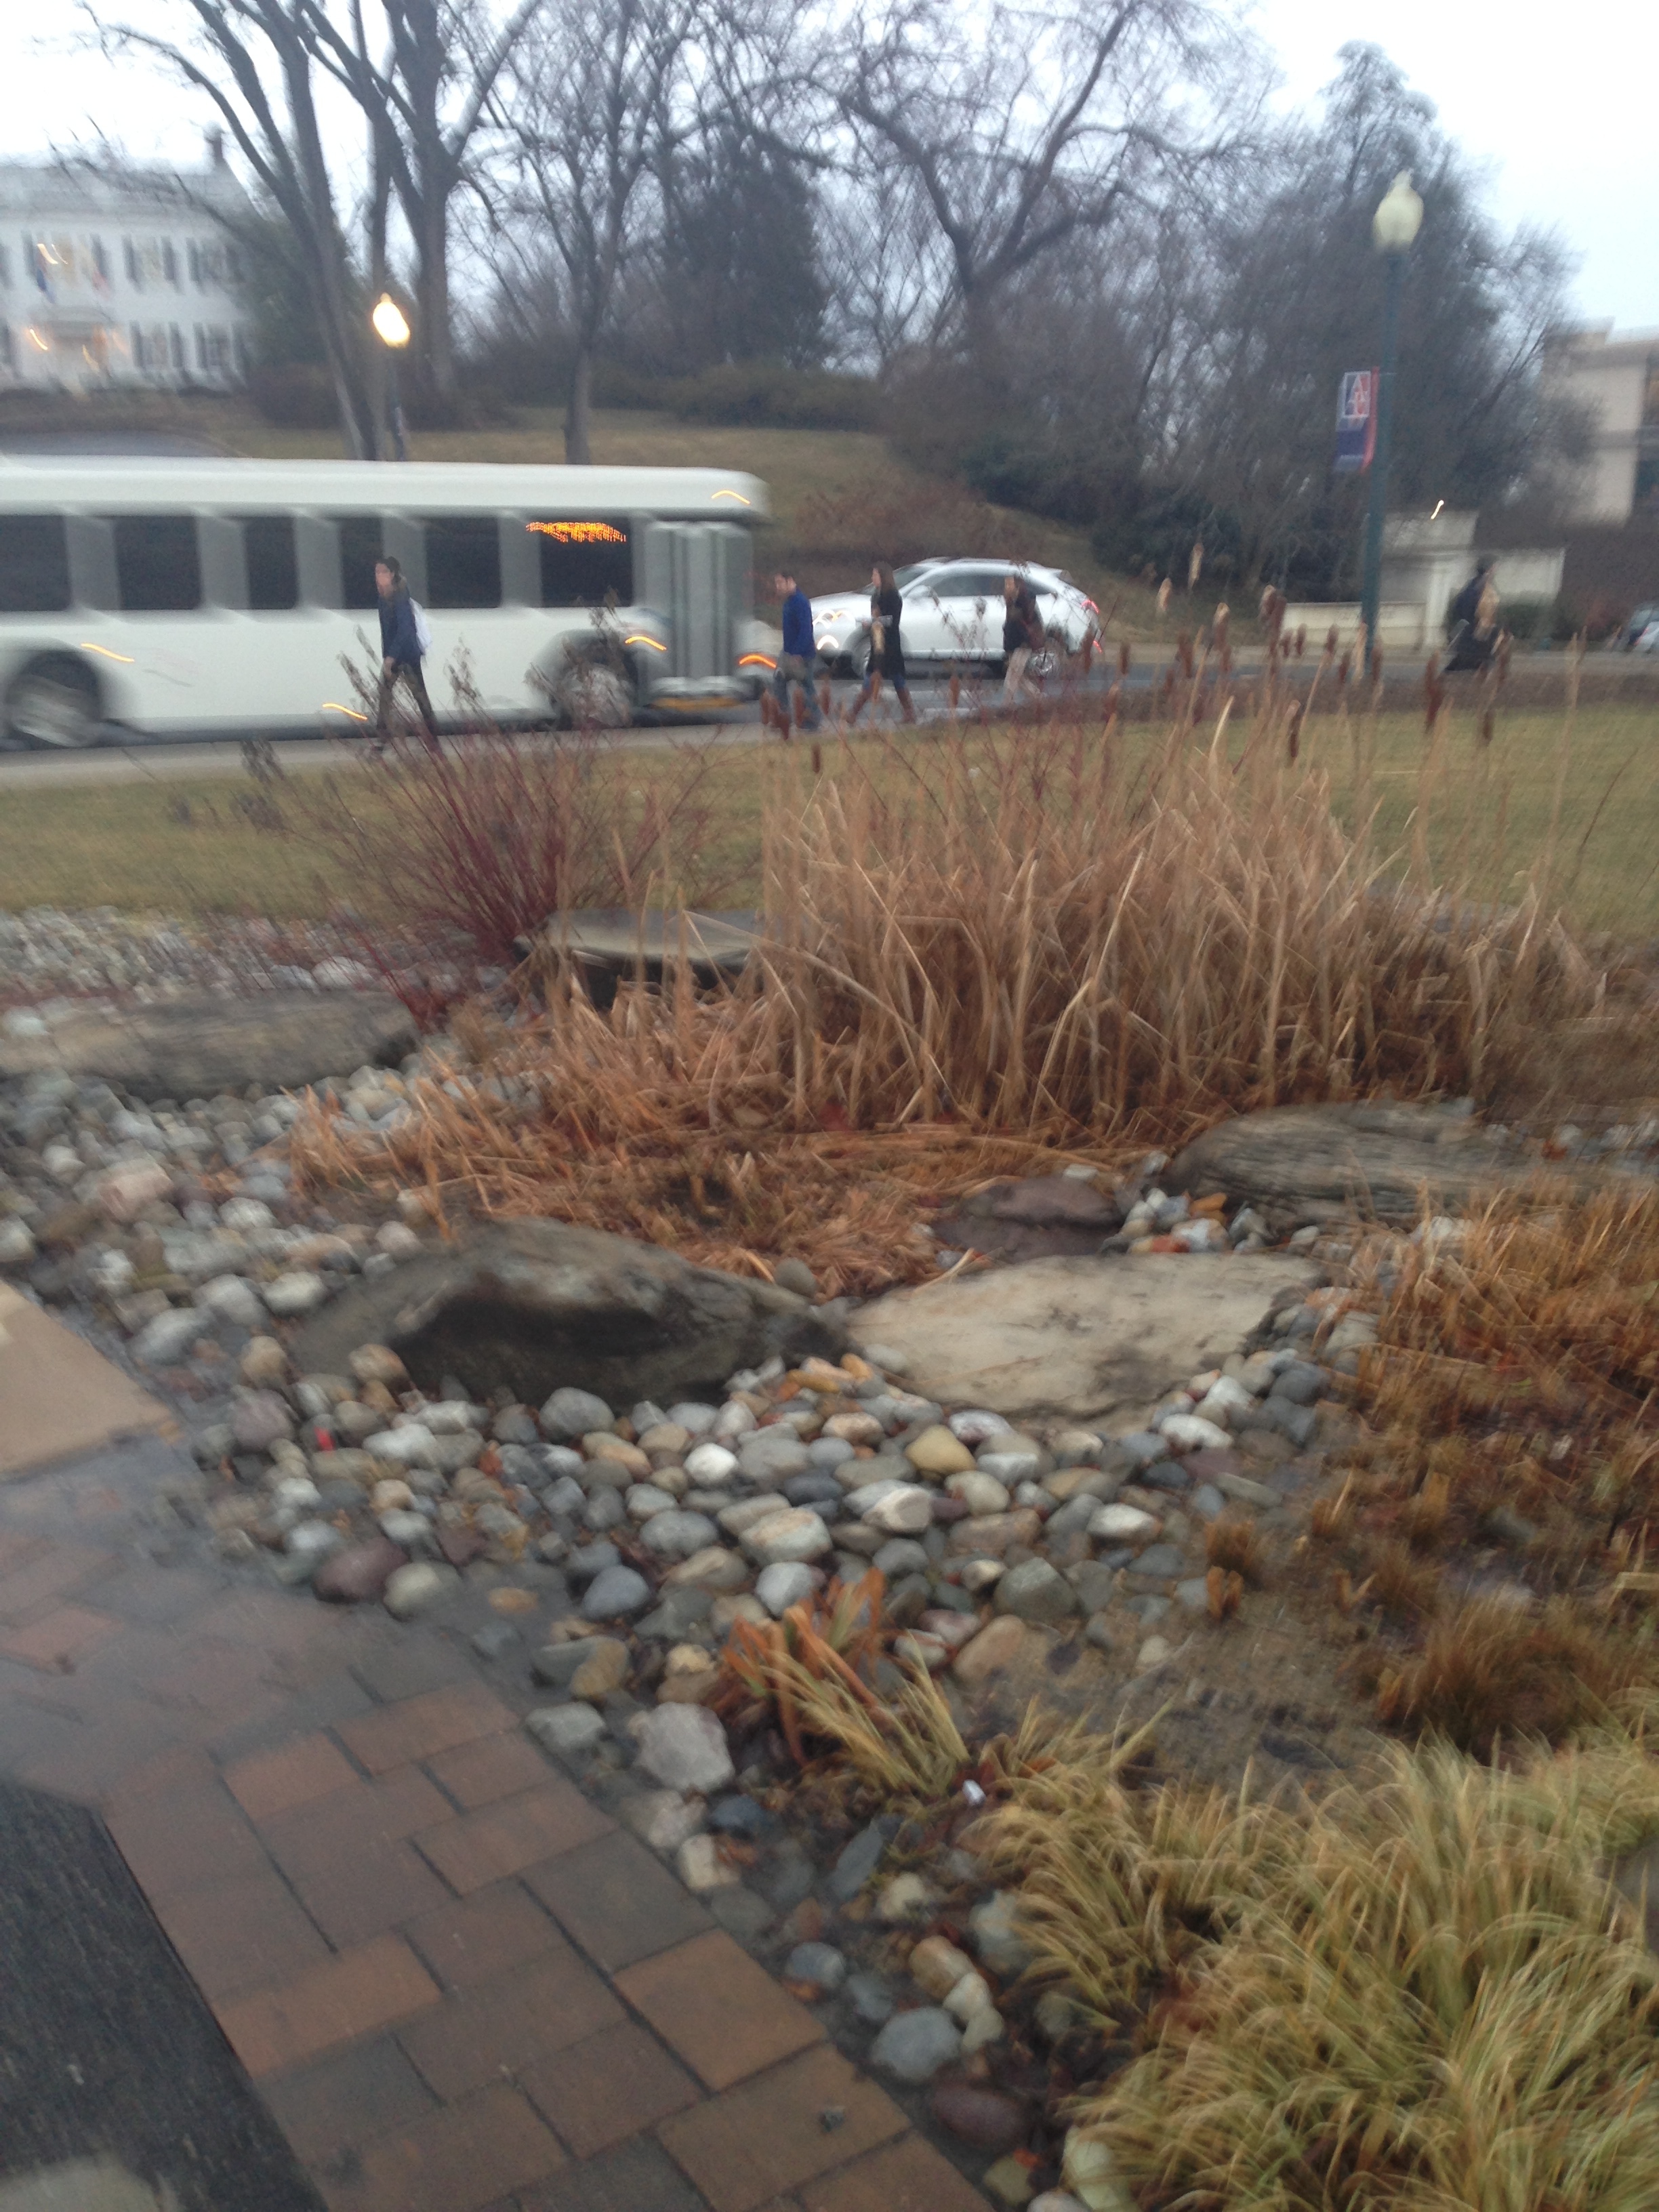 Figure 2. View of transect int he afternoon
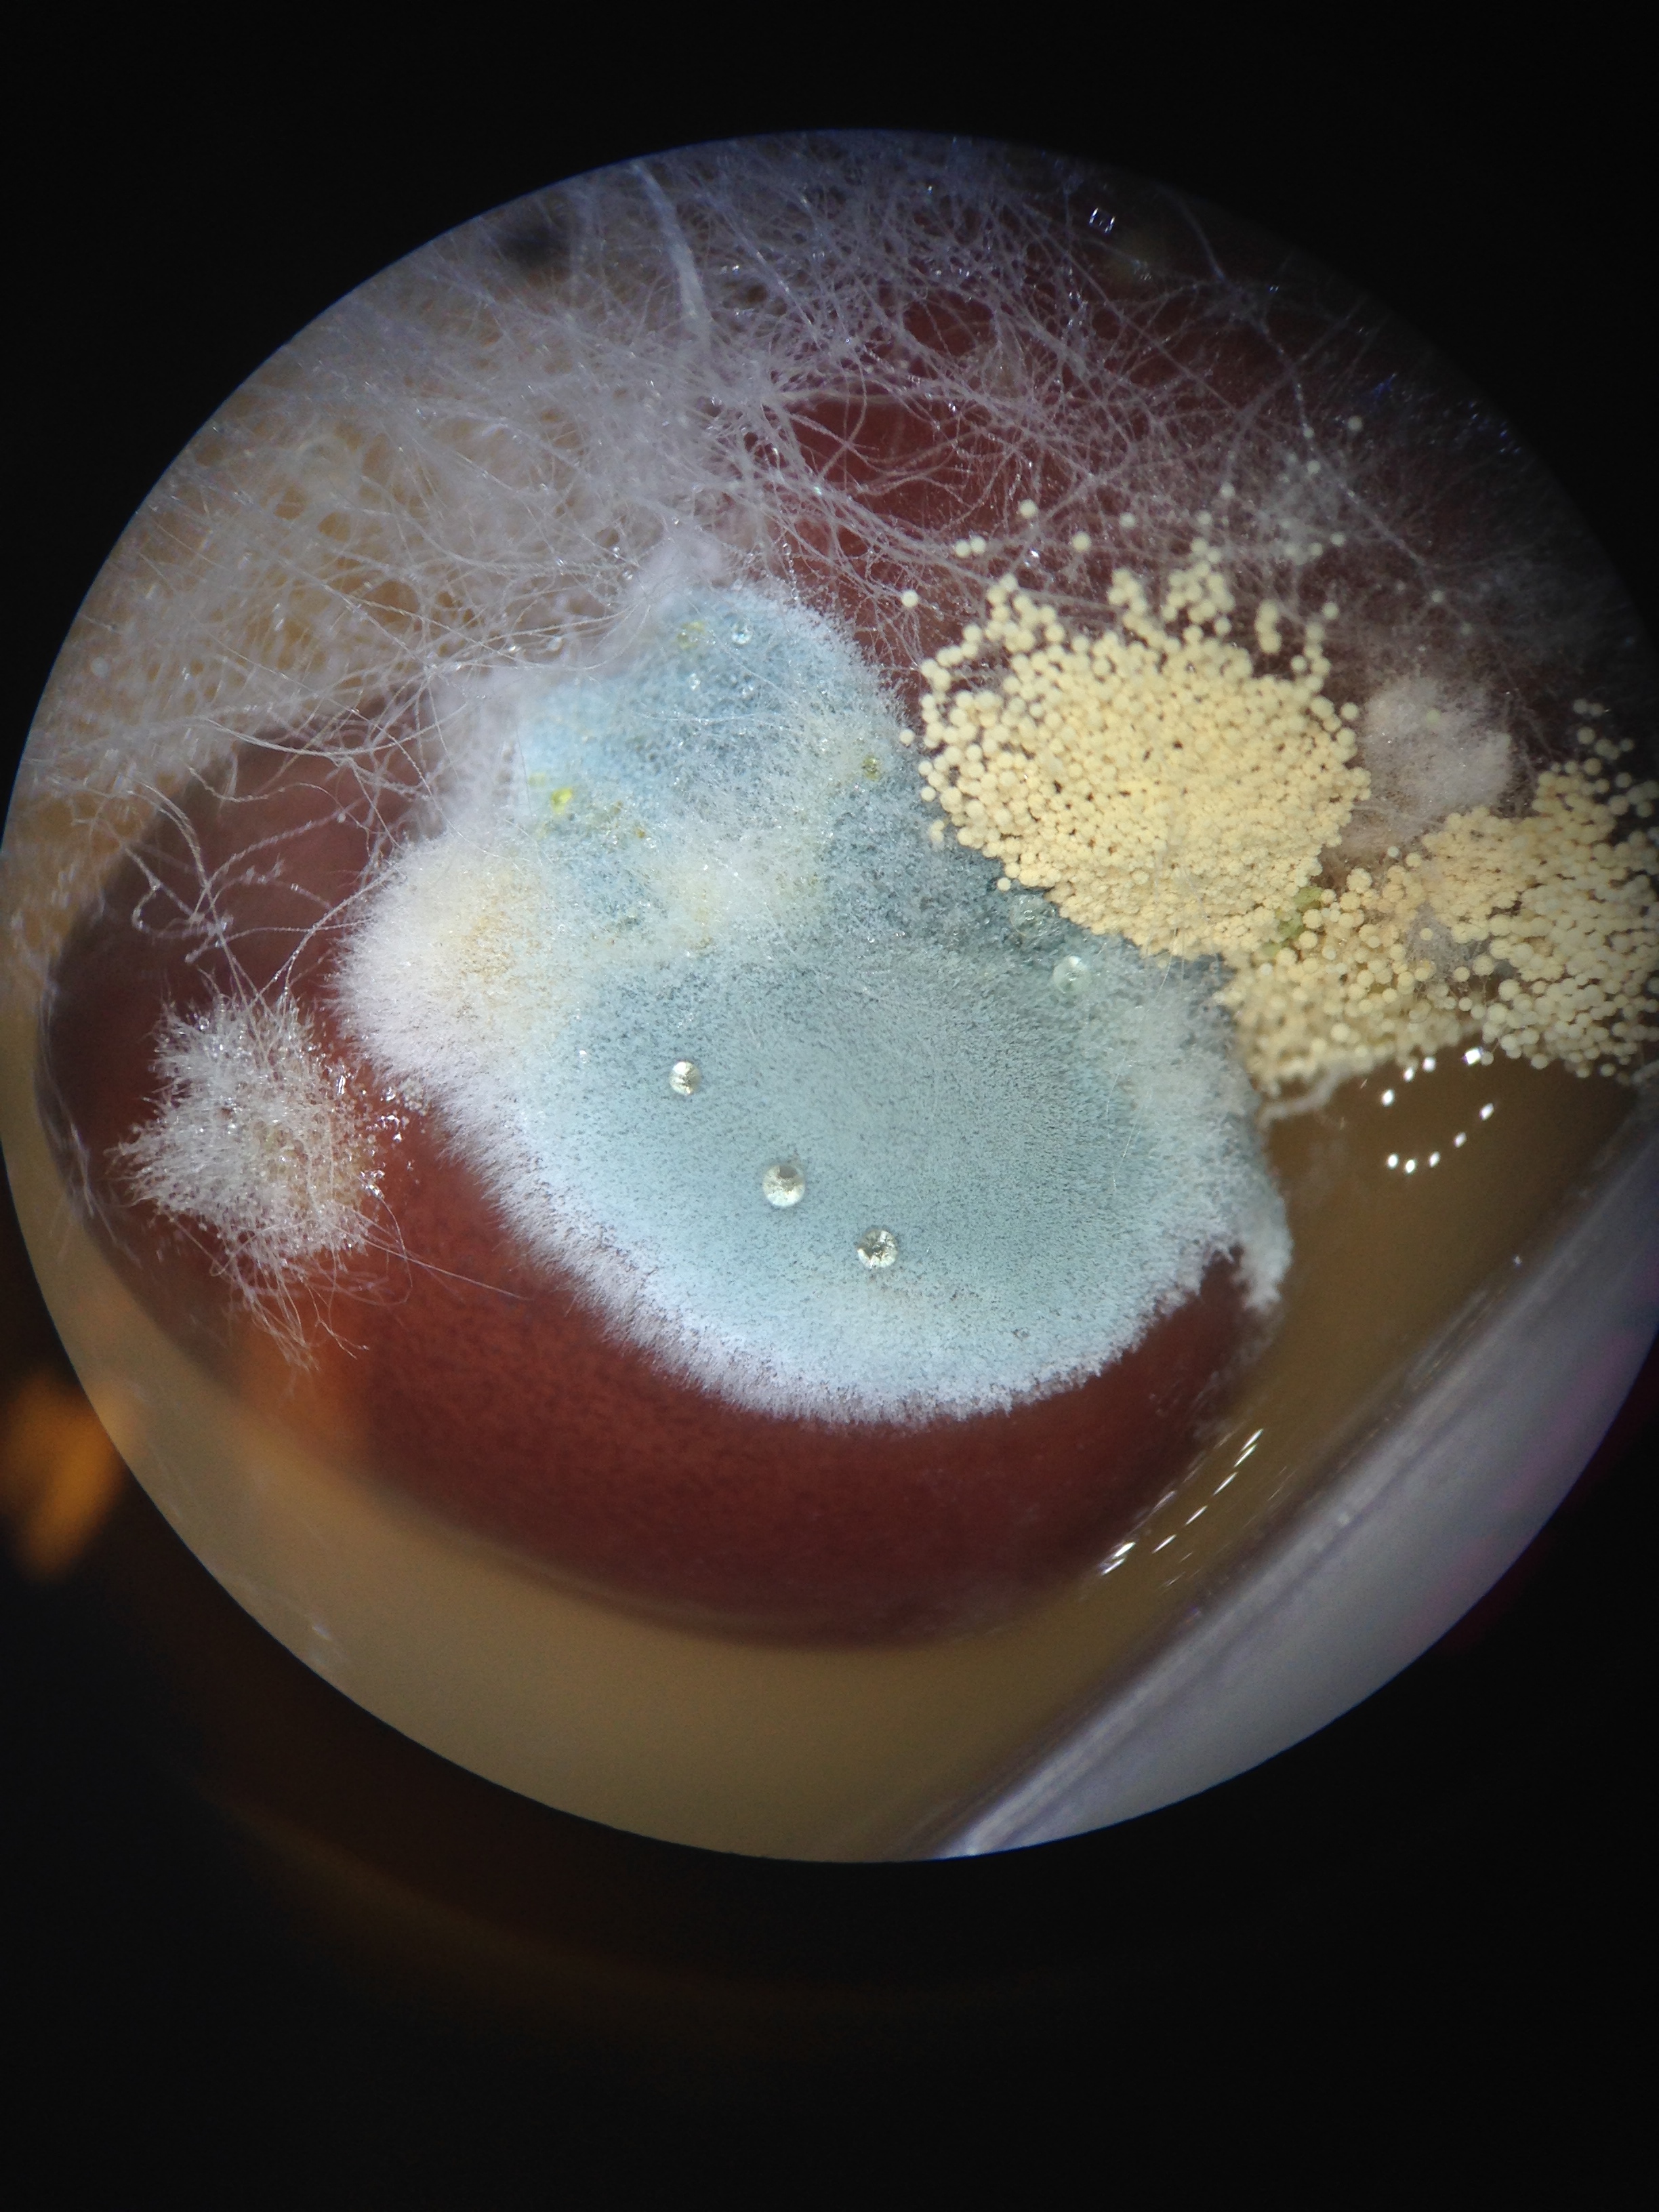 Figure 3. View of fungi (mold) growing on beans. Mold is blue and yellow, some of the white Zygomycota can be seen
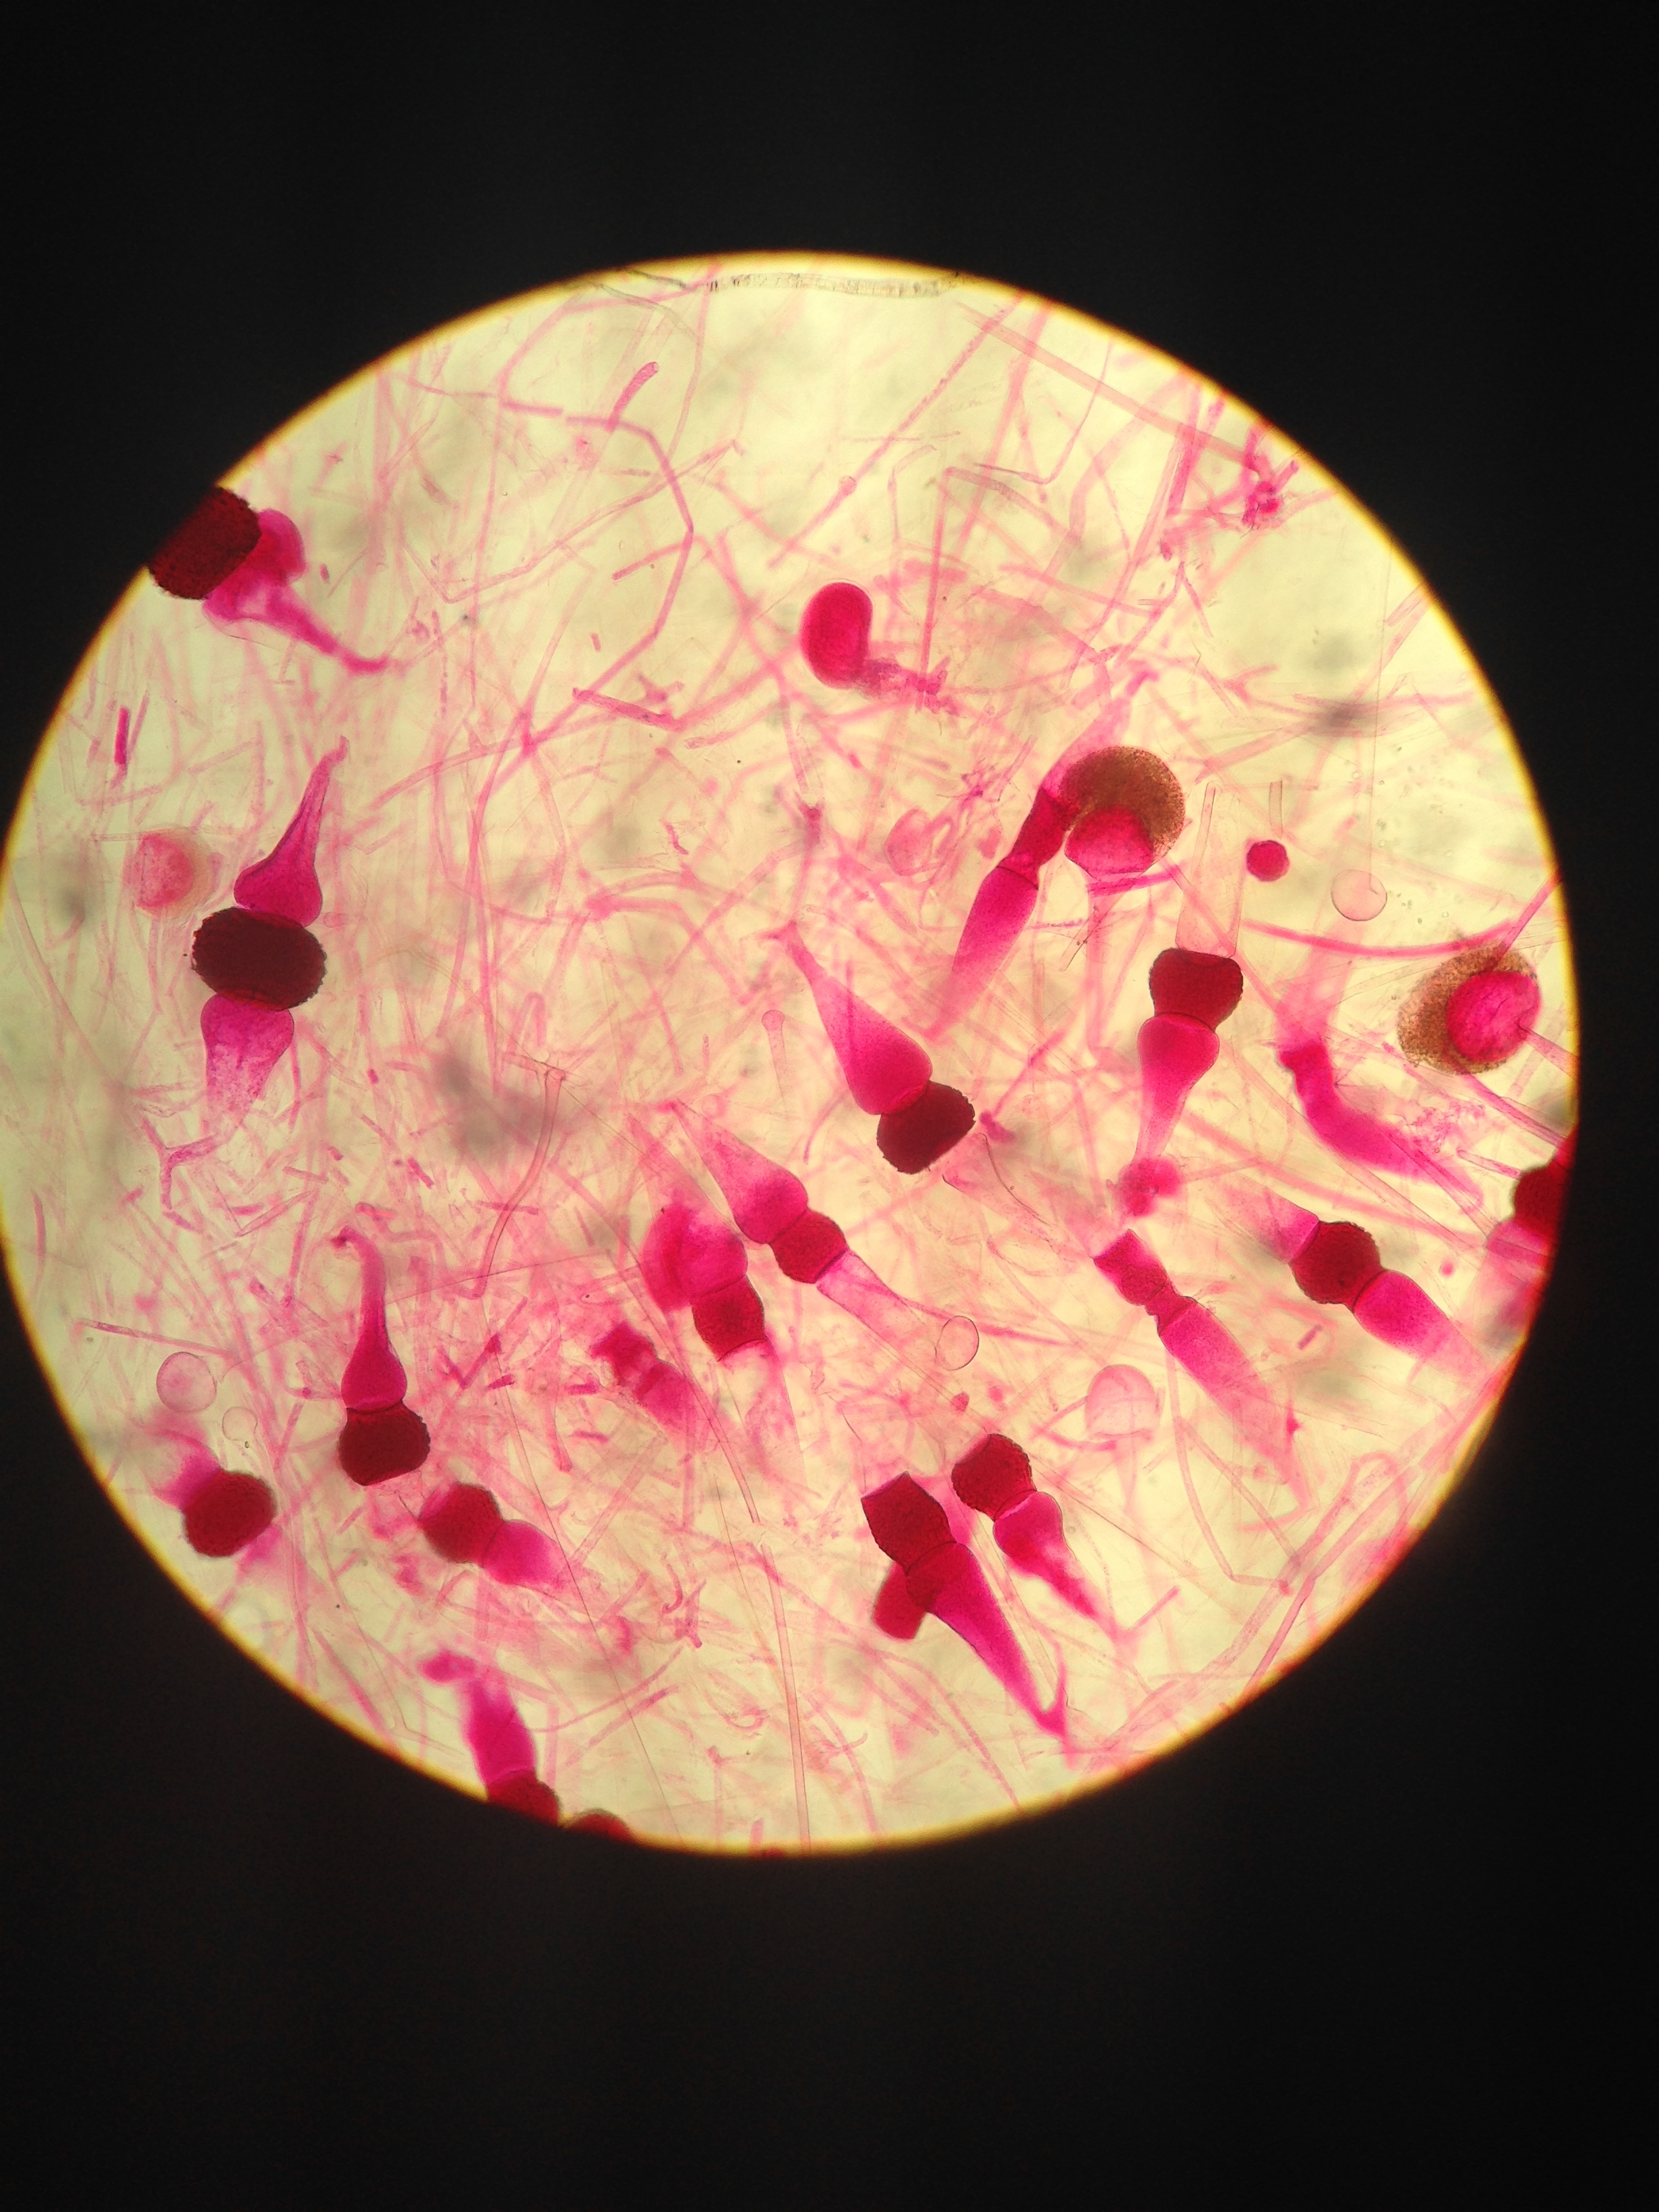 Figure 4. View of rhizonus of sporangia zygotes
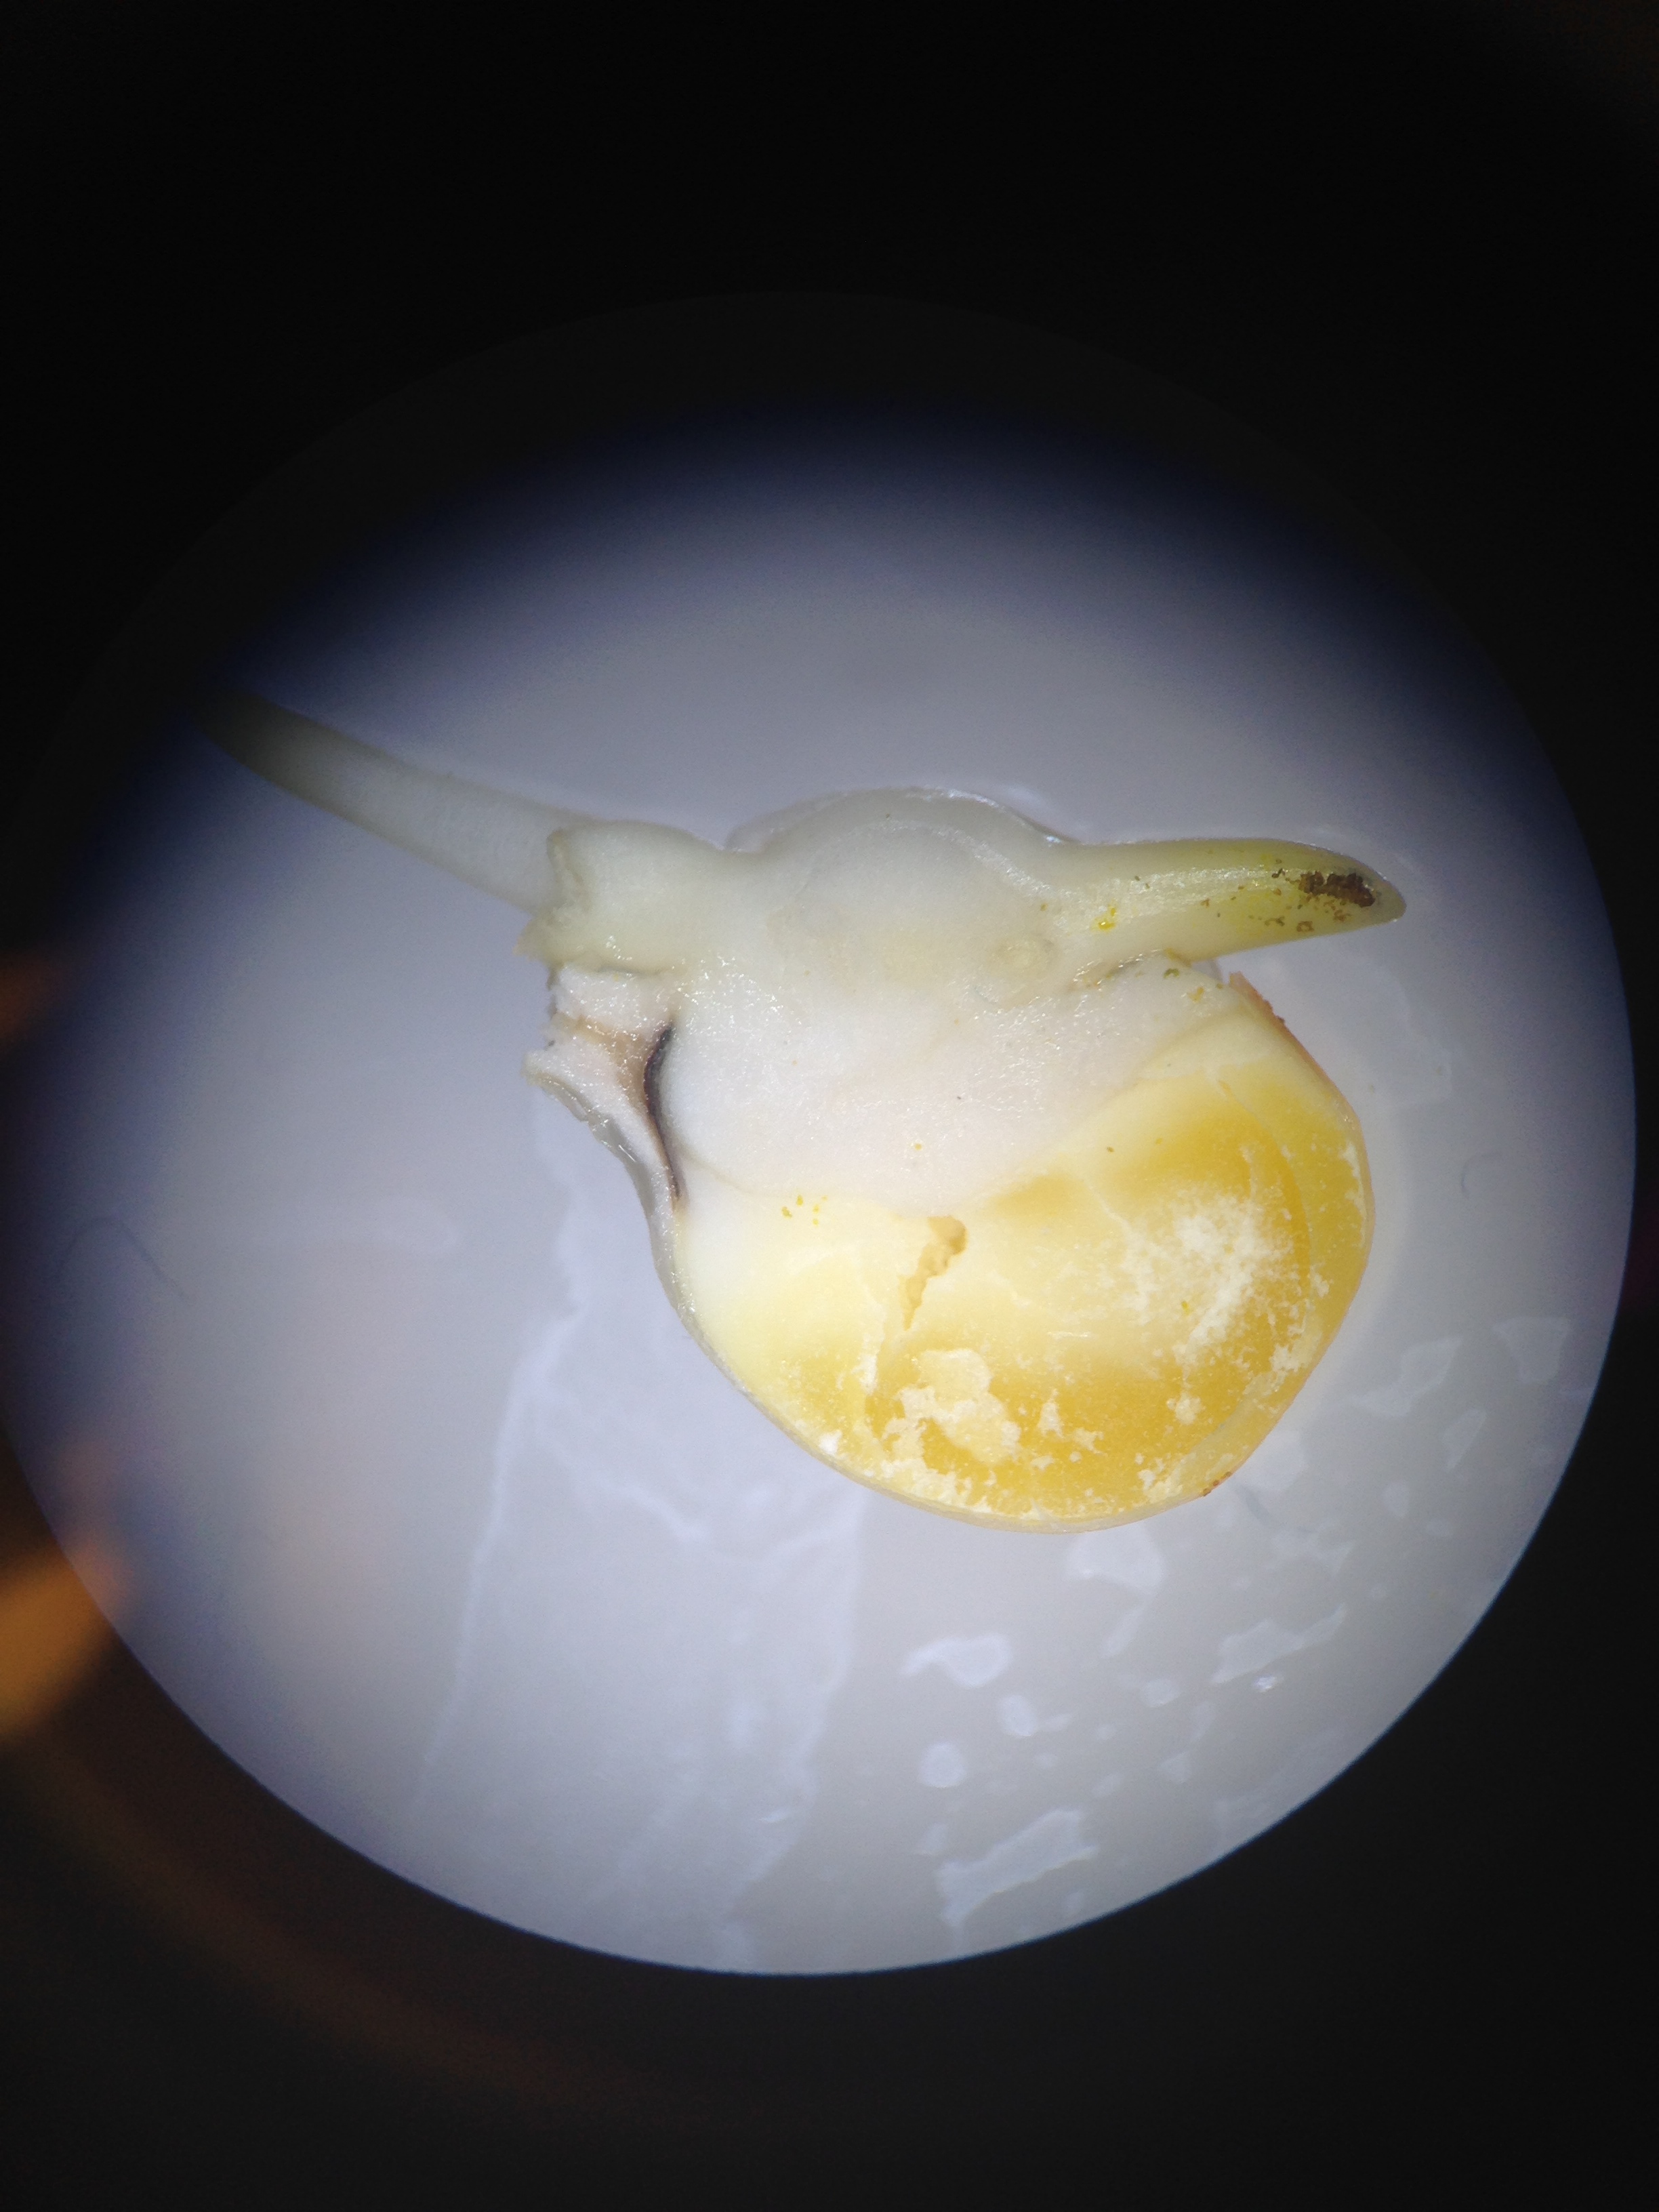
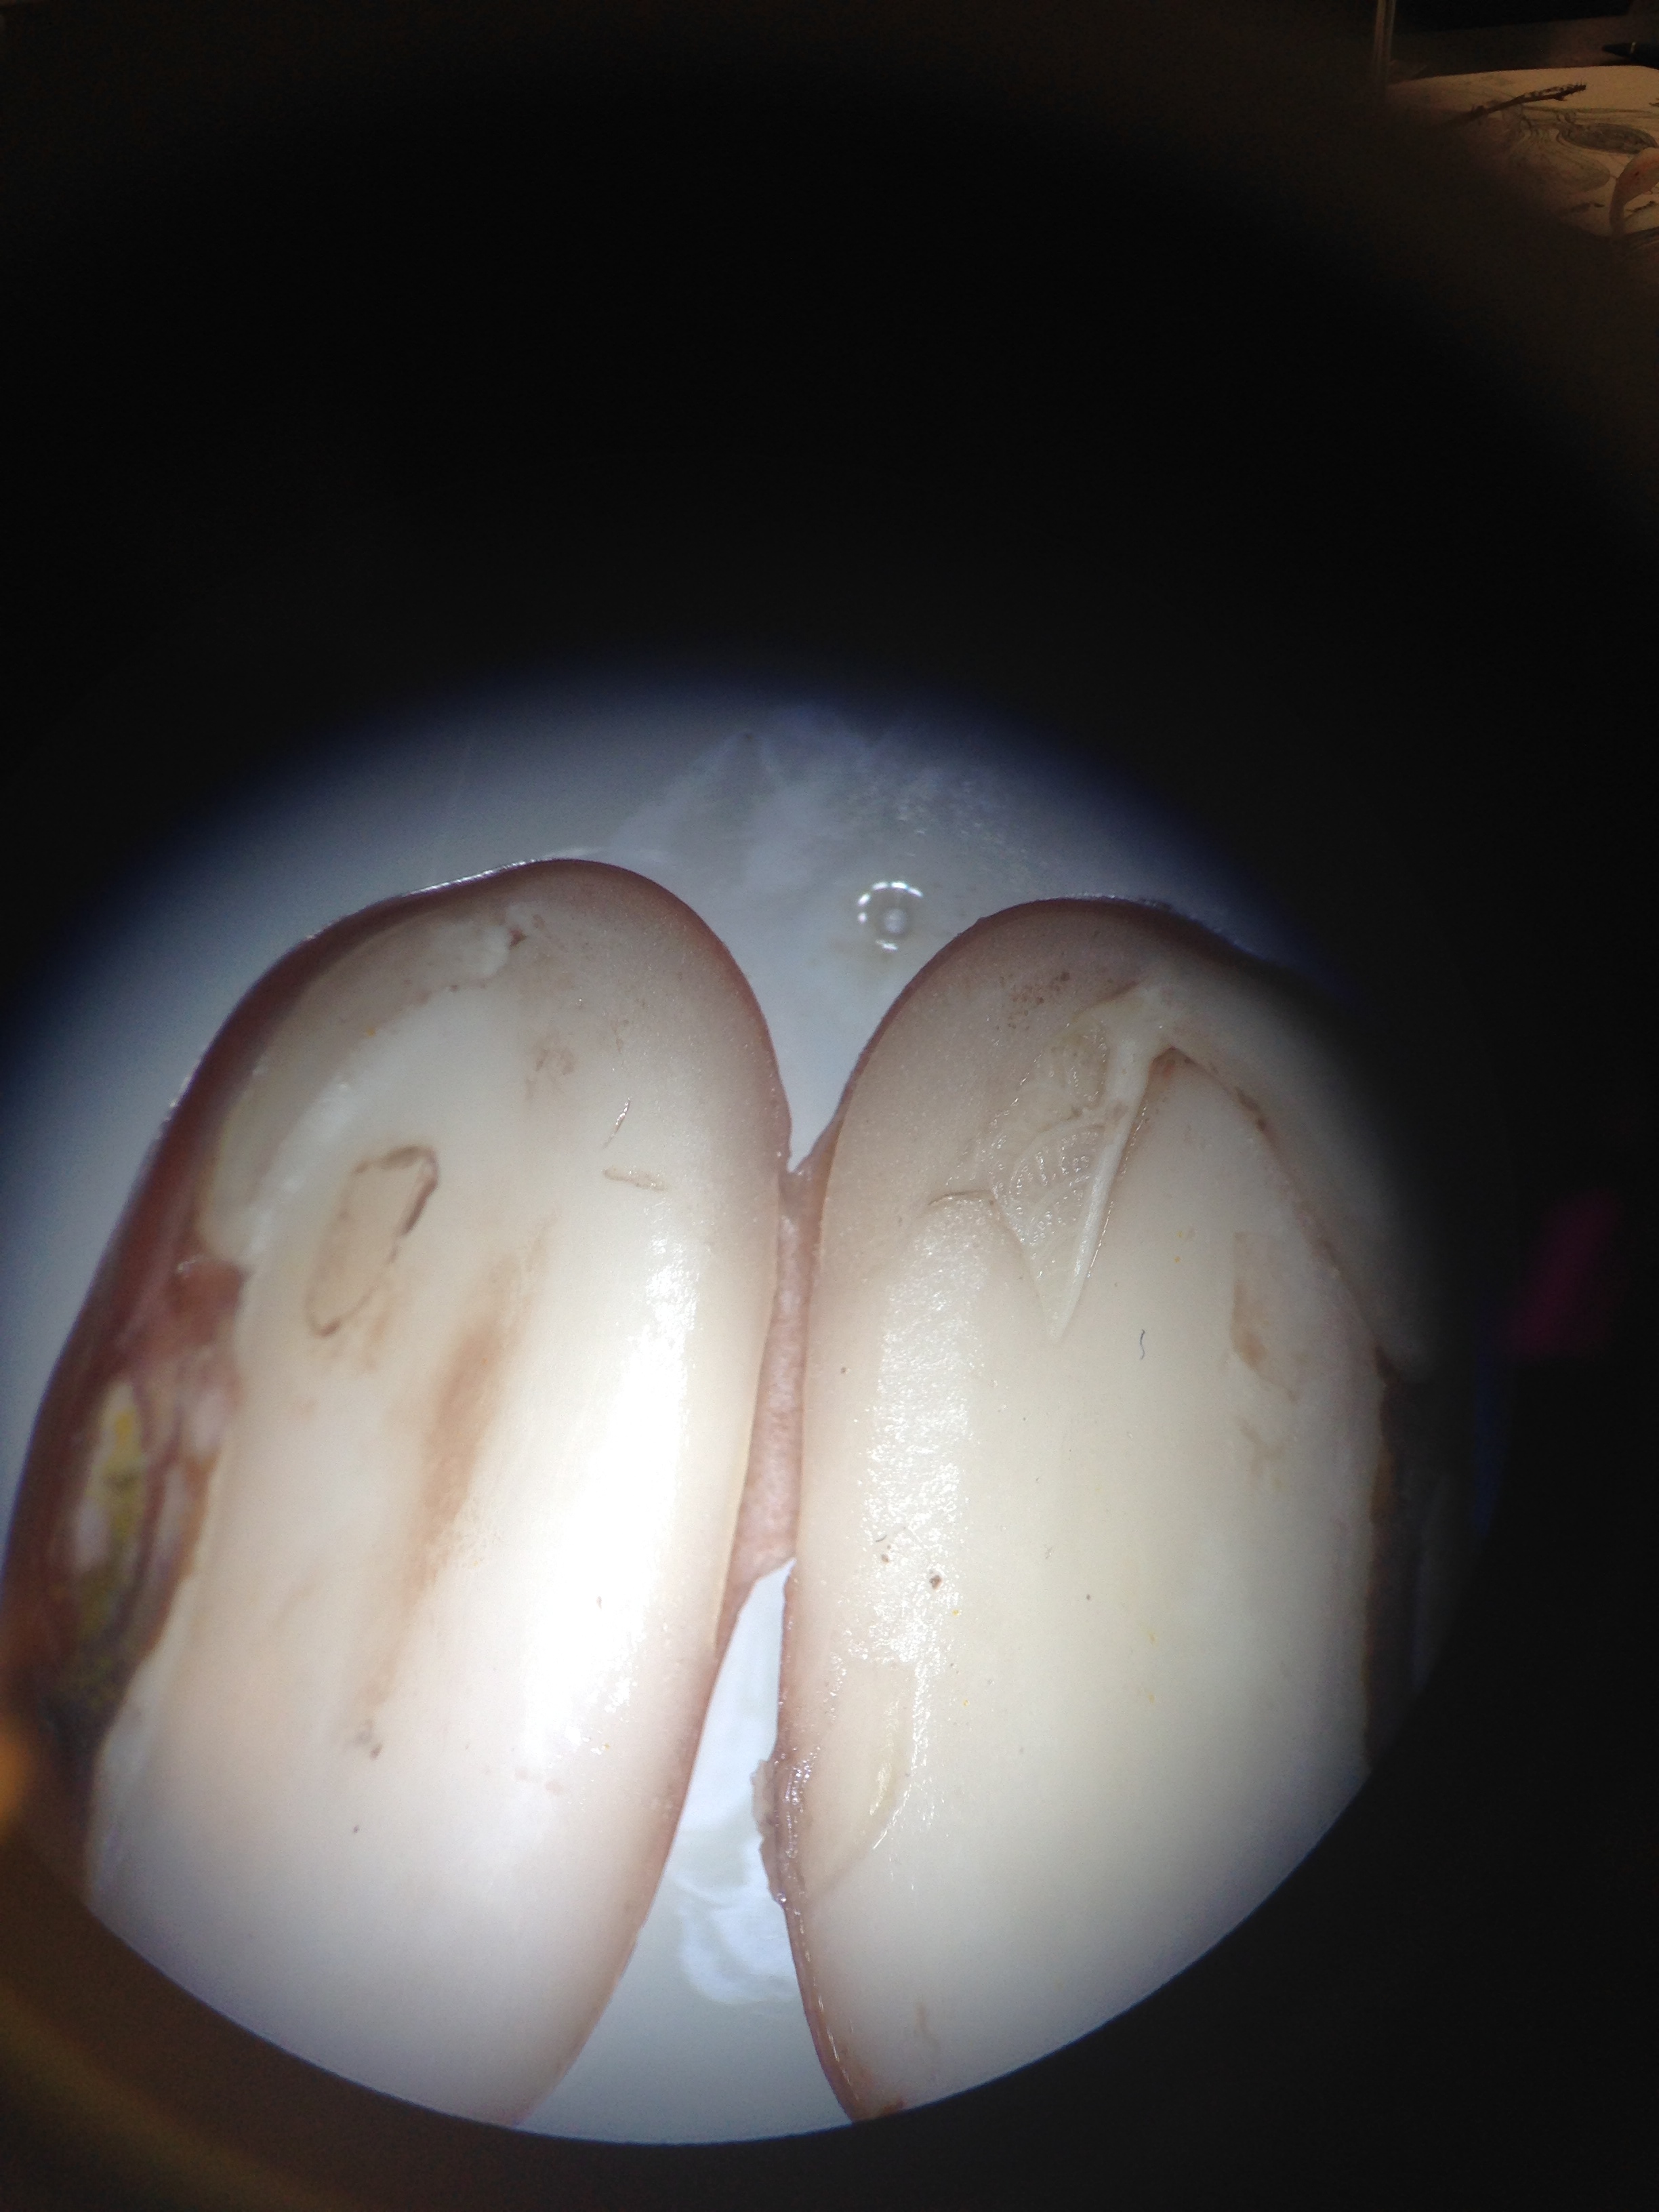 Figure 6.View of corn and bean dissected from procedure IV
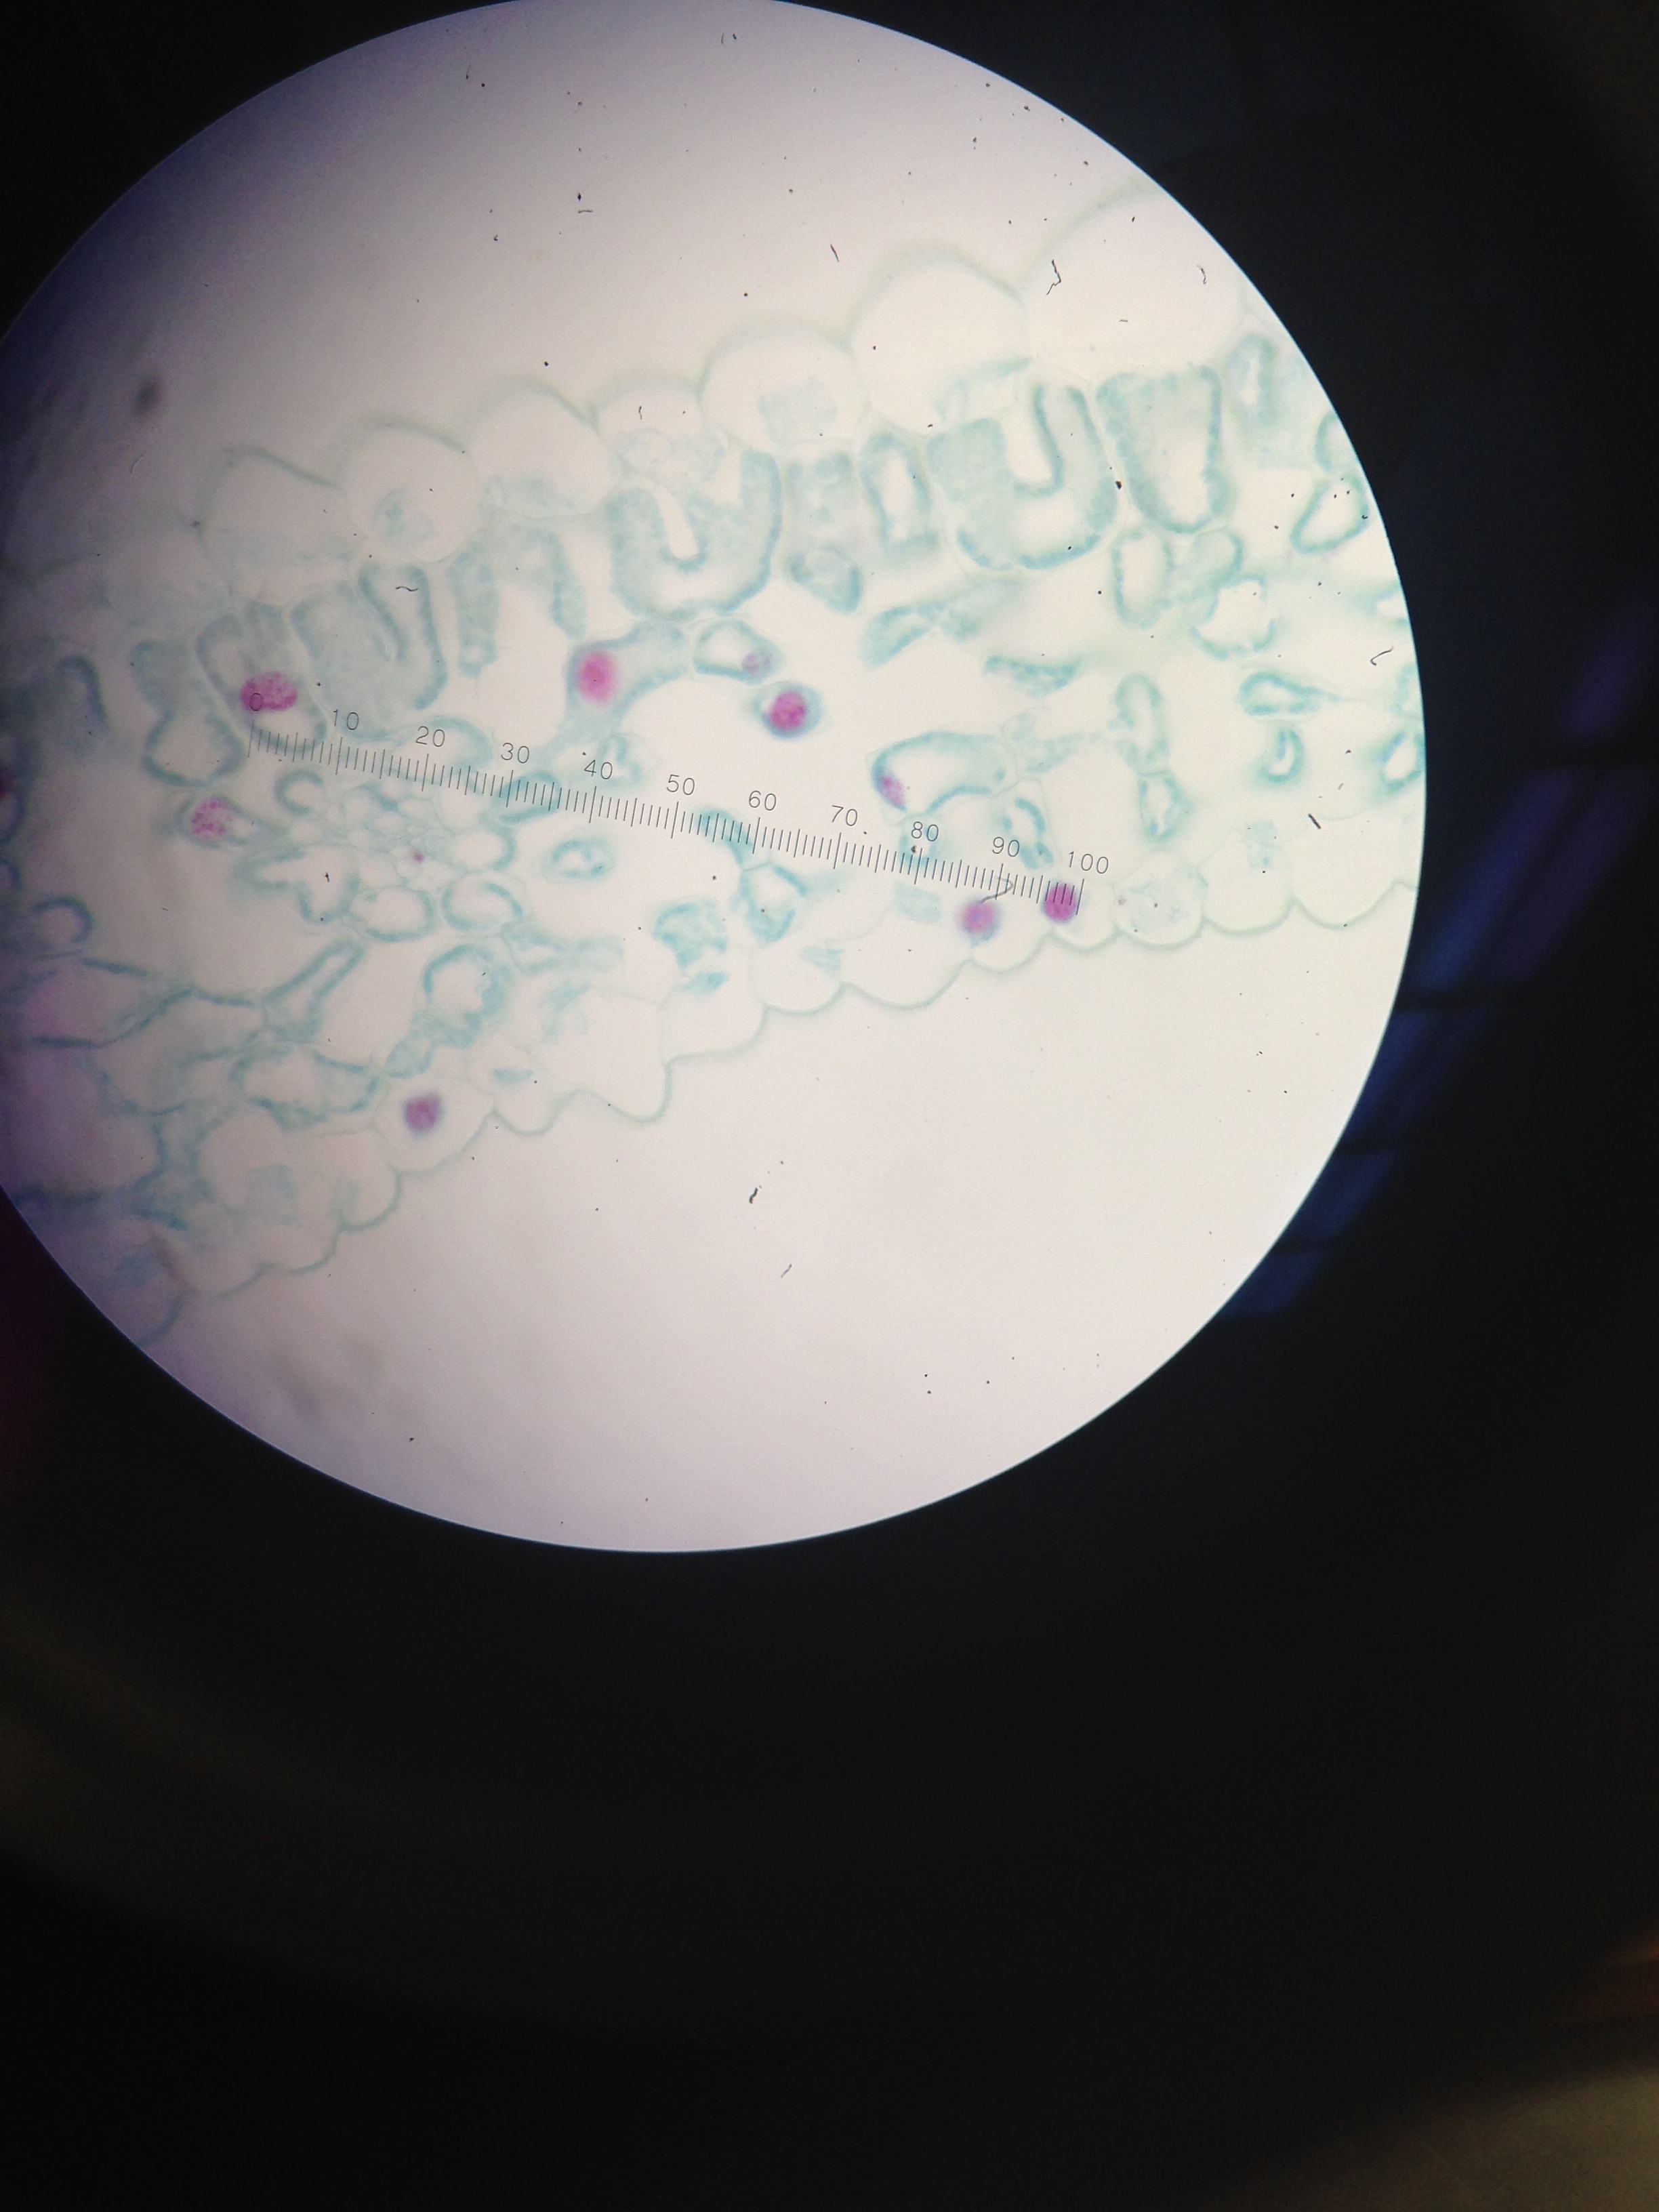 Figure 7.View of lily stem cross section
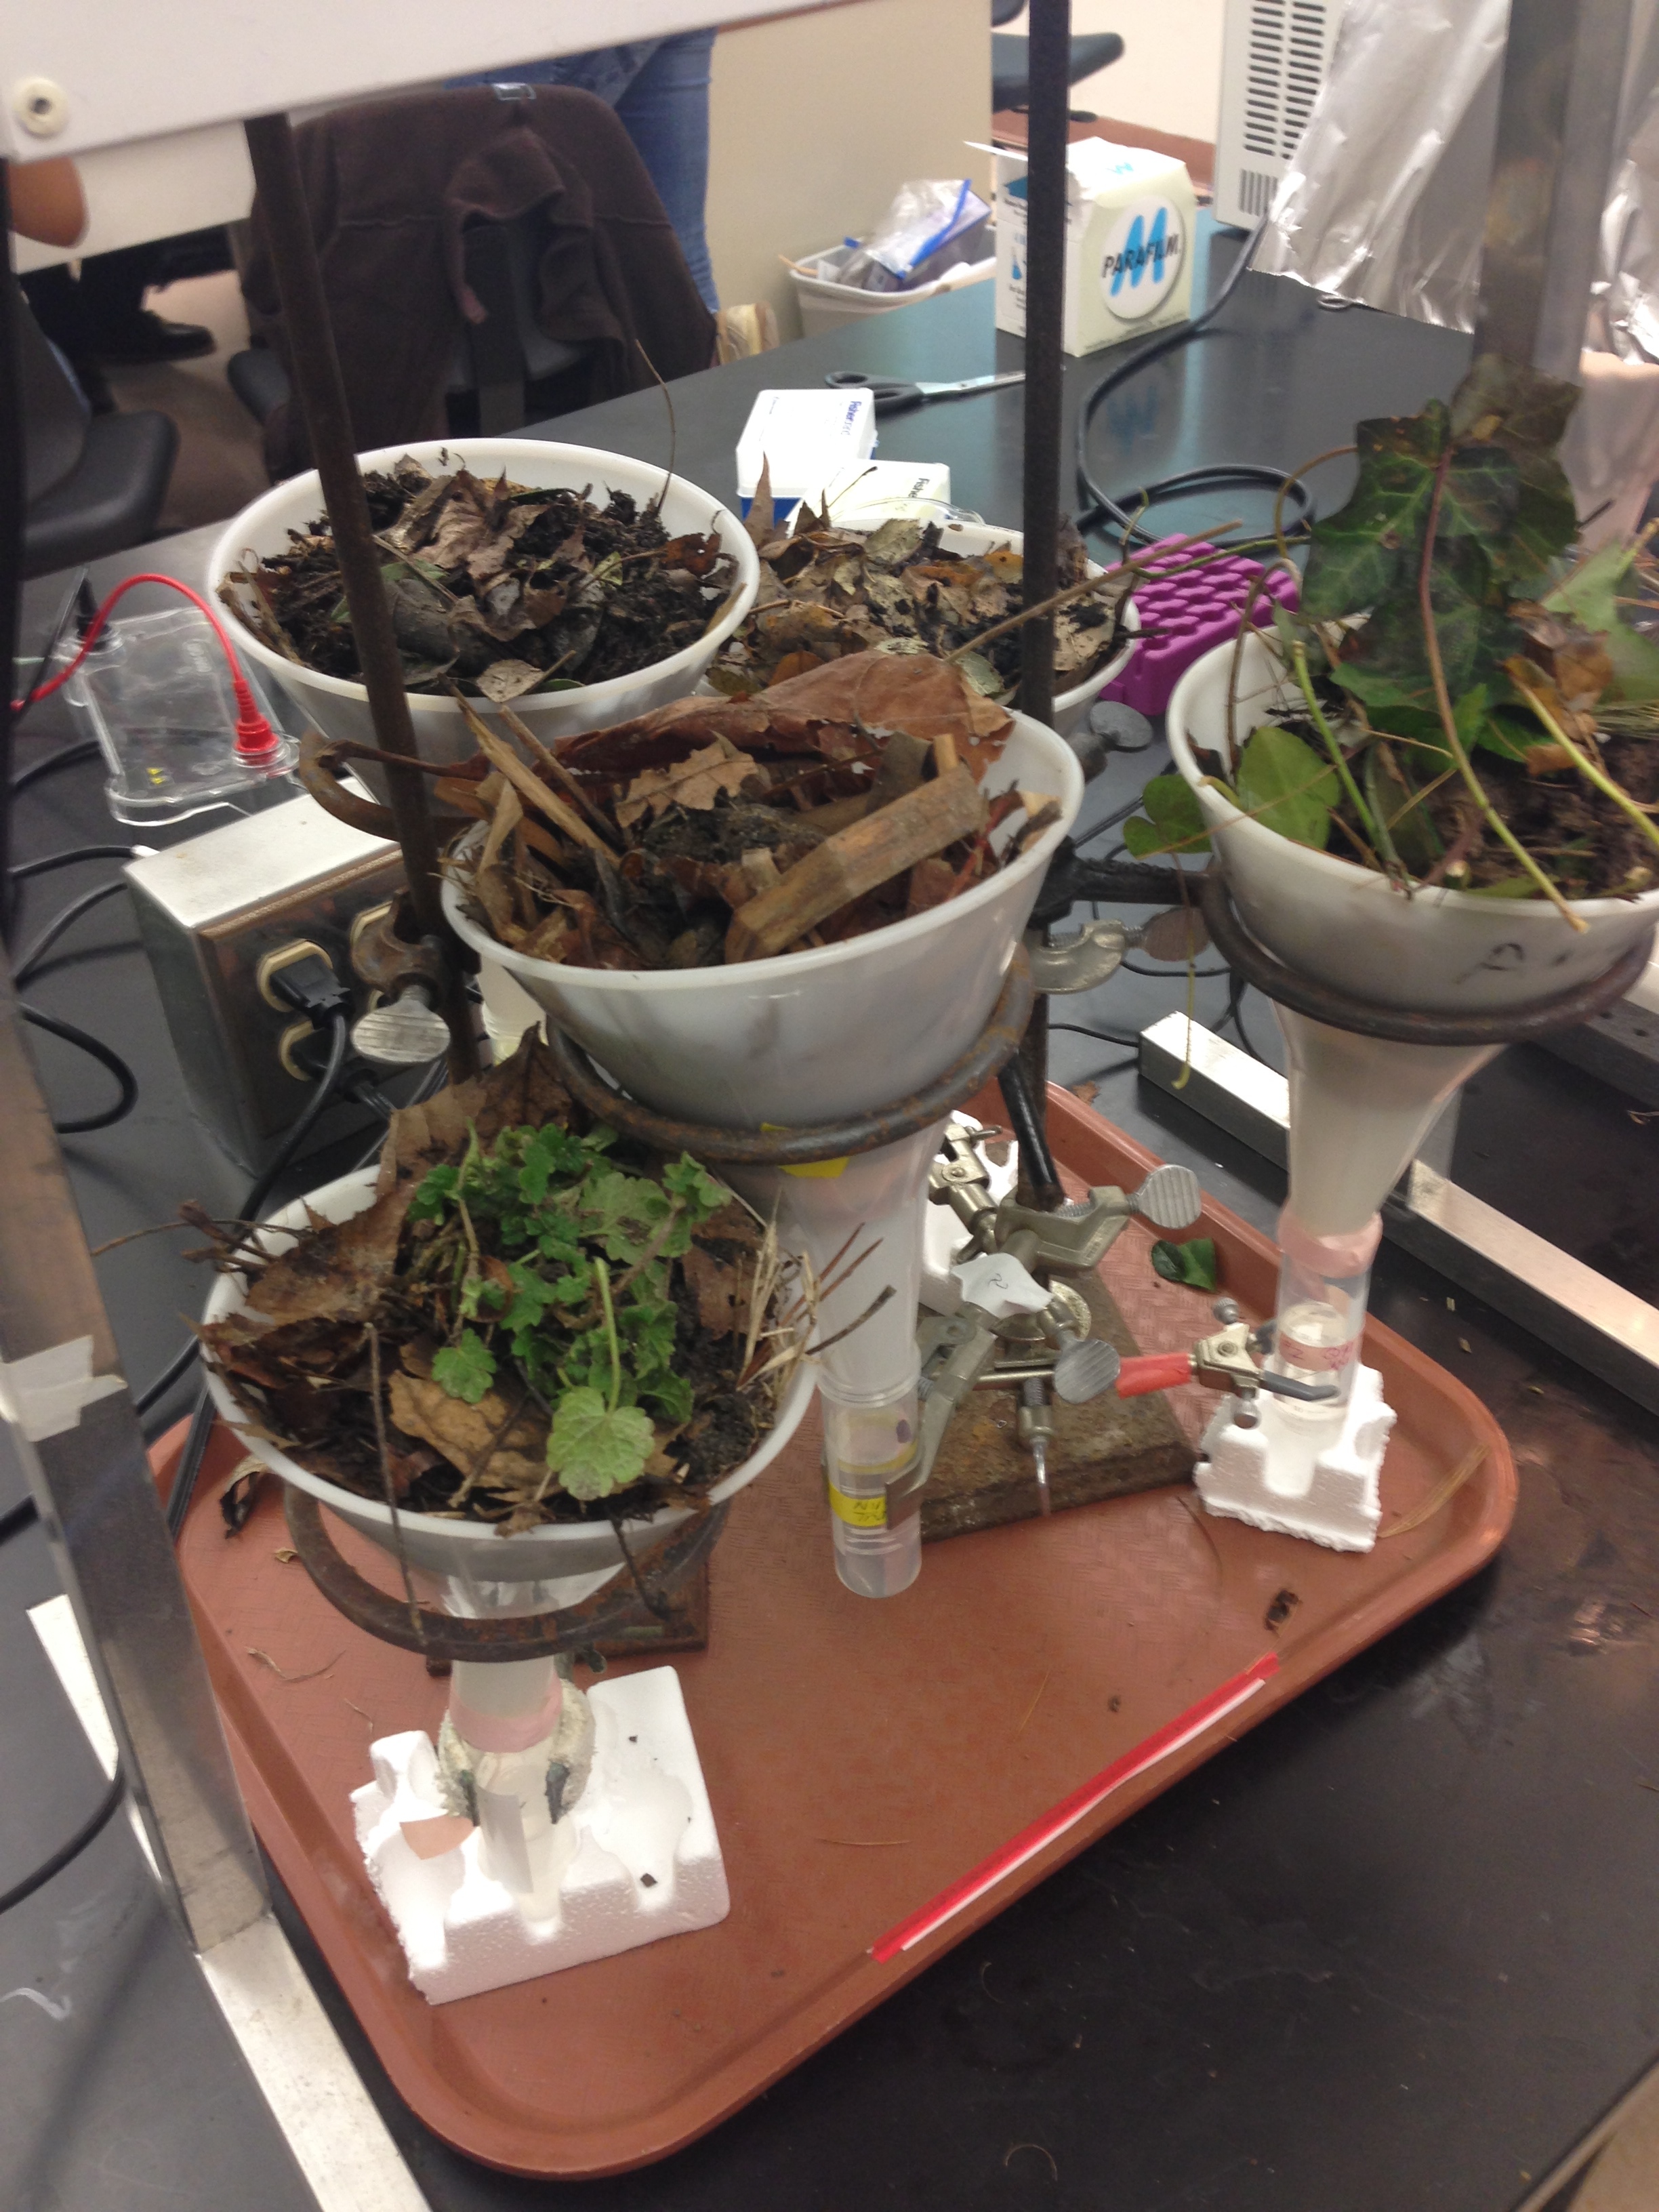 Figure 8. The setup for the invertebrate collection funnel
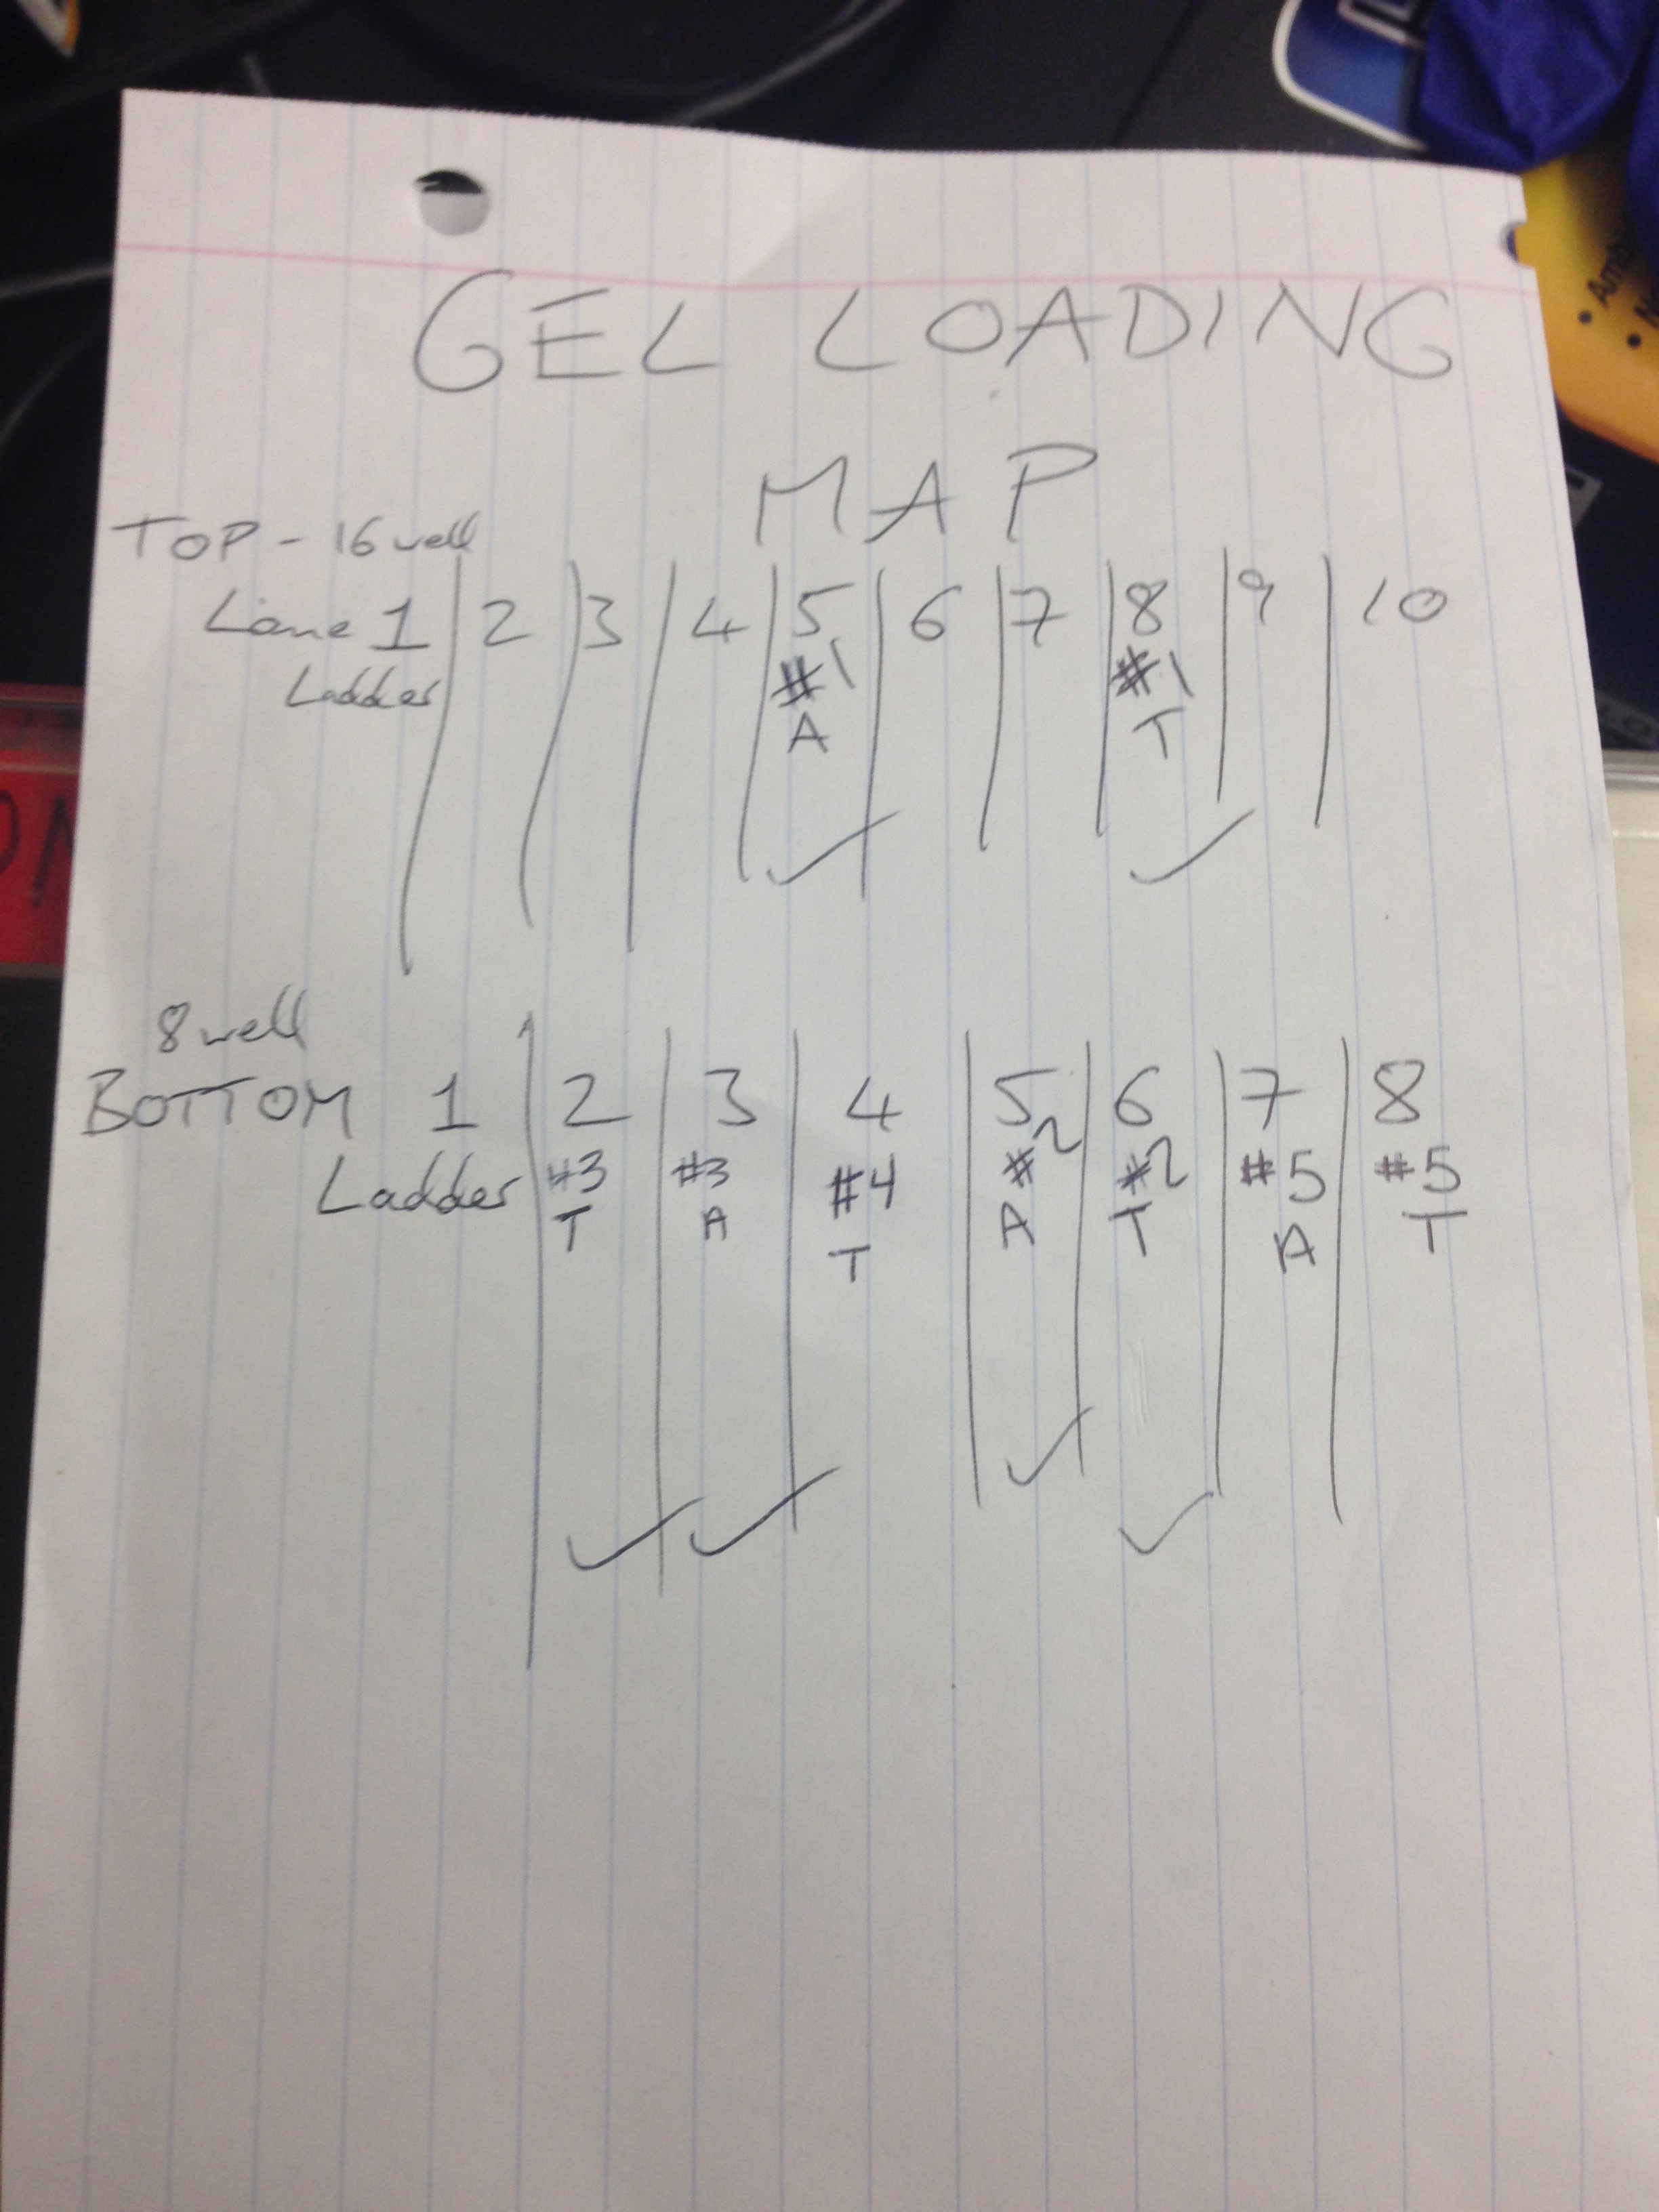
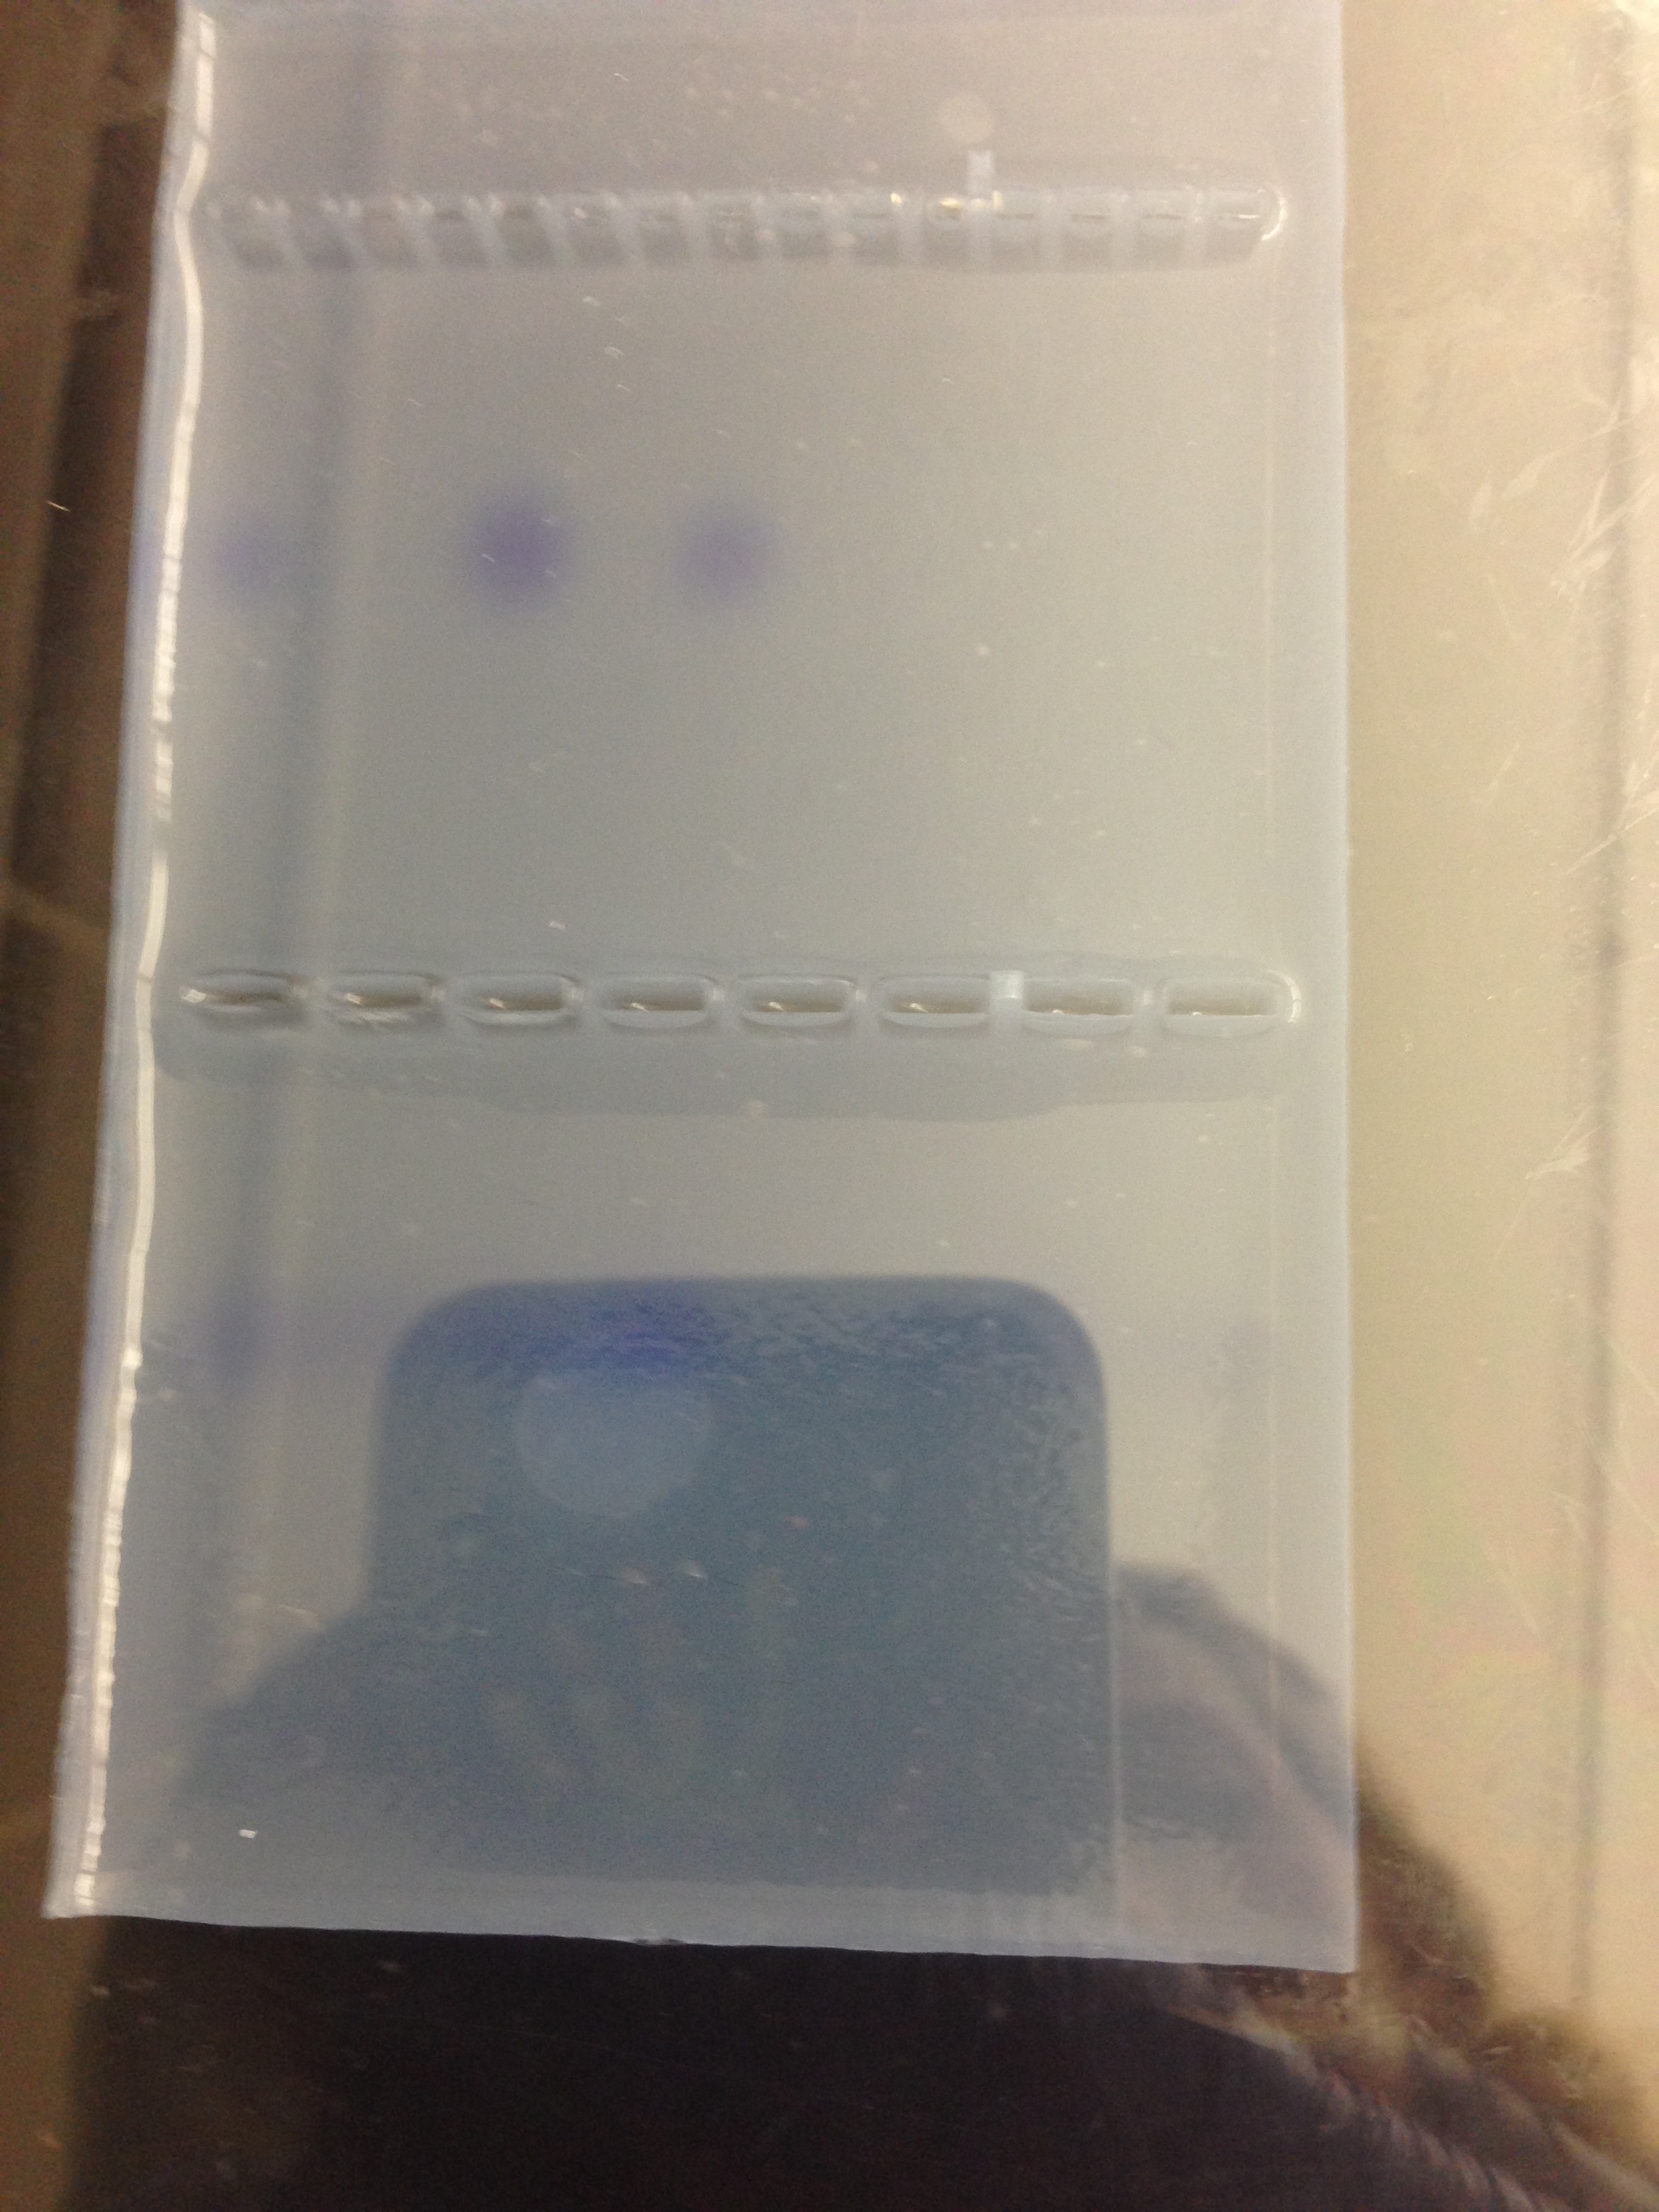 Figure 10. gel loading map and DNA from bacteria collected from previous lab to ensure it is okay to send of to be coded
• The height of the Mnium was 24 cm while the height of the lily plant stem was 73cm • No seeds were able to be collected for the lab • All the plants seemed to use roots as vascularization we were unable to see if a xylem or phloem were present because none of the plants were flowering due to the winter season. • The sporangia of the fungi are important because they hold the spores of the plant that open and allow the fungi to reproduce. The fungus observed all belonged to the Zygomycota group. They are fungus because they look furry and either white or blue, some were yellow little balls, but they had the furry, sporelike characteristics of fungi.
Conclusion: The lab allowed students to see the diversity in plant life and their specialization especially in the plants taken from transect #1.
- Nii Mills 04:04, 19 March 2014 (EDT):
LAB 3
Lab conducted Jan. 28, 2014 Lab notebook written on Feb. 16, 2015
Introduction: In the Biological Life of AU Lab 3 Report, the class resumed its observation, from the previous week before, of bacteria in marked agar dishes to better understand the characteristics and transformation capabilities of bacteria, which helps in its antibiotic resistance. This bacteria was taken from the samples of the Hay Infusion Culture of the previous labs, and was allowed to grow in nutrient agar petri dishes as well as tetracycline ( antibiotic) prepared petri dish. The purpose of this lab was to see whether antibiotic resistive bacteria could be found in our Hay Infusion Cultures and what this says about how these bacteria are gaining these properties due the carelessness of humans.
Procedure I: Microorganisms Recording and Observation
To start with check on any changes seen in the Hay Infusion Culture. Note things like smell and appearance that are a result of the microorganisms from the culture. Next check the agar petri dishes for development of bacteria colonies and also note their appearances, size, and numbers. Colonies that grow together form “ lawn” or a continuous growth so large that specific numbers are indistinguishable.
Procedure II: Bacterial Antibiotic Resistance
The class also found through this lab the capabilities of bacteria to be antibiotic resistive. Many antibiotics and anti-microbial agents have seeped into much of the environment and because of this many bacteria have accelerated in their antibiotic resistive properties because of their exposure to many medicines and cures that rely on antibiotics but have leached into the soil and organic environment due to careless and overall human pollution.
Procedure III: Bacteria Cell Structure Observations It is necessary to use a microscope to identify and observe prokaryotes because of their minuscule size, ranging in size from 1 to 10 microns. Multiple observations will take place, first looking at a prepared slide of bacteria, and afterwards a wet mount prepared slide and a gram stained slides of two defined colonies from the nutrient agar plate and two also from the tetracycline treated agar plates. Have all these colonies properly identified for future reference. Two of these colonies will also be later used for a PCR reaction and sequencing. To create the wet mount sterilize a loop over a flame and then use the loop to scrap a piece of the bacterial growth from the surface of the agar, and mix the a drop of sterile water with attracted bacterial growth on a slide. Place a cover slip and then observe the slide under 10x and 40x objective magnification with the help of the microscope. As for the prepping the slide for the gram stain add a drop of water to smear of the attracted colony and slow the mixture to dry or hold over flame to speed up the process. Lastly, circle underneath this slide with a red wax pencil to clearly locate the smeared colony.
Gram Staining Continuation 1. Cover the smear with crystal violet solution for 1 minute 2. Rinse the stain off with sterile water 3. Cover the smear with Gram’s idine mordant for 1 minute. Repeat Step #2 4. Decolorize the smear with 95%alcohol for 10-20 seconds. Wait till the solvent flows colorlessly from the slide. 5. Cover the smear with safranin stain for 20-30 seconds. Repeat Step #2 6. Blot excess water with paper towel and let air dry 7. When done with the process observe the slide under a microscope at 40x and oil objective (without coverslip)
Procedure IV: PCR Preparation for DNA sequence Identification Select a colony from nutrient agar plates and one other colony from the antibiotic resistant colonies and selectively amplify the 16S rRNA gene of both colonies using two primer sequences (27F and 519R). Transfer a colony of bacteria to 100 microliters of water in a sterile tube and incubate at 100 degrees Celsius for 10 minutes. Afterwards place the tubes in a centrifuge. Use 5 microliters of supernatant in the PCR reaction for next lab to analyze the DNA sequences.
Materials and Methods Procedure I • Hay Infusion Culture • Agar Nutrient Bacteria/Antibiotic Resistant Bacteria Procedure II • Agar Nutrient Bacteria/Antibiotic Resistant Bacteria Procedure III • Gram Staining Equipment • Agar Nutrient Bacteria/Antibiotic Resistant Bacteria • Microscope Procedure IV • 100 microliters of water • Small Tubes • 5 microliters of supernatant • Primers • Bacteria samples
Data and Observations
Procedure I: • The smell of the Hay Infusion Culture had diminished, and the same could be said about the amount of water that had initially been in the jar. There was also the appearance of what appeared to be algae on the sides of the jar as well. • It would be expected that the smell of the culture change week to week because of the continuous evaporation of water. This would also change the appearance of the environment, exposing the plant material but probably affecting the microorganisms probably residing in the jar. • In appearance the tetracycline treated bacteria were definitely a distinguishable orange color while the nutrient agar bacteria ranged in various colors (orange, white, green, blue) this would probably indicate that nutrient agar bacteria had various different types of bacteria growth, while the tetracycline bacteria was one uniform colony of bacteria that contained the resistive gene. • The probable affect on the total number of bacteria was it reduced the bacteria to just the orange bacteria containing the resistive gene thus they grew while no other coloration of bacteria was seen on the agar and thus was the only unaffected out of all the other bacteria that grew on the nutrient agar dishes. • Tetracycline has the ability to inhibit protein synthesis and enzyme reactions necessary for bacteria. The antibiotic binds itself to the 30S ribosome of bacteria to prevent the aminoacyl tRNA from attaching to the RNA-ribosome complex. Bacteria sensitive to tetracycline include gram +/- bacterium such: e. coli, flu bacteria, tuberculosis, and bronchitis bacteria
Figure 1. Table 1 100-Fold Serial Dilutions Results
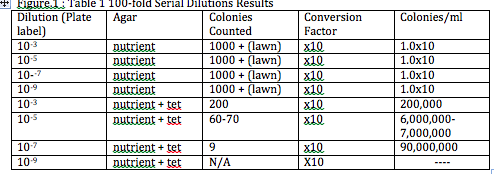
Figure 2. Table 2 Description of Gram Stained Cells
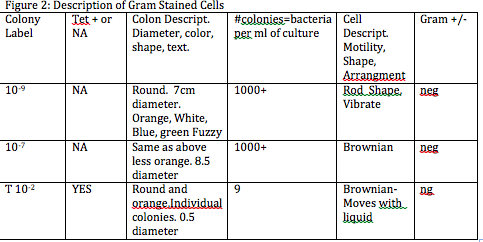
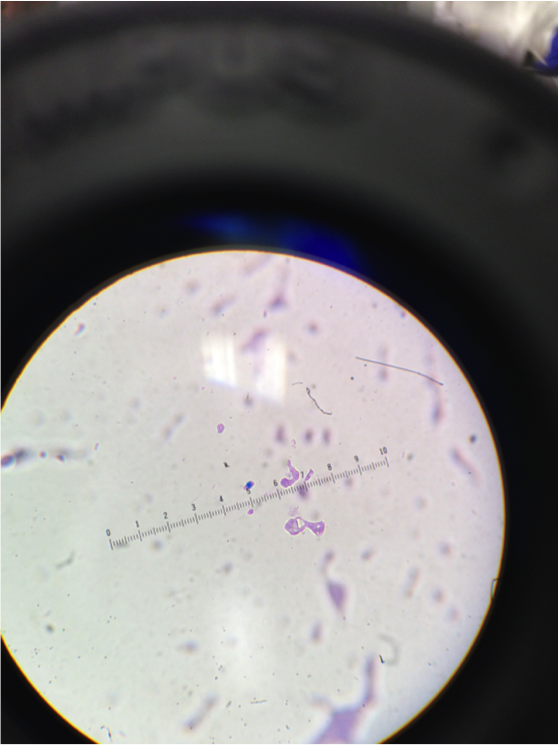 Figure 3. Image of cells from nutrient agar dish 10-9
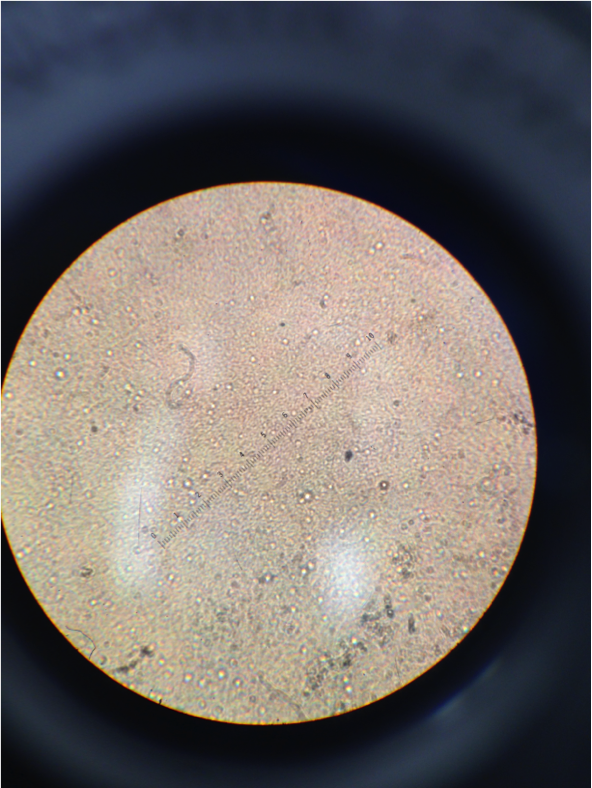 Figure 4. Image of cells from nutrient agar dish 10-7. The cells can be seen moving in a Brownian motion due to the liquid
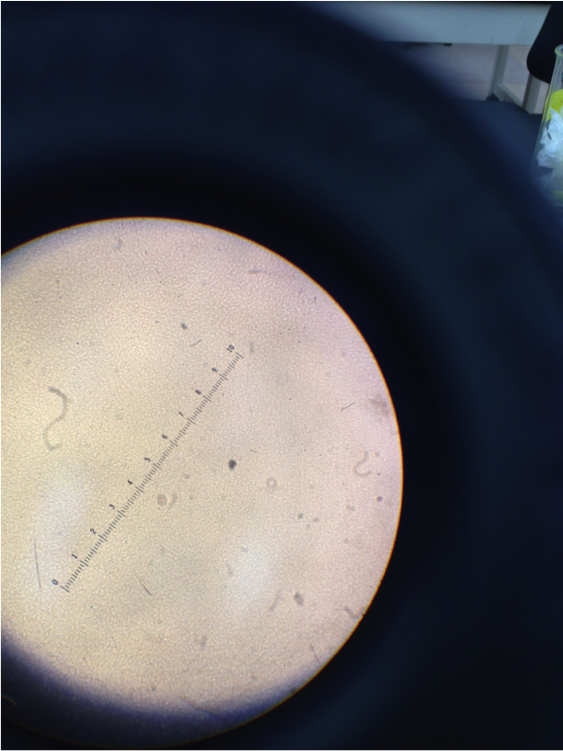 Figure 5. Image of cells from tetracycline dish 10-7
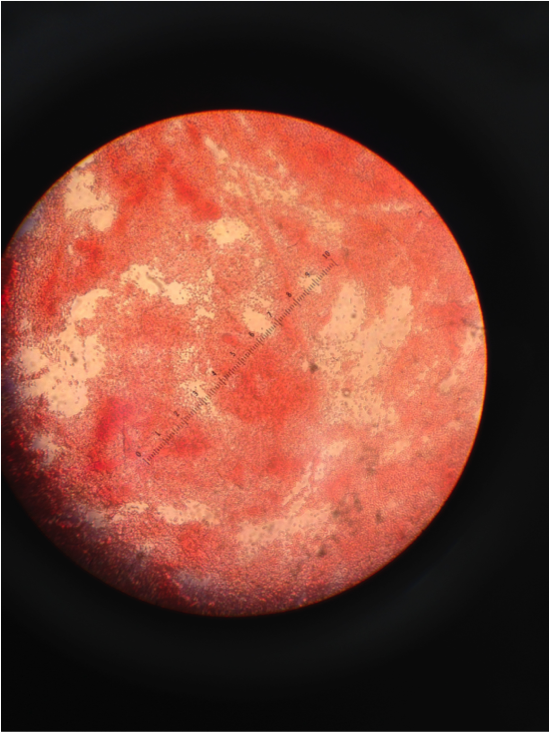 Figure 6. Image of Gram Stain negative from 10-9 dish
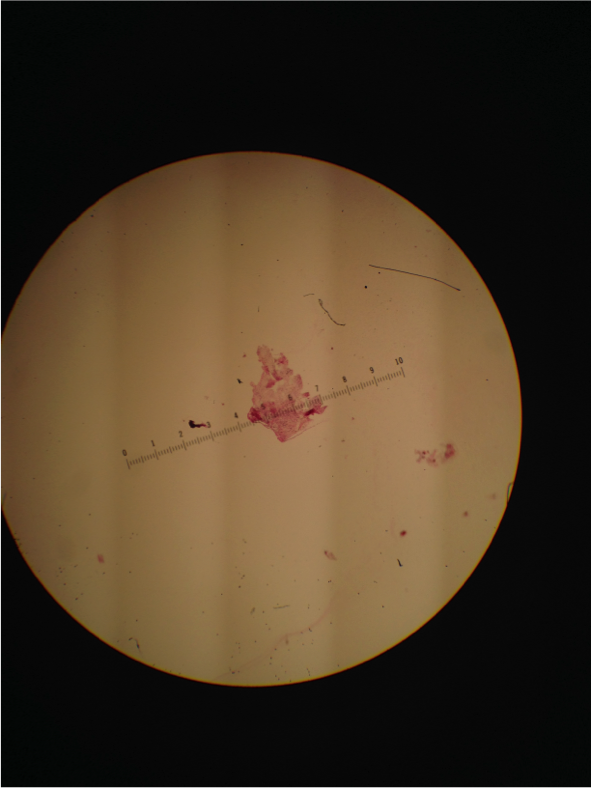 Figure 7. Image of Gram Stain negative 10-7 from nutrient agar dish
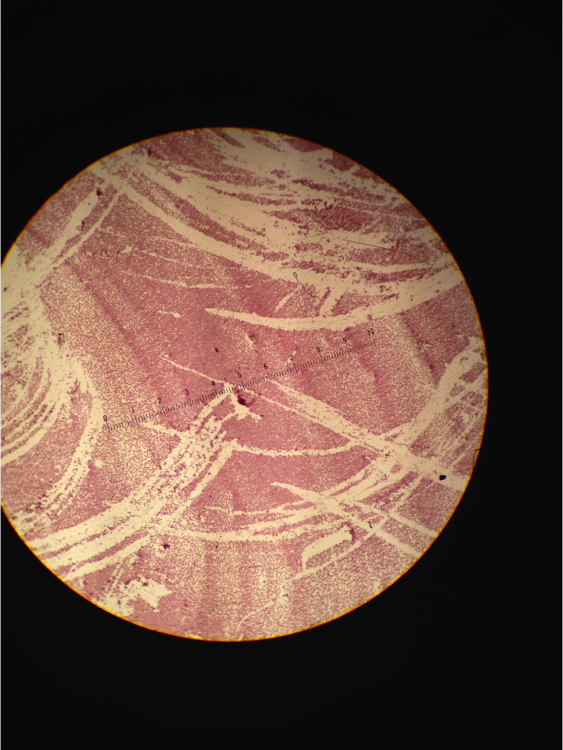 Figure 8. Image of Gram Stain negative from tetracycline dish 10-7
Conclusion: From this laboratory our lab group identified the importance of gram+/- bacterium and how this affects the capabilities of antibiotic resistance for bacteria. The characteristics of these bacteria were observed, but as to how and why the bacterium gained resistance is unknown, this undetermined answer can provide for further research for the class hopefully to be acquired in Lab 4 or future labs.
Resources: Source Klajn, R. "Tetracycline - Antimicrobial properties." Chemistry and chemical biology of tetracyclines. N.p., n.d. Web. 16 Feb. 2014.
*Nii Mills 02:51, 19 March 2014 (EDT):
LAB 2
Lab conducted on Jan. 21, 2014 Lab notebook written on Feb. 9, 2014
Introduction: In the Biological Life of AU Lab 2 Report, the class continued its observations and discerning changes seen from a Hay Infusion cultures that were created previously in Lab 1. Then using sample from these cultures look to see if any bacterial organisms could be found in this liquid mixtures, especially bacteria with antibiotic resistive properties. Students also had the opportunity to feel the wonder that early scientists experienced looking under light microscopes to study the primitive eukaryote forms of amoeba, paramecium, and other extremely minute unicellular organisms specially categorized as either what we know as algae or protists. Looking under the microscope we were able to identify the characteristics of algae and protist as well.
Materials and Methods: The lab consisted of using a dichotomous key in order to identify groups of organisms, as well as creating a wet mount to better observe these organisms as prepared slides under a microscope. In the later part of the lab Hay Infusion cultures created from samples of Transect 1, a niche seen on American University’s campus and described previously in Lab 1 report. The 500mL liquid had evaporated some since Lab 1. Abiotic material and Biotic material in the culture had settled at the bottom of the jar in which they were contained. Samples of the culture were taken and then applied to petri dishes to see if bacteria could be found in our Hay Infusion Culture and especially if these bacterial organisms had resistive antibiotic properties if they were able to grow on petri dishes specially prepared with antibiotics.
Procedure I: Using a Dichotomous Key • Preparing a wet mount with the known organism and observed for characteristics such as size, shape, color and movement with a microscope at 4x and 10x. From these characteristics obtain a Key that describes eight known organism and using that Key identify and determine that specific organism. Confirm your speculations with the diagram provided during the laboratory. Do the same process with another organism so that, two organisms are identified during this section of the laboratory.
Procedure II: Hay Infusion Culture Observations • The jar labeled Transect #1 previously held 500 mL of liquid and within this liquid was its own self contained ecosystem and within this ecosystem are even smaller niches. This means that various parts of the jar and the liquid inside have various microorganism specially found in only that part of the jar. Observations were made about the contents of the jar including its smell, coloration (appearance), and the additions of any factors not seen previously during Lab 1. After all of this had been conducted take some samples for microscopic observations, take these samples from two different niches. Take one sample from the surface liquid of the Hay Fusion Culture, and another sample closer to the biotic component of the mixture (plant material). Note observations seen between these different samples and draw pictures of these observations such as size using the ocular micrometer
Procedure III: Plating Serial Dilutions on Agar Plates • This part of the procedure is in preparation for Microbiology Lab # 3. This will be done by preparing 100 fold dilutions of the culture and then inoculating them in agar petri dishes. First obtain four tubes of 10 mls sterile broth and label these tubes (2,4,6, 8), secondly get a micropipeter set a 100 microliters. Use four nutrient agar and four agar that have been prepared with tetracycline. The tetracycline dishes should be labeled with “tet” to prevent confusion later in the procedure. Label one unlabeled plate and one labeled “tet” as 10-3.. Repeat this labeling tyle for the remaining six plates but this time one couple as 10-5, another as 10-7, and lastly 10-9. Add that group’s initials to each slide as well. Mix the Hay Infusion Culture liquid and components together and take 100 microliters from the mix and add it to the 10mls of broth labeled 2 for 10-2 dilution and swirl that tube. From tube 2 take 100 microliters of broth and transfer that to the tube labeled 4 swirl the contents. Repeat sort of transferring for tube 6 and tube 8. Take 100 microliters from 10-2 and place it on the surface of nutrient agar plate labeled 10-3. Spread the mixture across the plate do the same thing on “tet” 10-3. Repeat this procedure with Tube 4 on the 10-5 plates, tube 6 on the 10-7 plates, and tube 8 on the 10-9 plates. The plates should remain in room temperature for the next week to be later observed for bacterial growth.
Data and Observations:
• All the dirt had settled to the bottom of the jar while grass stalks floated in the middle of the mixture and thin film over the surface of mixture. Mold and algae seemed to be growing on the sides of the jar. The smell had worsened as well. There are appeared to be three defined niches within the culture and the microorganisms found in these niches reflected their differences. The organisms near plant matter more likely consume plants as opposed to the organism further away that do not necessarily need plant matter to survive but may survive by some other form of consumption. The samples for the lab were taken from the surface and middle of the culture. • An organism found in our samples was paramecium, and it can be considered a life form because it has the ability to replicate and was a product of evolution, is a single cell, has DNA to store and process information, and lastly is capable of gaining energy to continue cellular processes. • If the Hay Infusion Culture had been observed two months from now, then the entirety of the water would have evaporated. Also this would probably change the composition of the environment overall because now certain microorganisms would no longer have the ideal environment to be present in and die. Certainly a decrease in microorganisms would be seen. • The selective pressure that mostly likely had the greatest influence on the composition of the samples was the location from which the sample was taken from. Meaning depending if it was closer to plant matter or closer to dirt, it would influence the type of organism found in the sample.
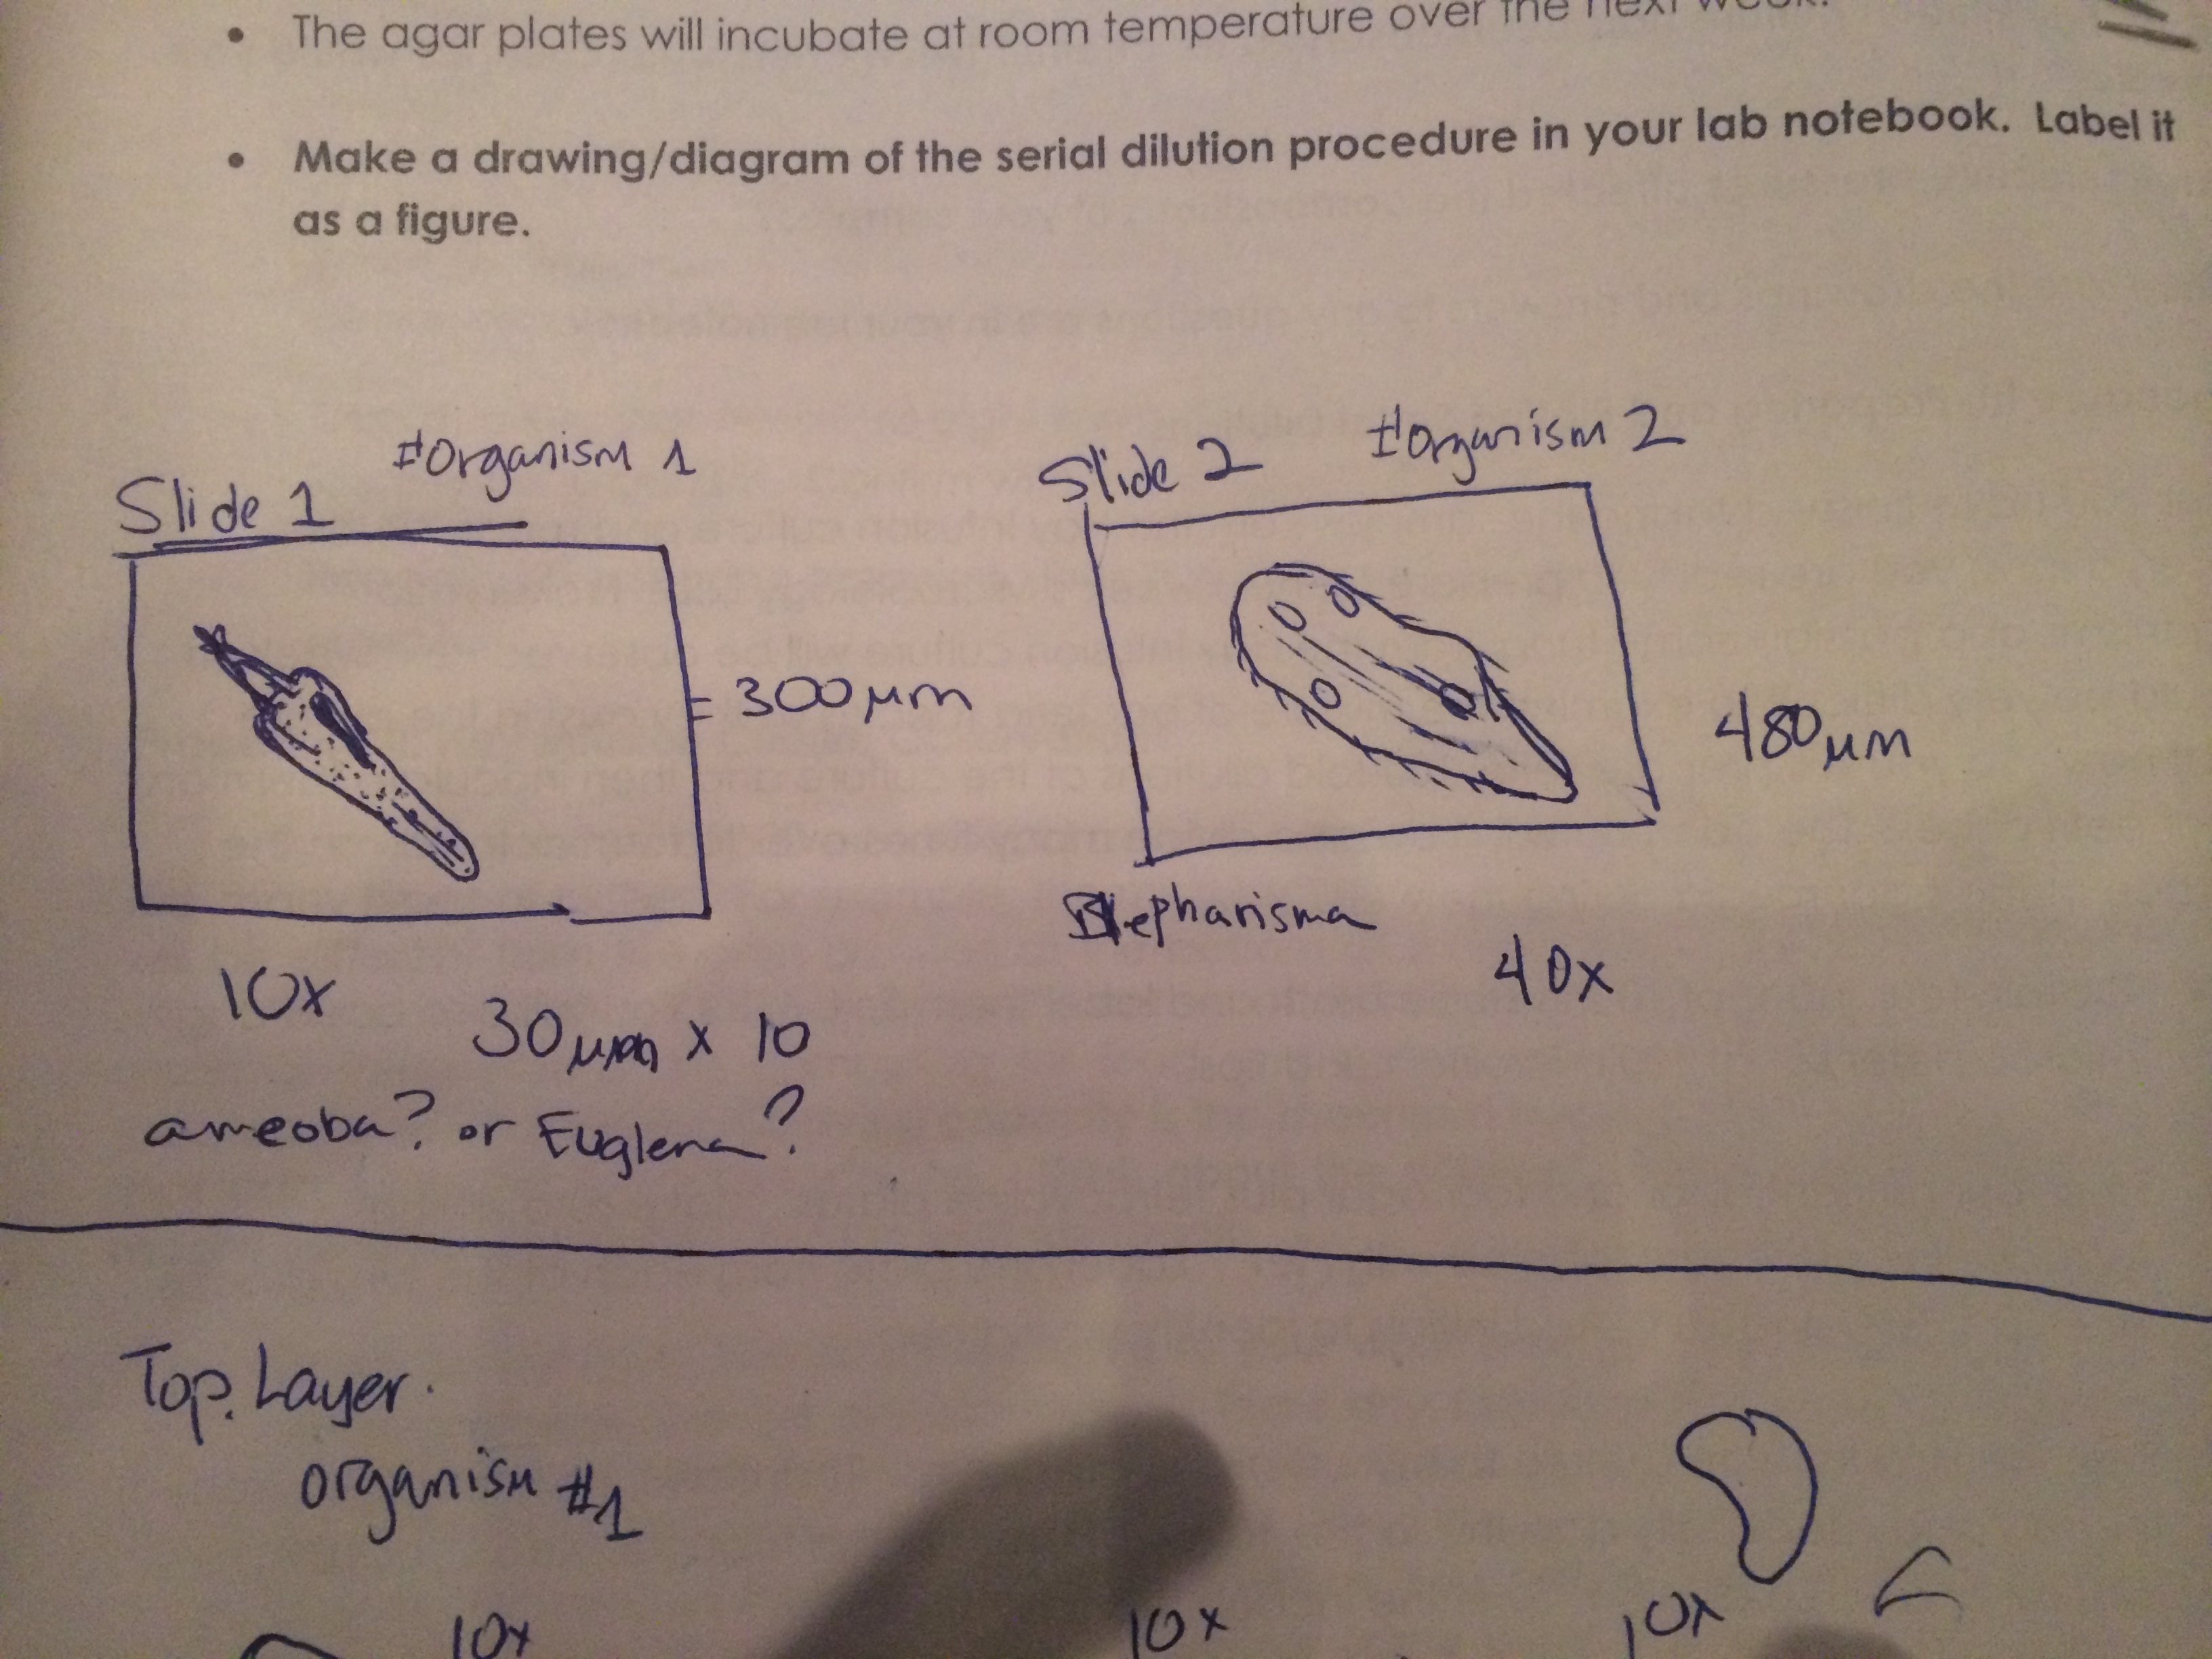 Figure 1. Sketch of two organisms, studied, identified, and measured
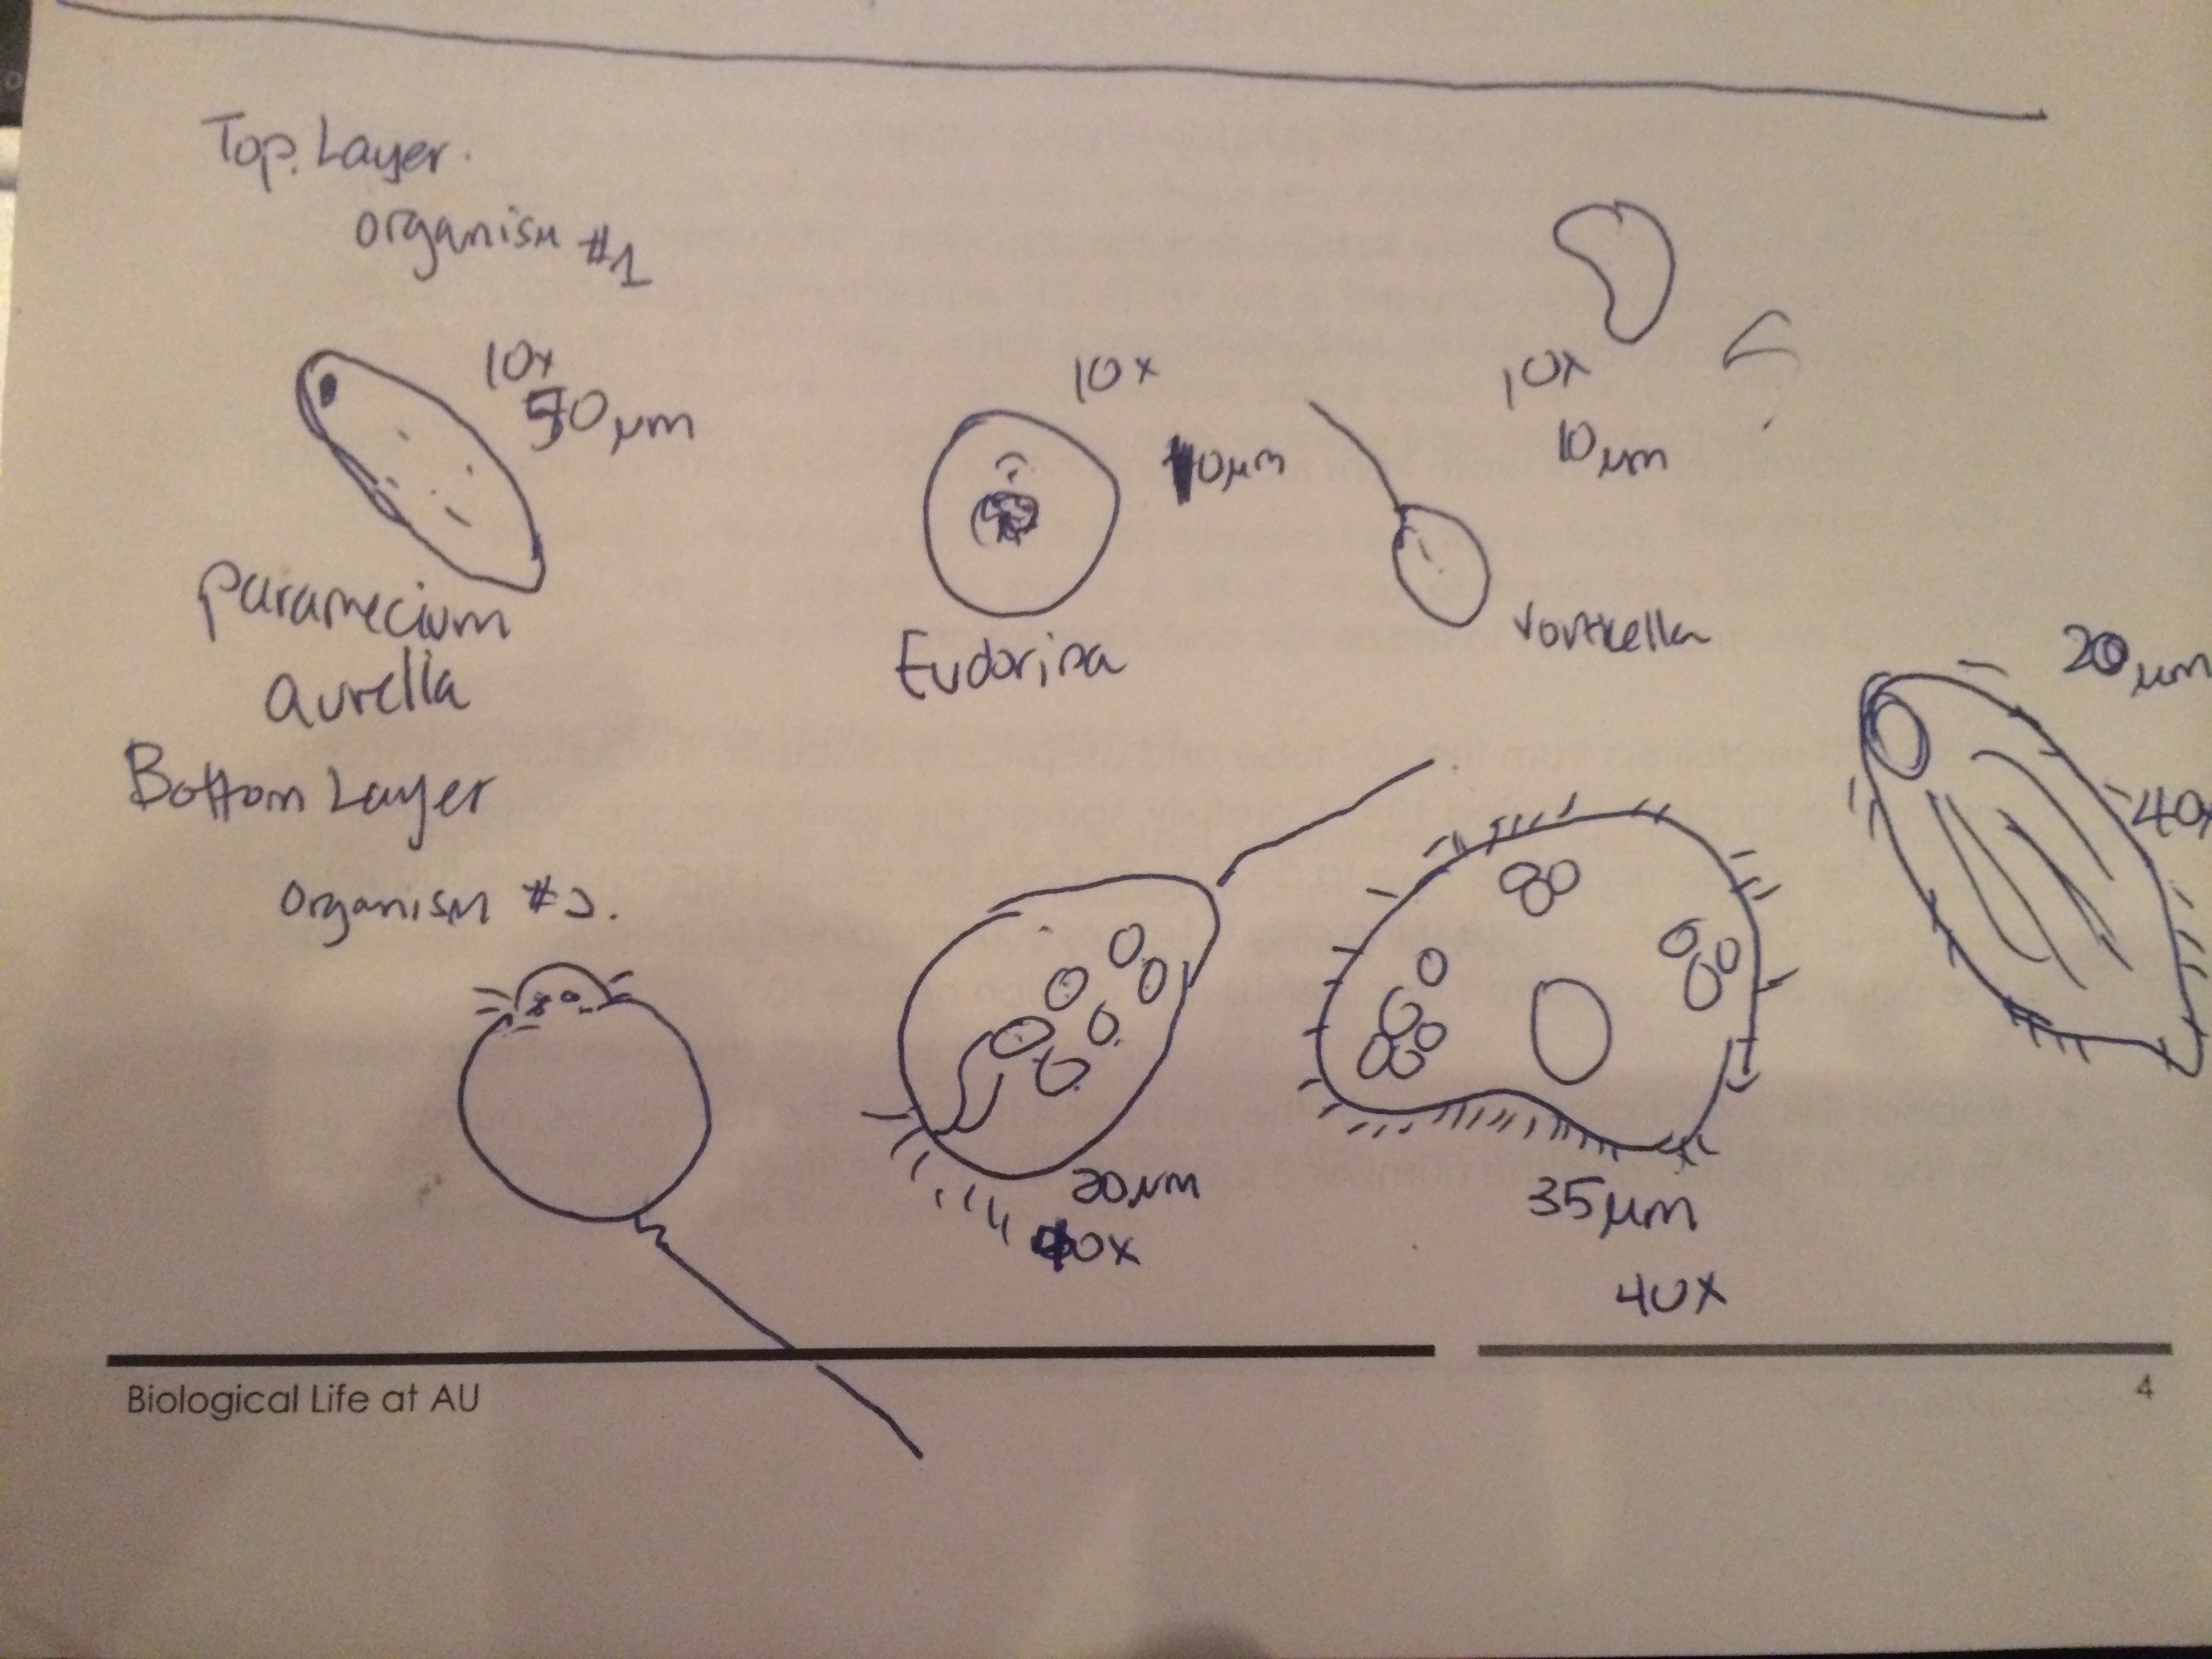 Figure 2. Sketch of two organisms found in the middle and top layer of the cultur
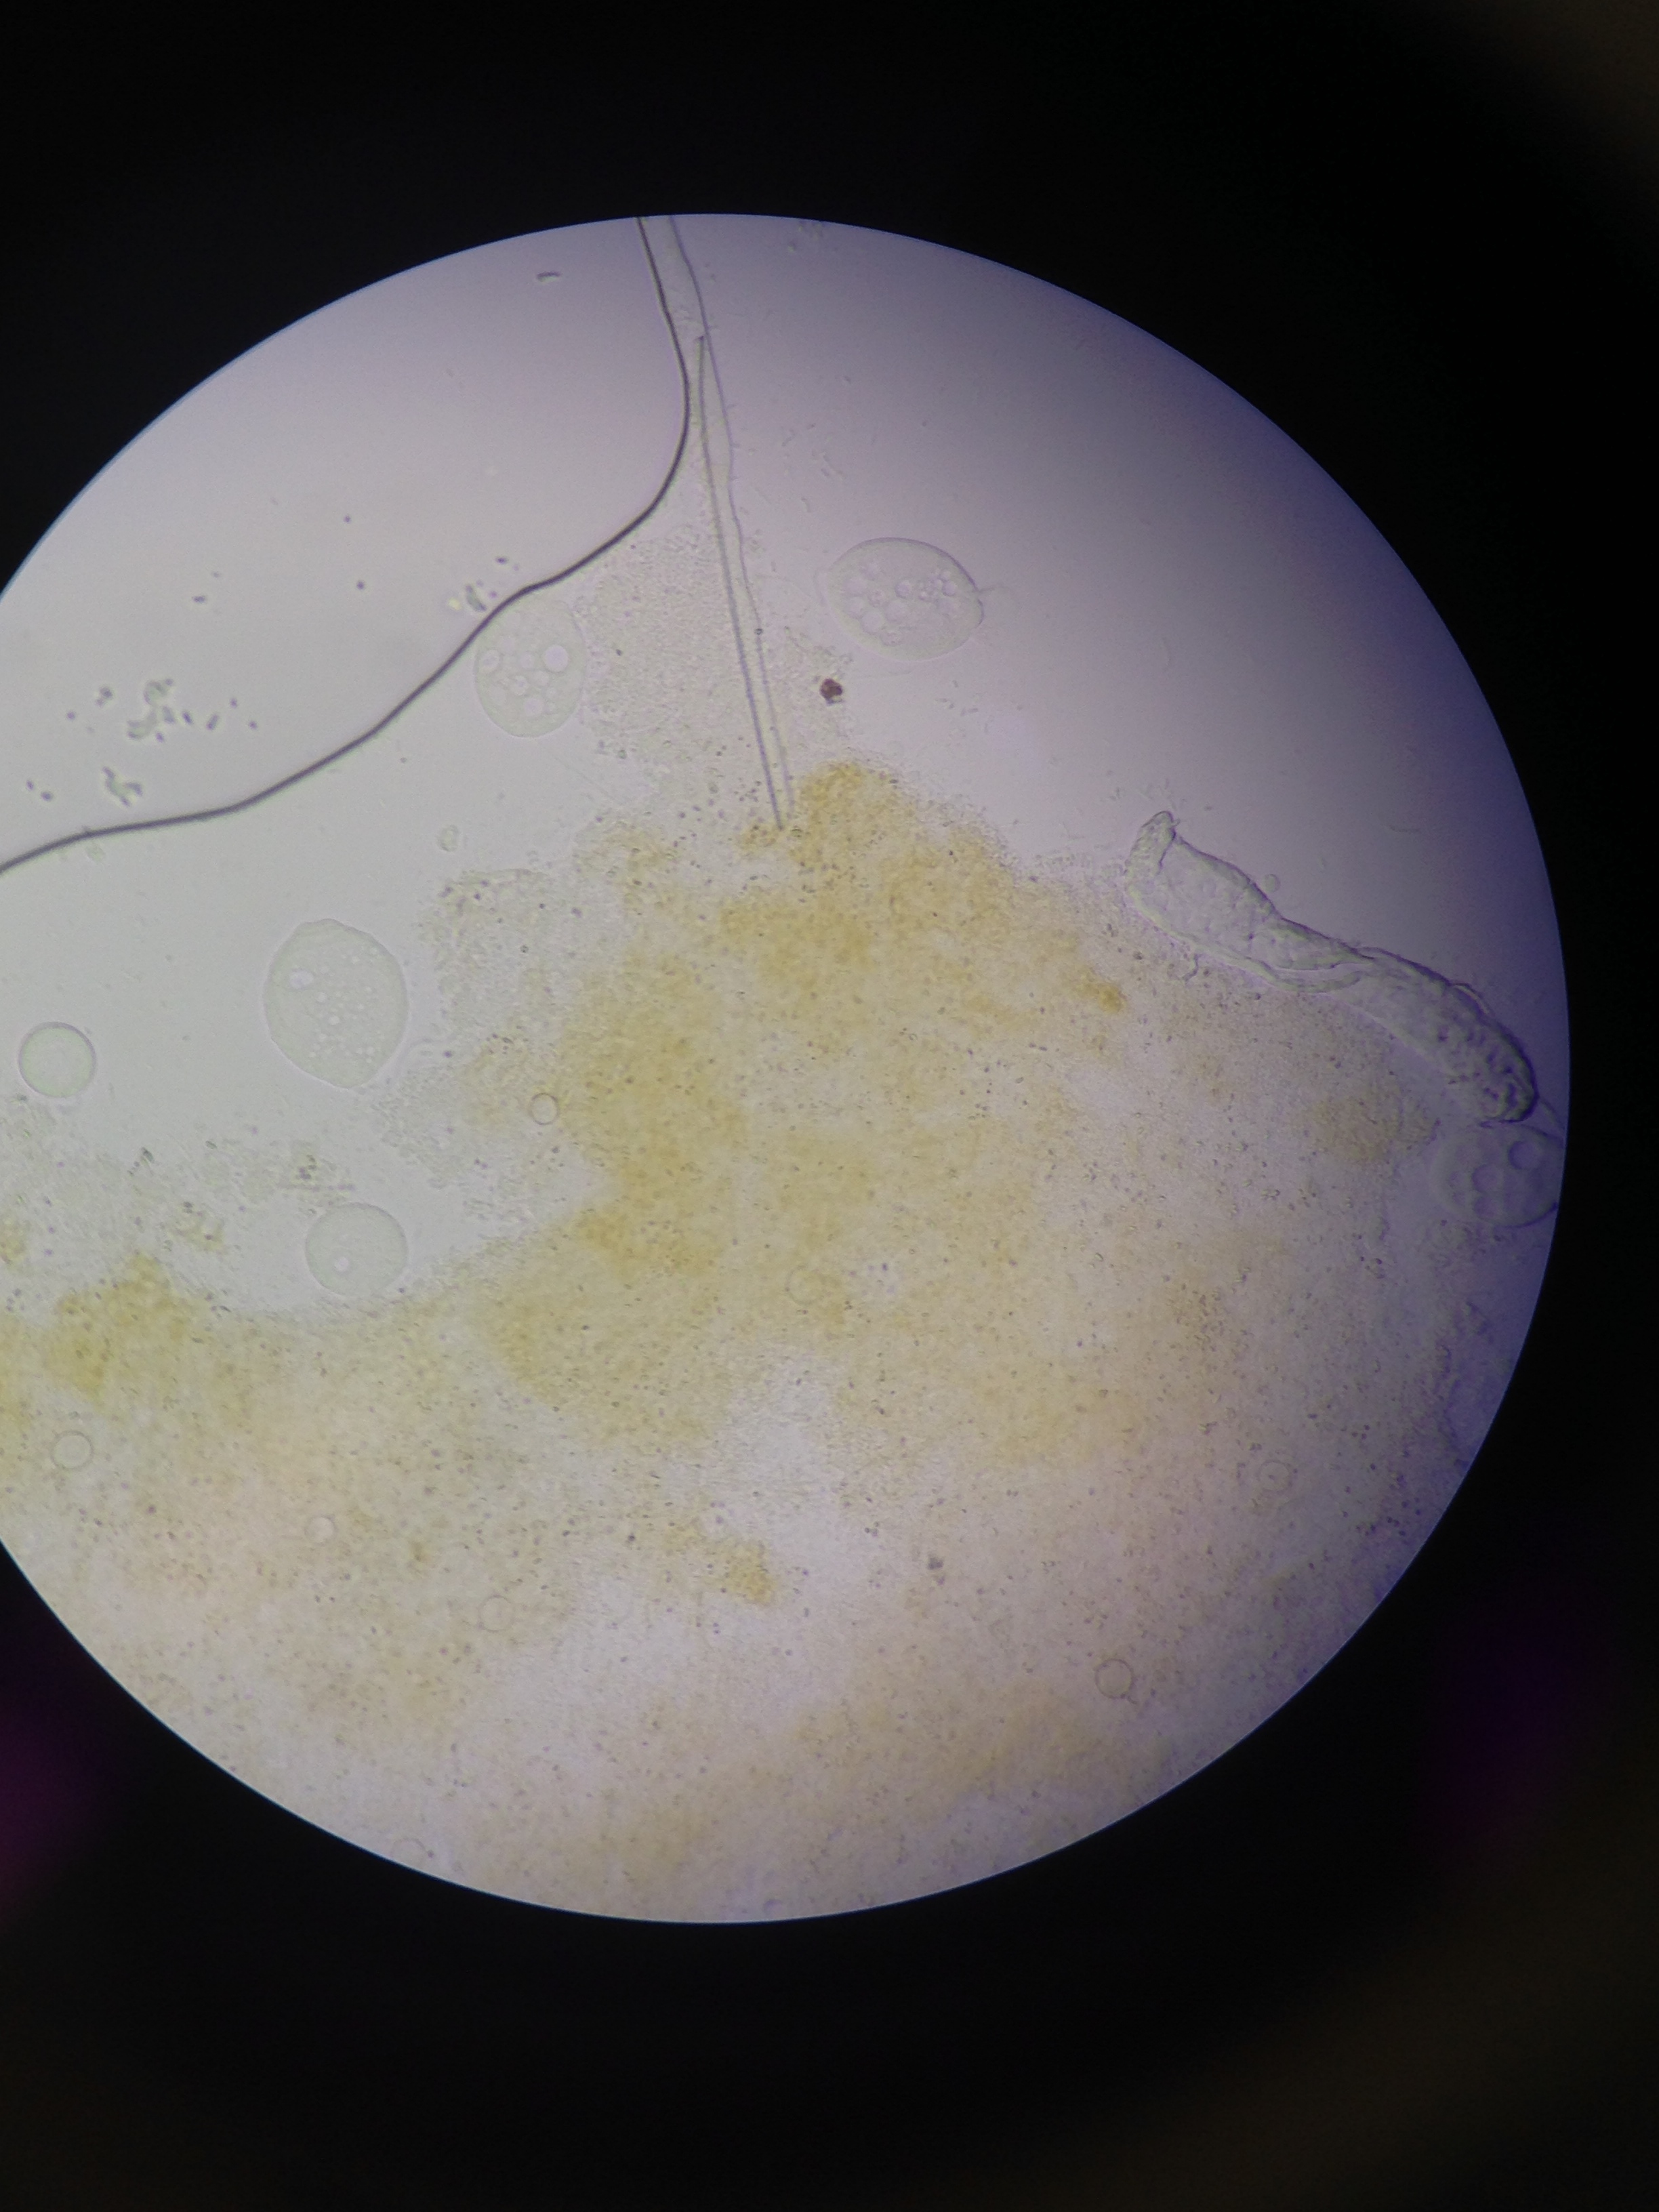 Figure 3. Microscope image of the organism found in the algae towards the middle/bottom layer of the culture
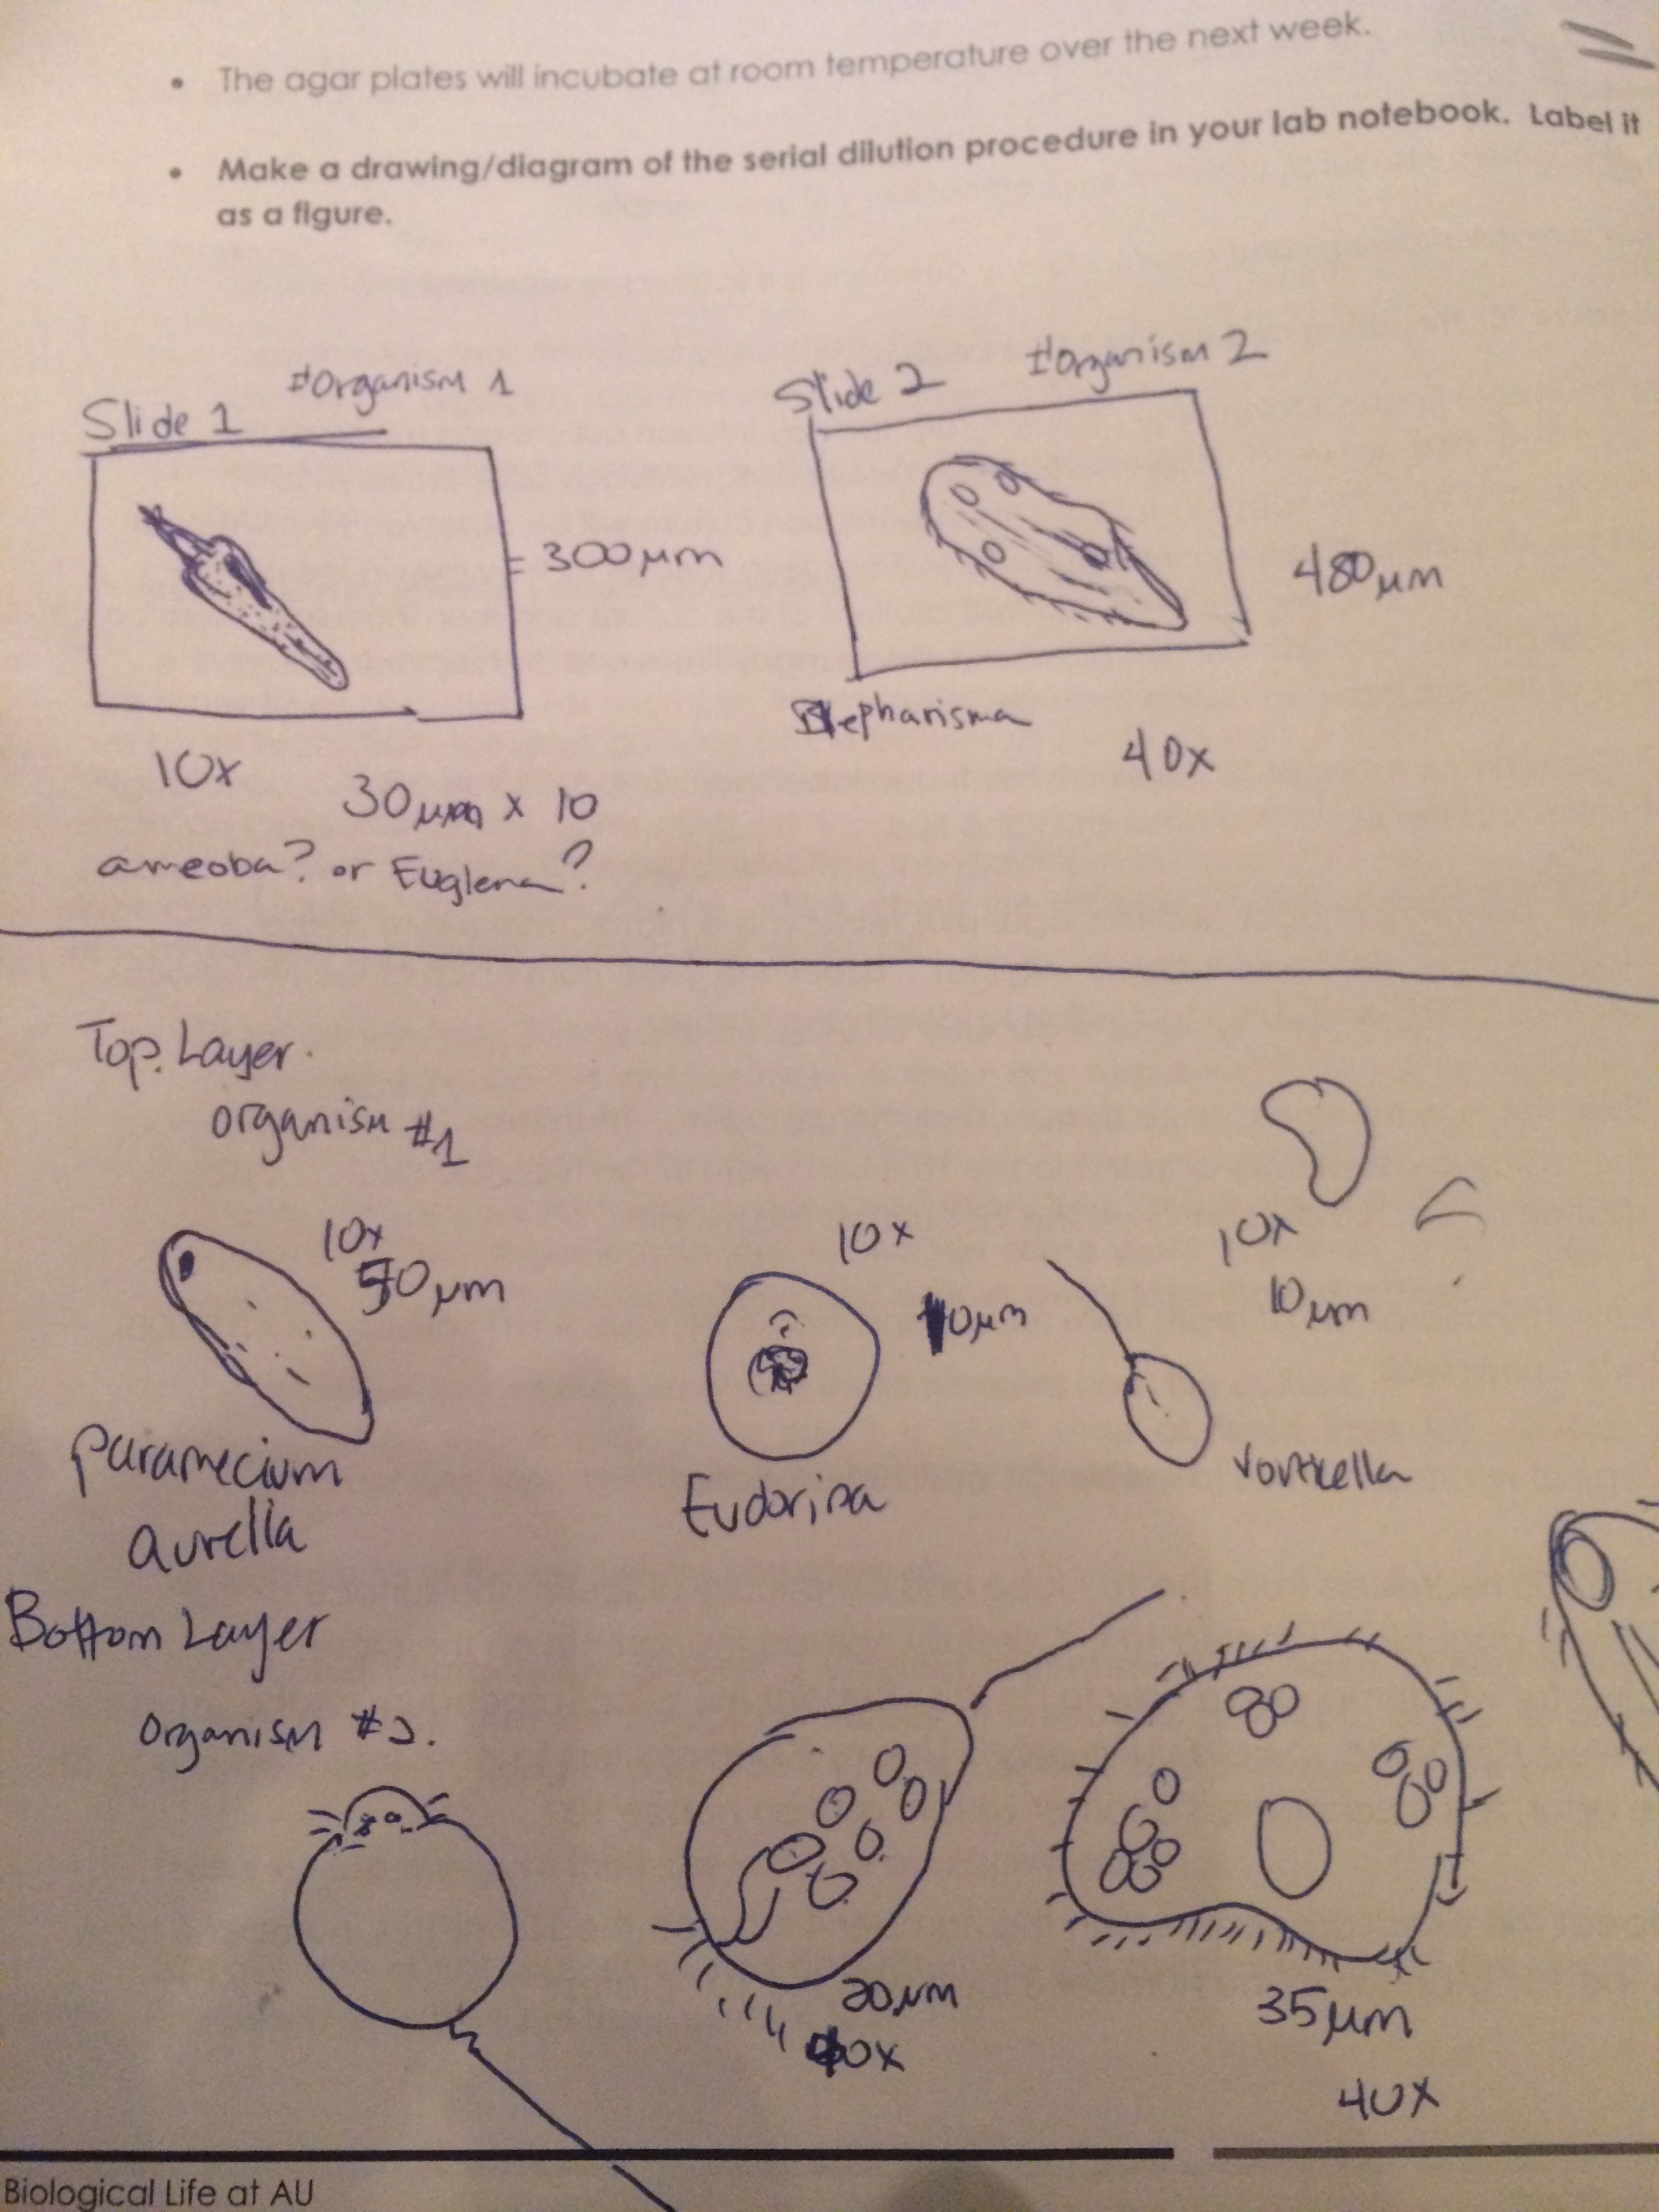 Figure4. Sketches of all the organisms found in the culture
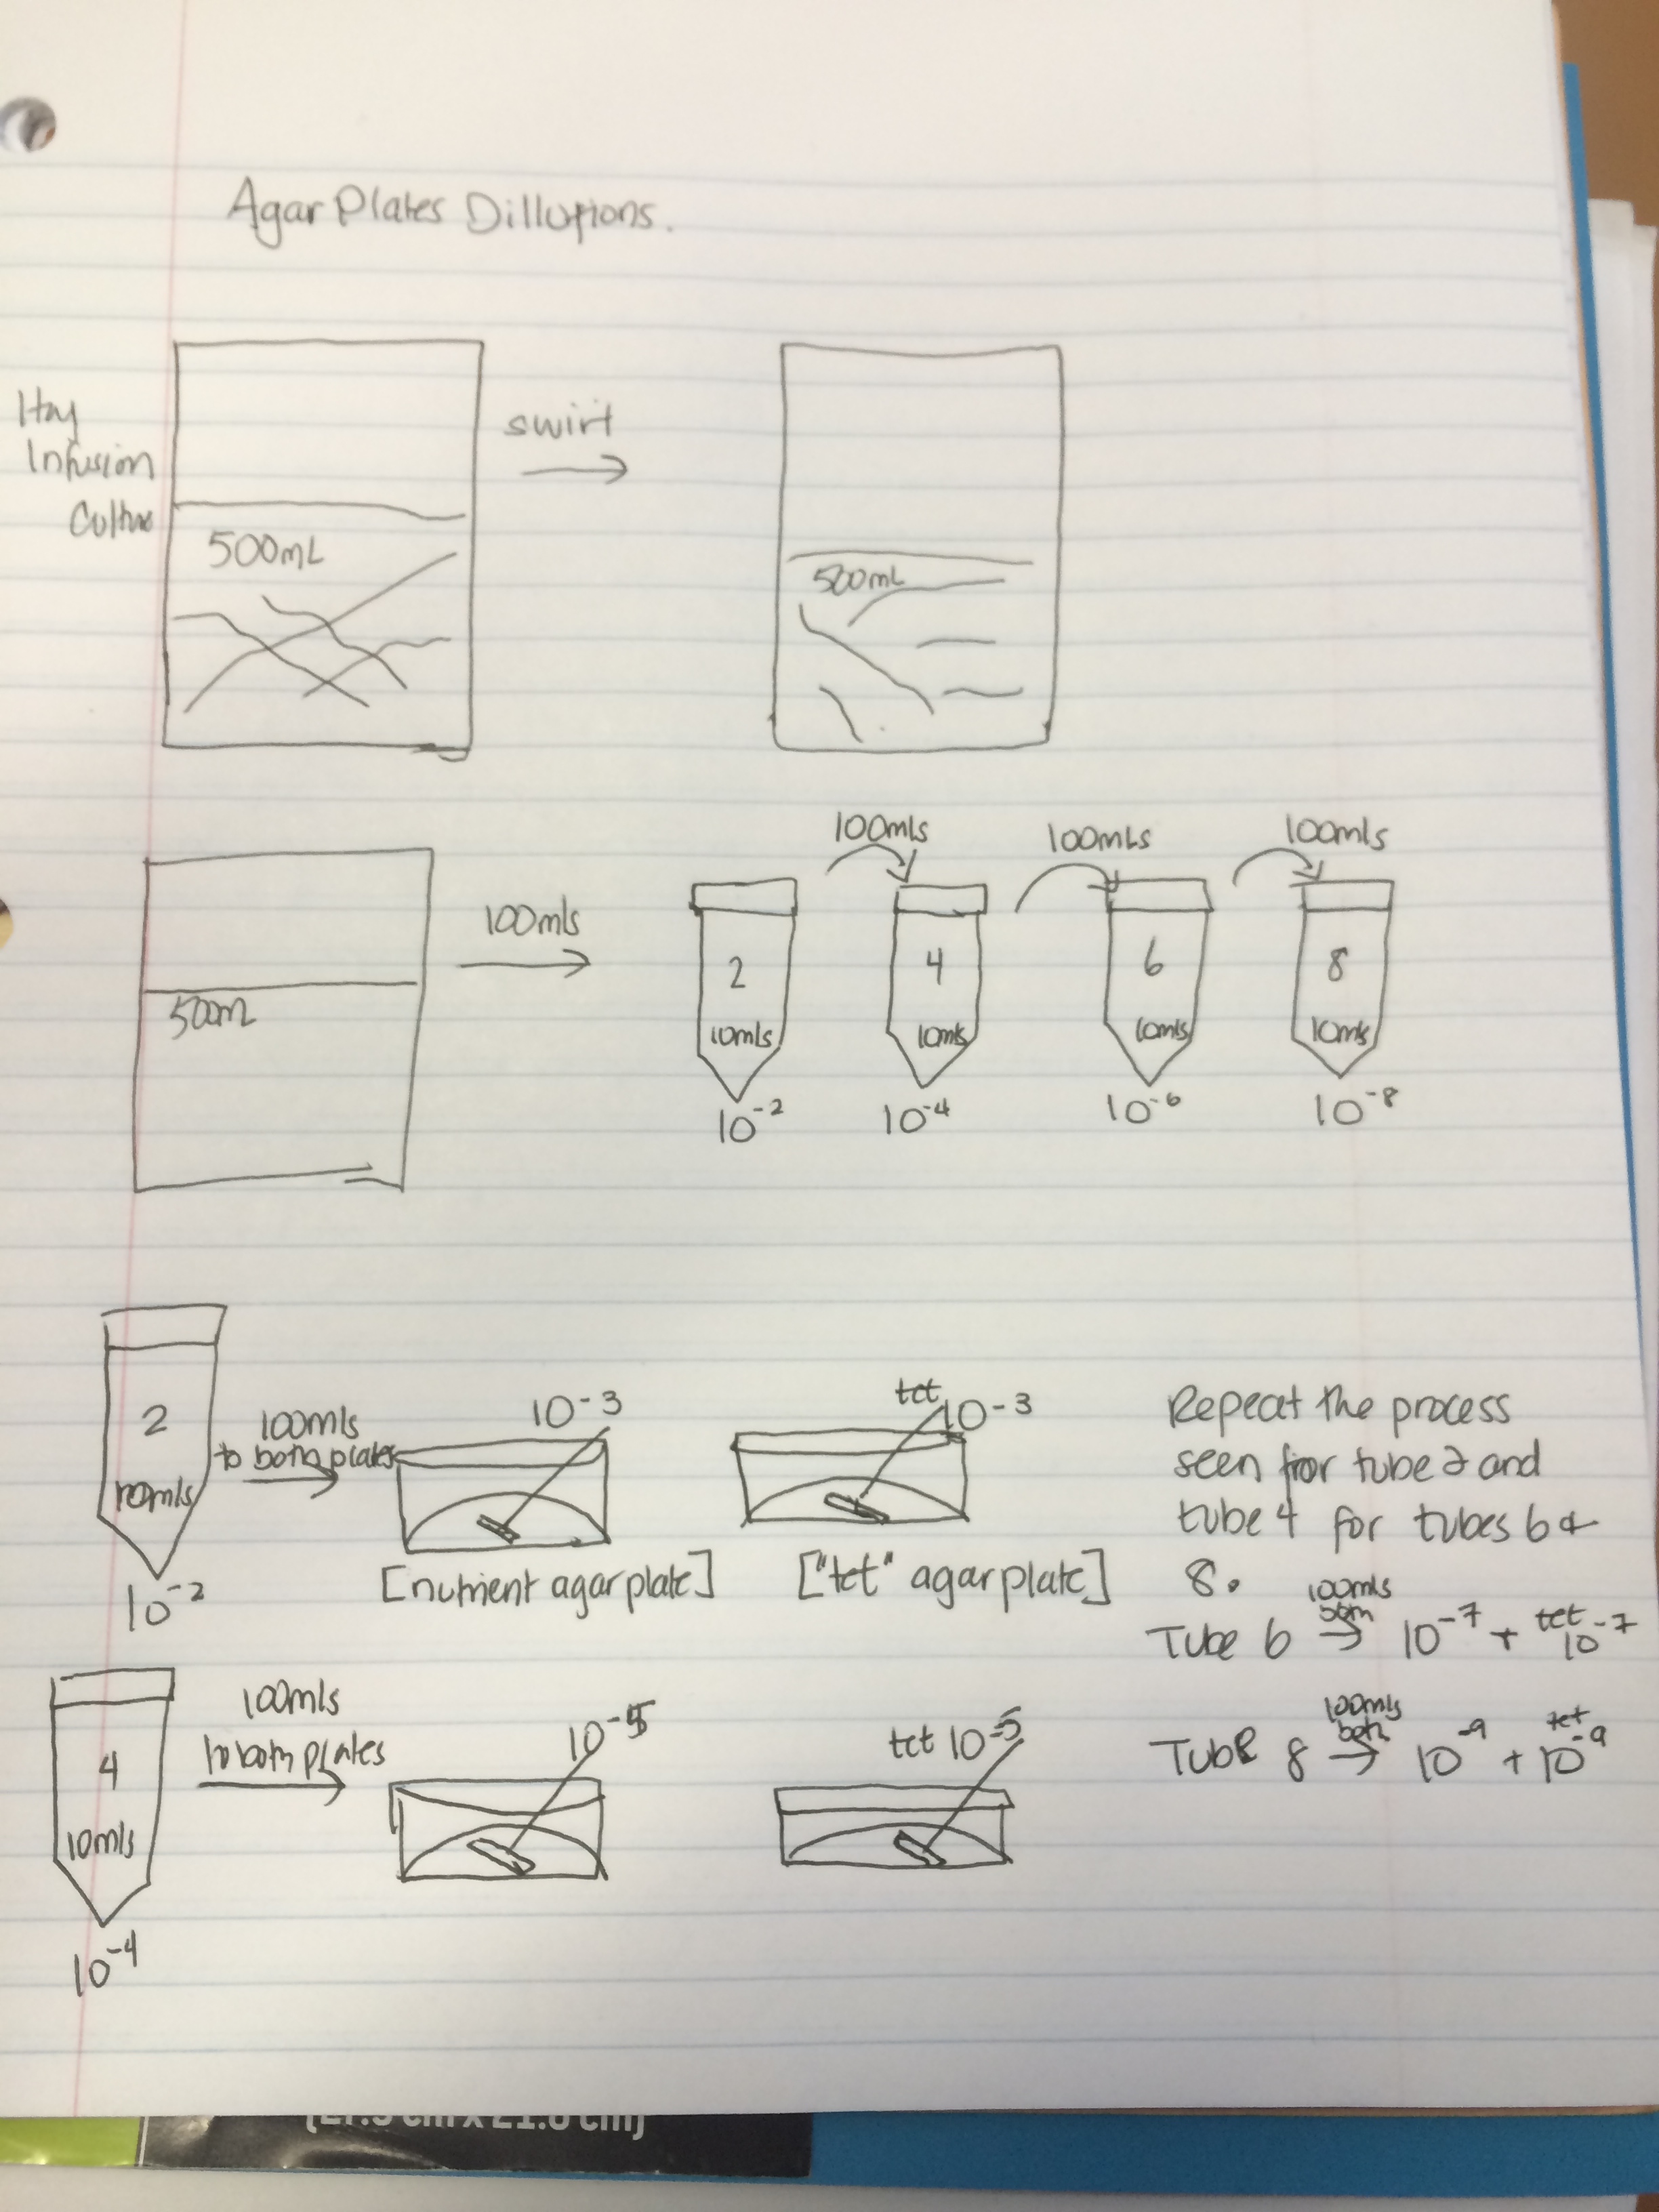 Figure 5. Sketch of the serial dilution process of the agar plates
Conclusion: From this lab our laboratory groups were able to identify unicellular and multicellular organisms and see some of the simplest eukaryotic cells on the planet. It is almost hard to believe that the complex cells that make up the human body could have shared an ancestry with a paramecium cell or amoeba. These organisms are the beginning of many food chains and play a larger role in our biosphere than most people can understand. The later half of the laboratory revisited Lab 1 using the hay infusion cultures created then to allow for further observation, primarily looking for bacterial organisms that might be antibiotic resistive. With many of the antibiotic medicine and chemicals that were washed down our kitchen/ bathroom drains to just being carelessly tossed onto the ground, it is no surprise that bacteria with the ability to gained the DNA information from anything they are exposed to and then capable of copying that information hundreds to millions of times would be worrisome. If our prepared agar plates contained tetracycline were to later to bacterial growth even the presence of this antibiotic, this is just a primarily example of how one of nature’s simplest organisms is also one of the smartest as well.
- Nii Mills 02:40, 19 March 2014 (EDT):
Lab 1 Lab conducted on January 14, 2014 Lab written on January 31, 2014
Introduction: In the Biological Life at AU Lab 1 report, the class was given the opportunity to study the progression of evolution simply through the use of slide and microscope, a much easier alternative than the research conducted by naturalists like Charles Darwin and Alfred Russell Wallace. Using sample of cells from the Volvocine Line (Chlamydomonas, Gonium, Volvox), the progression of a simple unicellular to complex multicellular organism could be observed and how they pertain to natural selection and in turn evolution. In the second half of the lab, groups of students ventured to designate areas of AU’s campus to see and identify niches containing biotic and abiotic individuals. Afterwards a sample of soil was taken specifically from Transect #1 to be later used in creating a hay infusion to further study bacterial development. From the two procedures, were made a hypothesis for each procedure.
Hypotheses: 1. If a simple cell increases in structure, then it will create enough complexity to demonstrate evolution. 2. If the transect is left untouched for the semester, then all the biotic and abiotic components should remain the same as initially recorded. Materials and Methods
Procedure I: Identifying Evolution in the Volvicine Line cells • Slides of Chlamydomonas, Gonium, Volvox cells were prepared and observed under a light microscope and with the additional help of protosol to reduce cell motility for better observation. • Various components we were made aware of during the portion of the lab: cell specialization primarily for reproduction and motility, cell size, colony size (if seen), and structure and function. Procedure II: Defining a Niche at AU Campus and its Characteristics • Group of students travel to 20x20 foot transect land on campus to look at these sectioned off ecosystems. For this lab Transect 1 located in a plot a corned area in front of Kogod and across the street from Katzen Art Center • Observed both biotic (living) and abiotic (nonliving) components, afterwards taking a sample of soil and ground vegetation in a 50 ml conical tube as representative of the niche • Created a hay infusion using soil sample from specifically Transect #1 for the purpose of creating a controlled environment with a source of nutrition for the continuation of cellular respiration a. 10grams of soil was prepared and placed in a plastic jar labeled Transect #1 b. Additionally 0.1 grams of dried milk and 500mls of Deerpark Water was combined with the soil to create a mixture of soil, milk, and niche soil.
Date and Observation
Procedure 1:Table 1
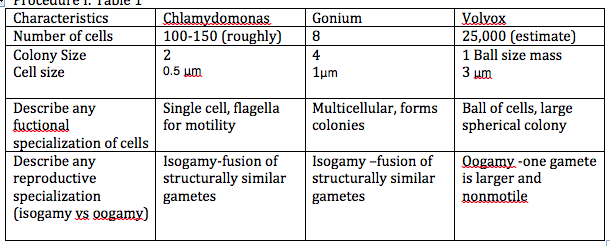
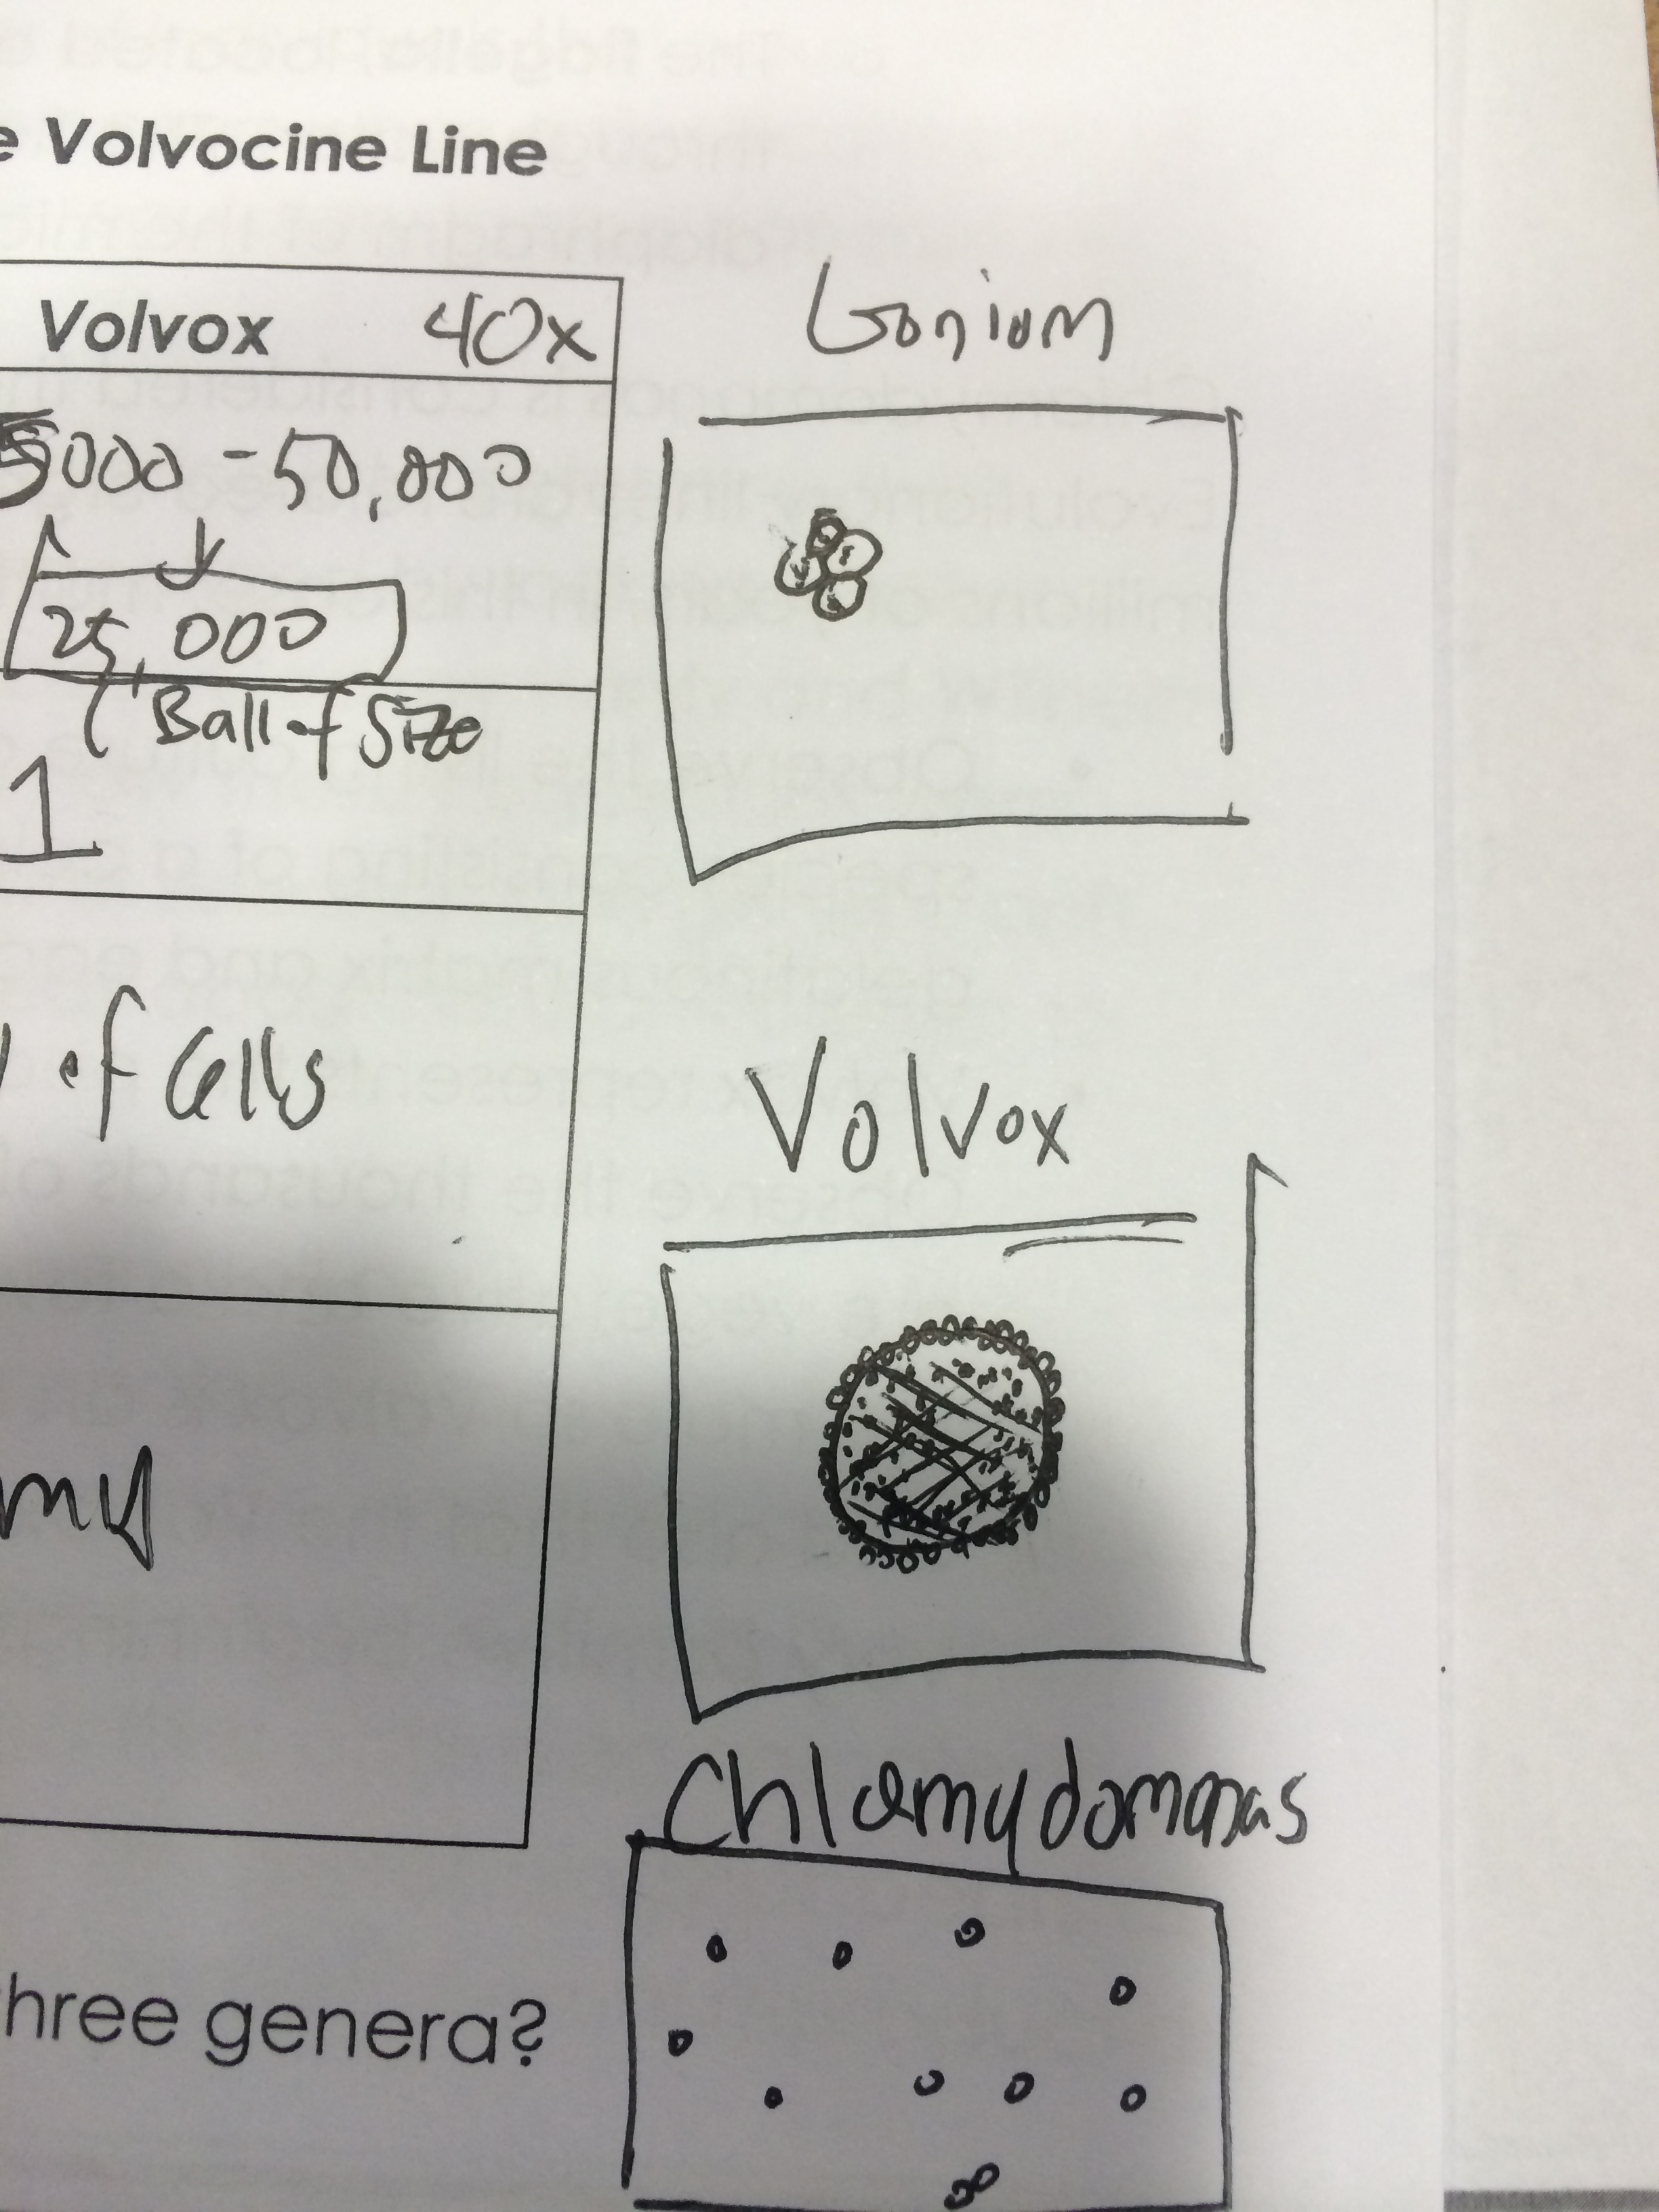
Figure 1: Drawing of the Volvocine Line: Gonium,Volvox, Chlamydomonas
The degree of specialization in each cell shows a linear progression of advancement, an example of evolution.
Procedure II: Defining a Niche at AU Observations and characteristics of Transect #1 • Soil sample was collected and used to create a hay fusion for future reports.
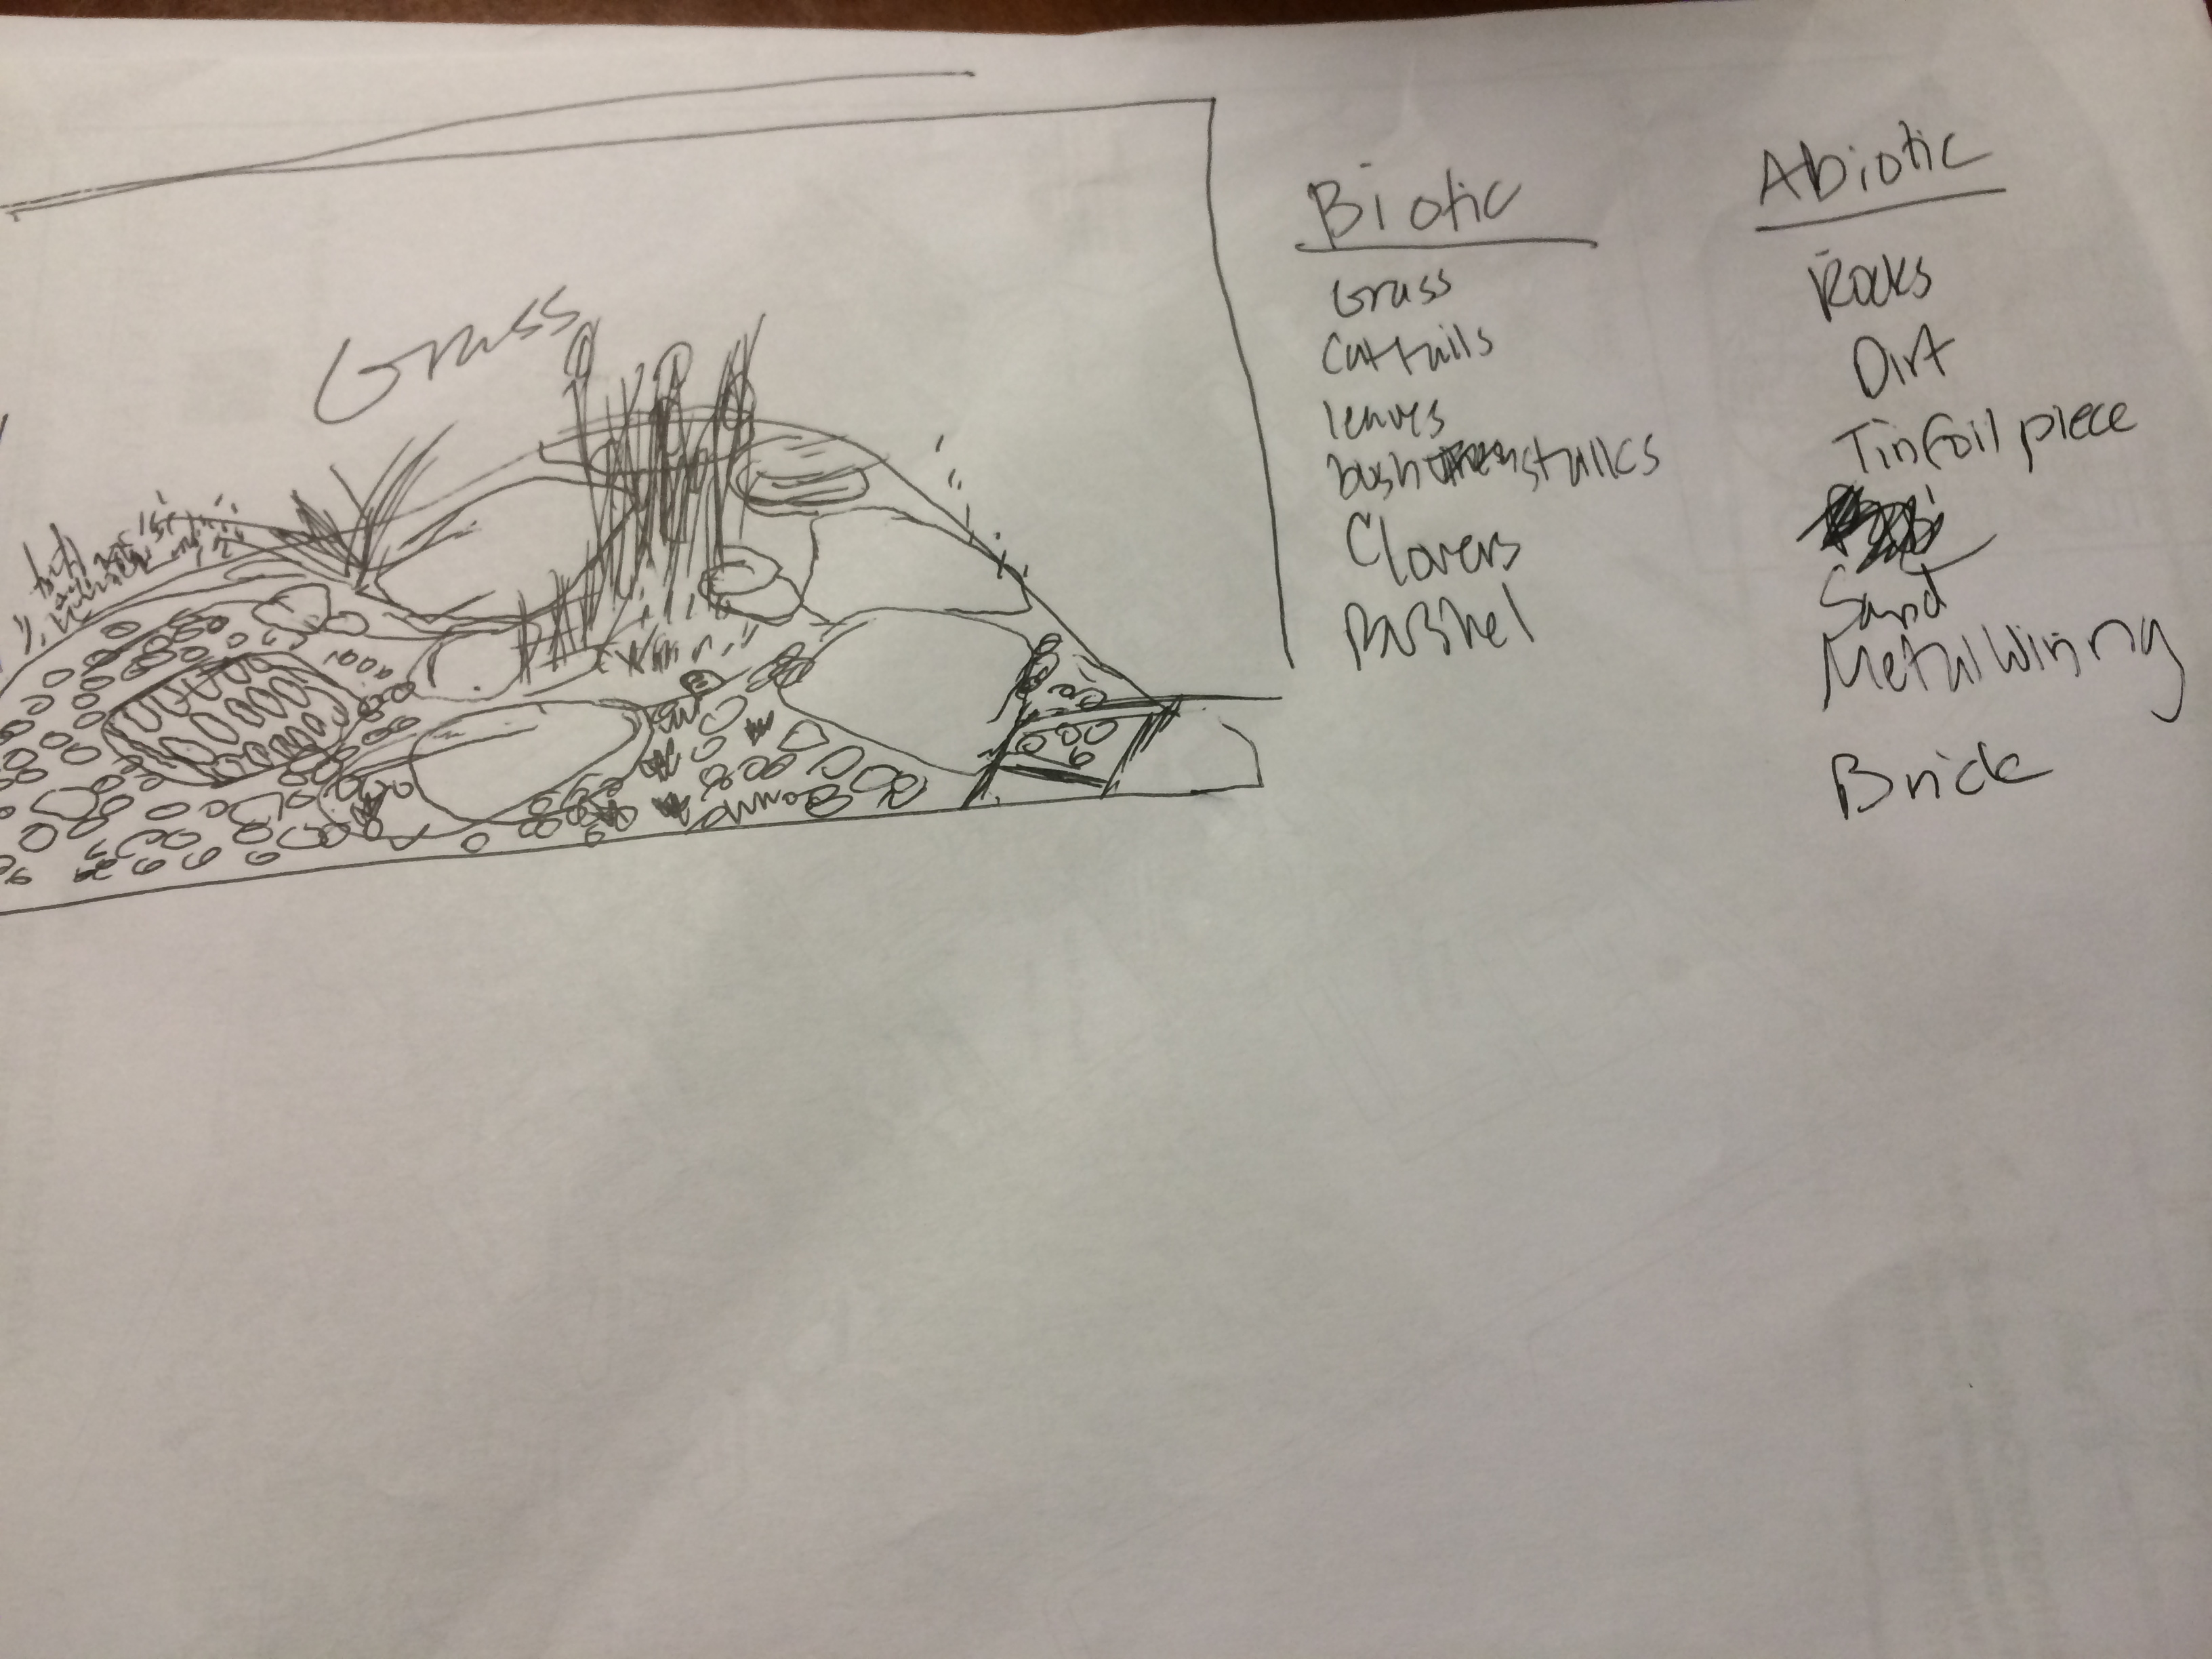
Figure 2: Drawing of Transect #1
Abiotic Components: 1. Rocks 2. Dirt 3. Tinfoil piece 4. Sand 5. Metal wiring 6. Brick Biotic Components: 1. Grasss 2. Cattails 3. Leaves 4. Bush stalks 5. Clovers 6. Bushel
Conclusion As the data gained from the laboratory shows, evolution occurred from the advancement of cells that contained favorable traits through natural selection and continued the development of organism from an ancestor seen through the observation of the volvocine line cells in procedure I. The specialization of structures within cells relates to its function, and its importance of these structures. Organisms become more efficient than the previous version, which is seen in volvocine cells with isogamy and then eventually oogamy contained cells for sexual reproduction. Then in the second half of the laboratory data and observations made on transect #1 gave an opportunity to understand and define a specific niche on AU’s campus noting the abiotic and biotic components of that niche. Lastly, only one hypothesis was truly confirmed, the one pertaining to the volvocine cell as seen through our observed data. However the hypothesis pertaining on niches has yet to proven until the end of the semester, and with an insufficient amount of information to use there is still room for error. For this reason the laboratory will be needed to be conducted again later in the semester to make sure the hypothesis is at all correct.
Very nice first lab description. Well structured and good explanation of context of lab and work undertaken. SK
