User:Kaylee A. Hillard/Notebook/Biology 210 at AU
""March 23, 2016""
Analyzing the Effects of Various Concentrations of Nicotine on Hatching Zebrafish February 27, 2016
Purpose: The purpose of this experiment was to examine the effects of varying concentration levels of nicotine on zebrafish embryos, in order to relate and apply the findings to human embryos exposed to nicotine from mothers who smoke.
Materials and Methods: Day 1: Experimental Design The experimental design of the lab was developed. It was decided that 24 zebrafish would each be placed in their own well, with two sets of four wells each holding a specified concentration. Eight zebrafish were to be placed in the first eight wells containing just water, representing the control group. Eight fish were to be placed in the second eight wells in a 10 g/mL concentration of nicotine, and eight were to be placed in the final 8 wells in a 40 g/mL concentration. Finally, it was decided that stimuli response, body length, body shape, eye size, motility, and mortality of the fish would be examined over the following two weeks. Once the concentrations were determined, they were made and placed in the respective wells. The first two sets of wells were filled with Deer Park water. The last two sets of wells were filled with a 40 g/mL nicotine concentration that had been pre-made for the experiment. The 10 g/mL solution was made by completing a serial dilution using the 40 g/mL nicotine concentration.
Day 3: Observations of fish were taken. The ages of the fish in all concentrations were approximated, as well as the stage of life in those that showed signs of noticeable development. Finally, the number of fish dead was recorded.
Day 6: Observations of fish were taken. The age was approximated, and since the fish had started to hatch, stimuli response, body length and shape, eye size, motility, and mortality were all recorded. When recording they body and eye size, one fish was chosen from the control and one from the treatment group to represent the rest of the fish. Along with these measurements, the lingering egg casings were pipetted out of the well and each fish was fed 15 microliters of shrimp brine.
Day 7: Each step that was conducted on Day 6, was conducted on this day as well. Along with those steps, 2 fish were preserved for later examination. The fish that were chosen had distinct features that were results from the nicotine concentrations. To preserve, the fish were placed in a small tube with a lid and a small amount of a tricaine solution was added so the fish was covered in order to anesthetize them. Then, after approximately 3 minutes, enough paraformaldehyde was added to make the tube half full with liquid, in order to completely preserve the fish. The mixture was mixed for a few seconds and then labeled to note the fish, date, and concentration.
Day 12: Observations were made about the remaining fish and their size, shape, etc. were recorded. The remains and disintegrating fish were disposed of in their respective waste receptacles, and the remaining fish were preserved using the same steps seen in Day 7.
Days 3, 7, and 12, were the most important days to observe the fish so those were the days that data was collected. On the days in between, the fish were maintained by getting fed each day with 15 microliters of shrimp brine.
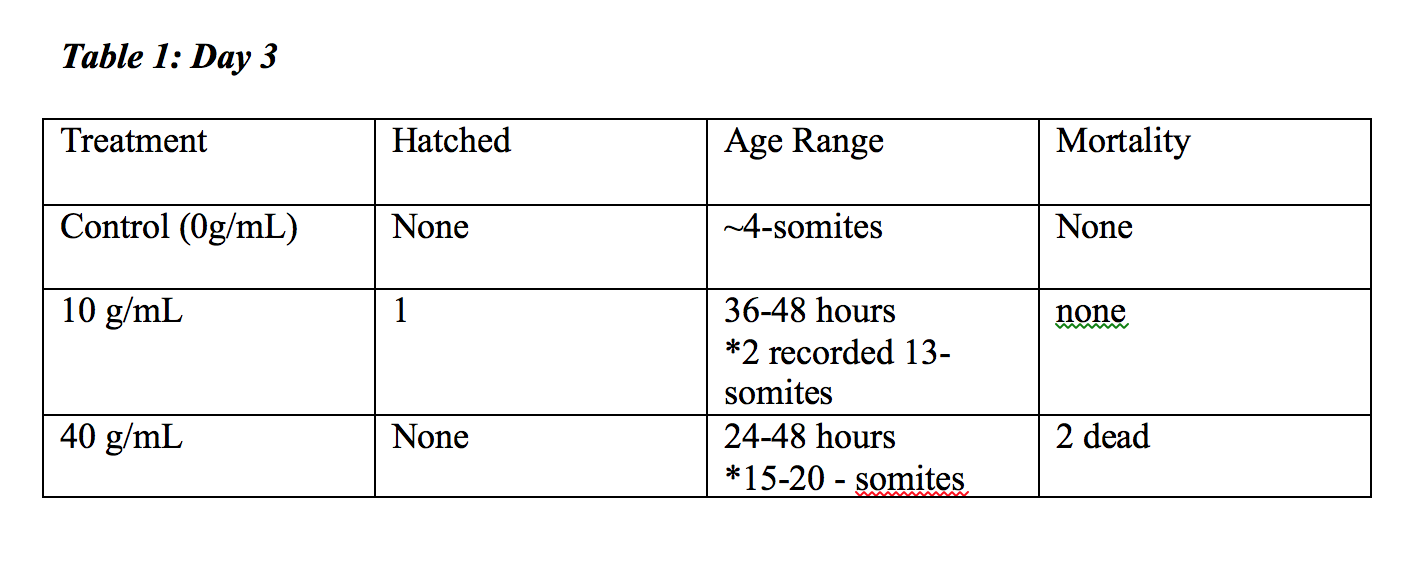
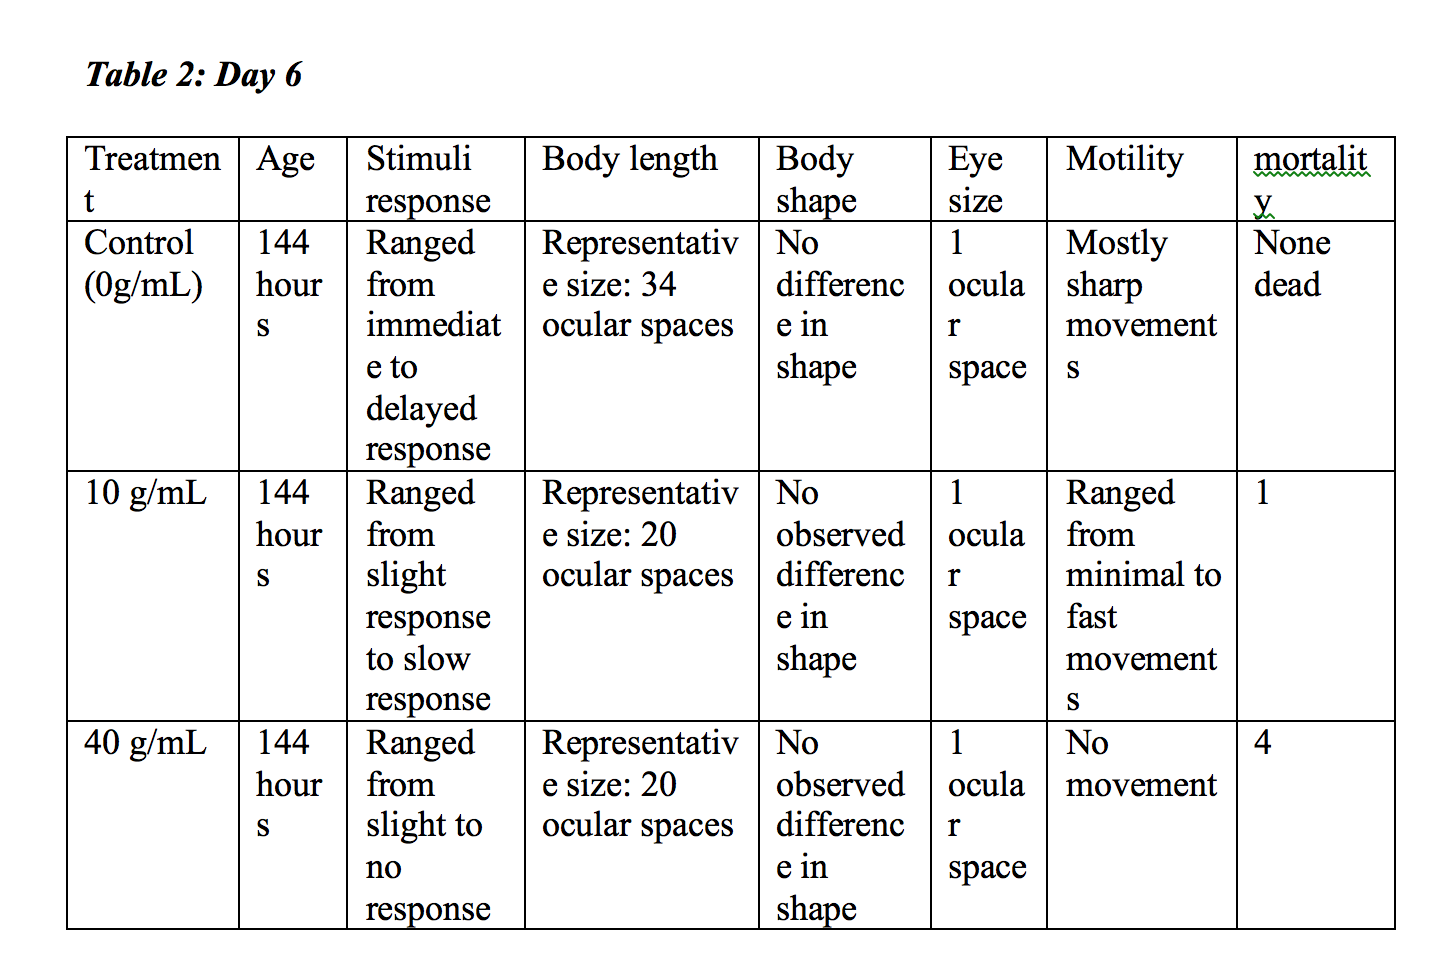
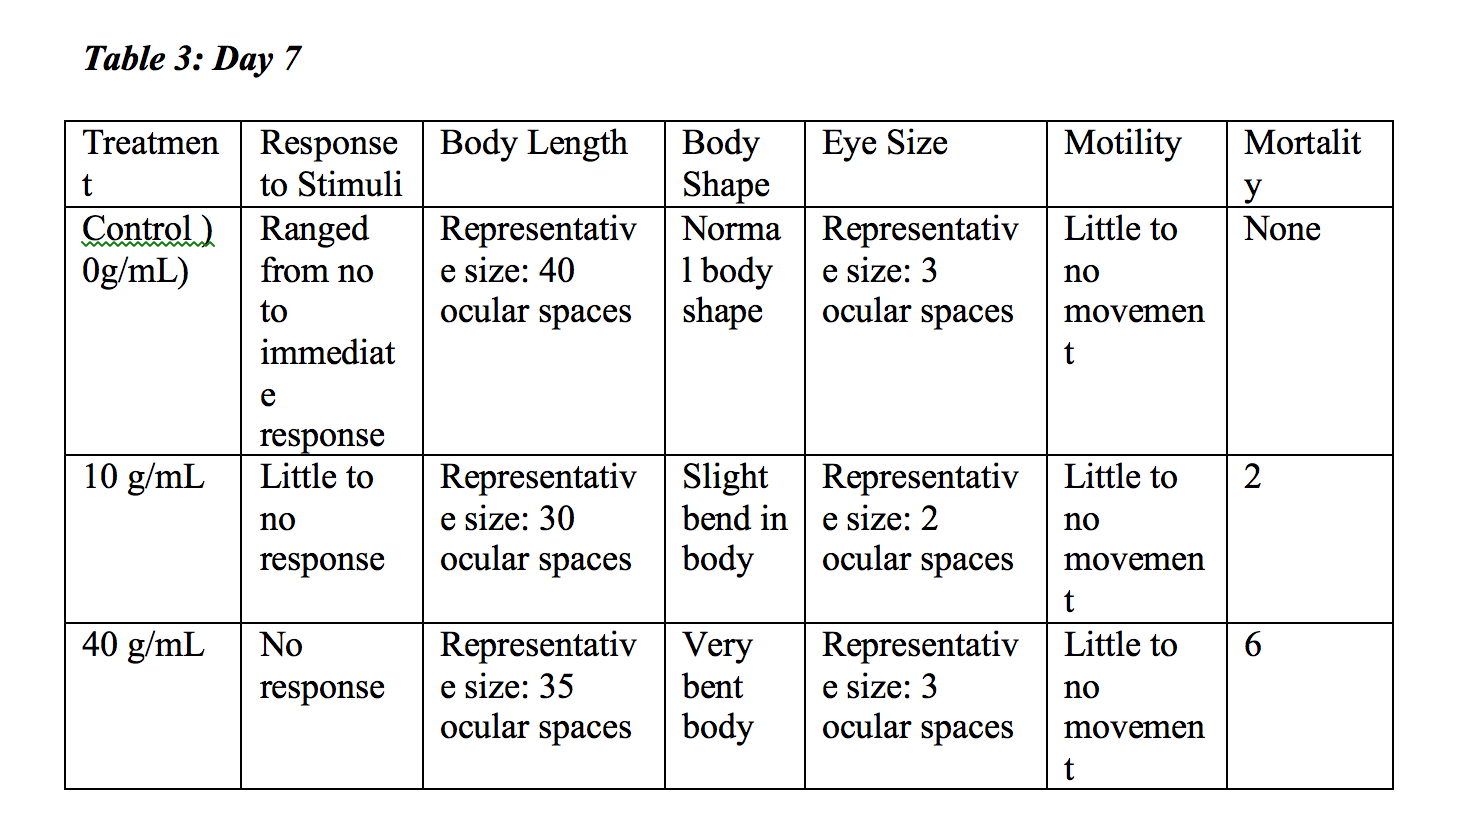
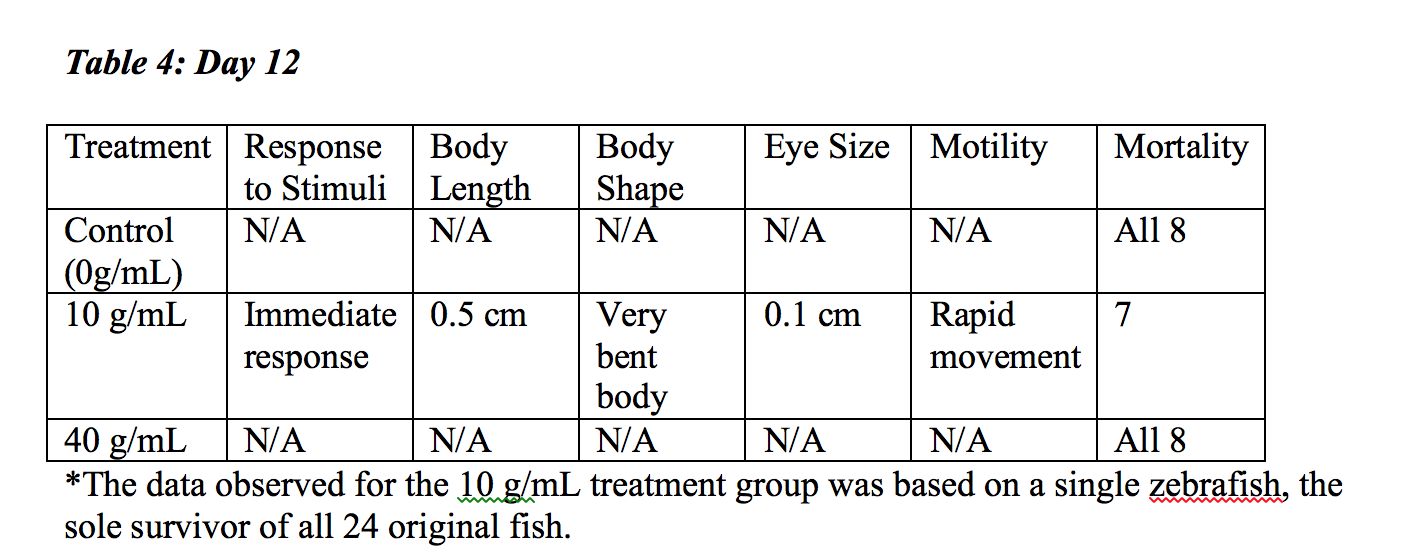
Data and Observations: This experiment was done in order to observe the effects of various nicotine concentrations, including 0 g/mL, 10 g/mL, and 40 g/mL, on zebrafish who were fertilized within the respective environment. All of the fish were observed in each concentration for changes in their size, body shape, eye size, and body length. Along with these morphological features, the initial days measured the approximate age as well. Table 1, depicting the observations of Day 3 reveals that one fish had hatched in the low nicotine concentration, and the rest of the fish were aged to be anywhere from 36 to 48 hours old, with 2 dying in just the third day. Observations taken on Day 6, which can be seen in Table 2, reveal that as the concentration of nicotine increased, the response to stimuli and overall movement of the fish decreased. It can also be inferred that the nicotine affected the treatment body shape, and therefore length, in that it was found to be 14 ocular spaces less than the control group in length. It was found that at this point, the control and treatment fish both had similar sized eyes. The mortality rate had continued to increase at this point, and it was heavily prevalent in the highest nicotine concentration. Day 7 revealed more deaths within both the highest nicotine concentration, but also the 10 g/mL concentration as well, which can be seen in Table 3. On this day, it was also, strangely, observed that the movement in all three concentrations almost none existent. Aside from a few fish in each concentration, the majority were not moving and had little response to stimuli. At this point, it was calculated that 9 fish were dead total. Finally, shown in Table 4, Day 12 produced the most drastic results in that 23 of the 24 original zebrafish had died and the only surviving fish was in a 10 g/mL nicotine concentration well. It was found to be moving very well and had a quick response to stimuli, but it had a very bent body and large eyes.
Figure 1
a.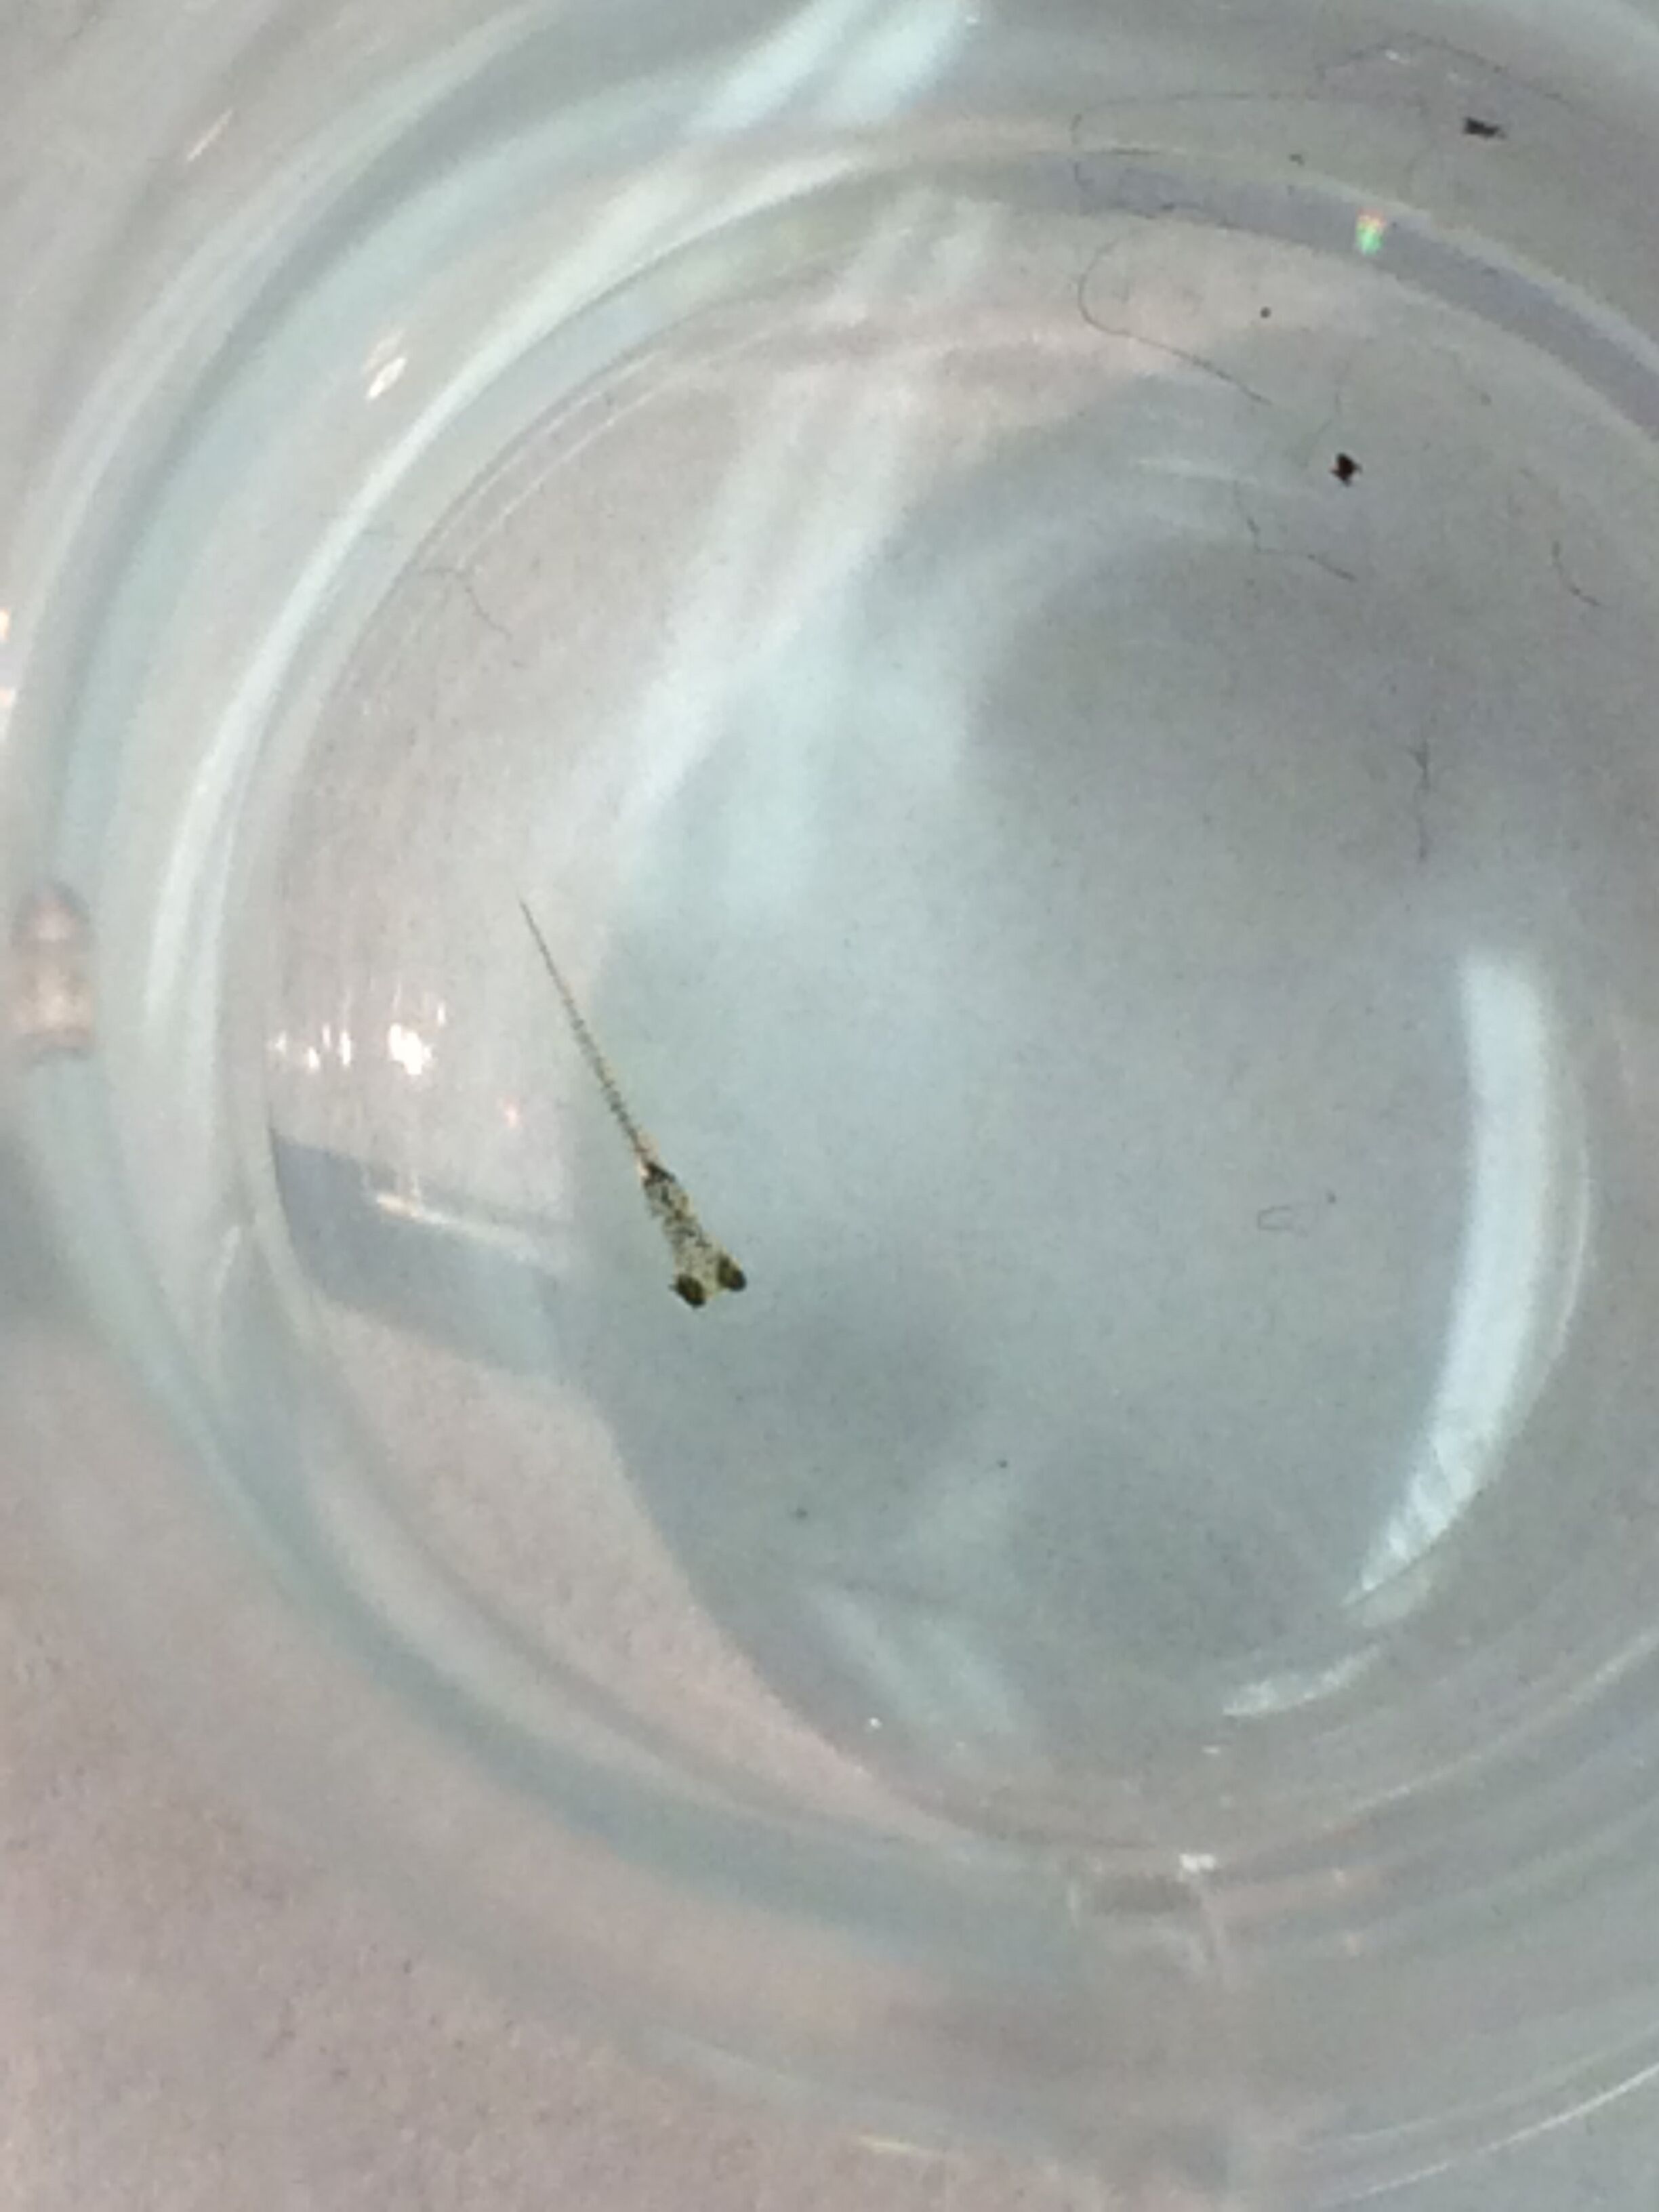
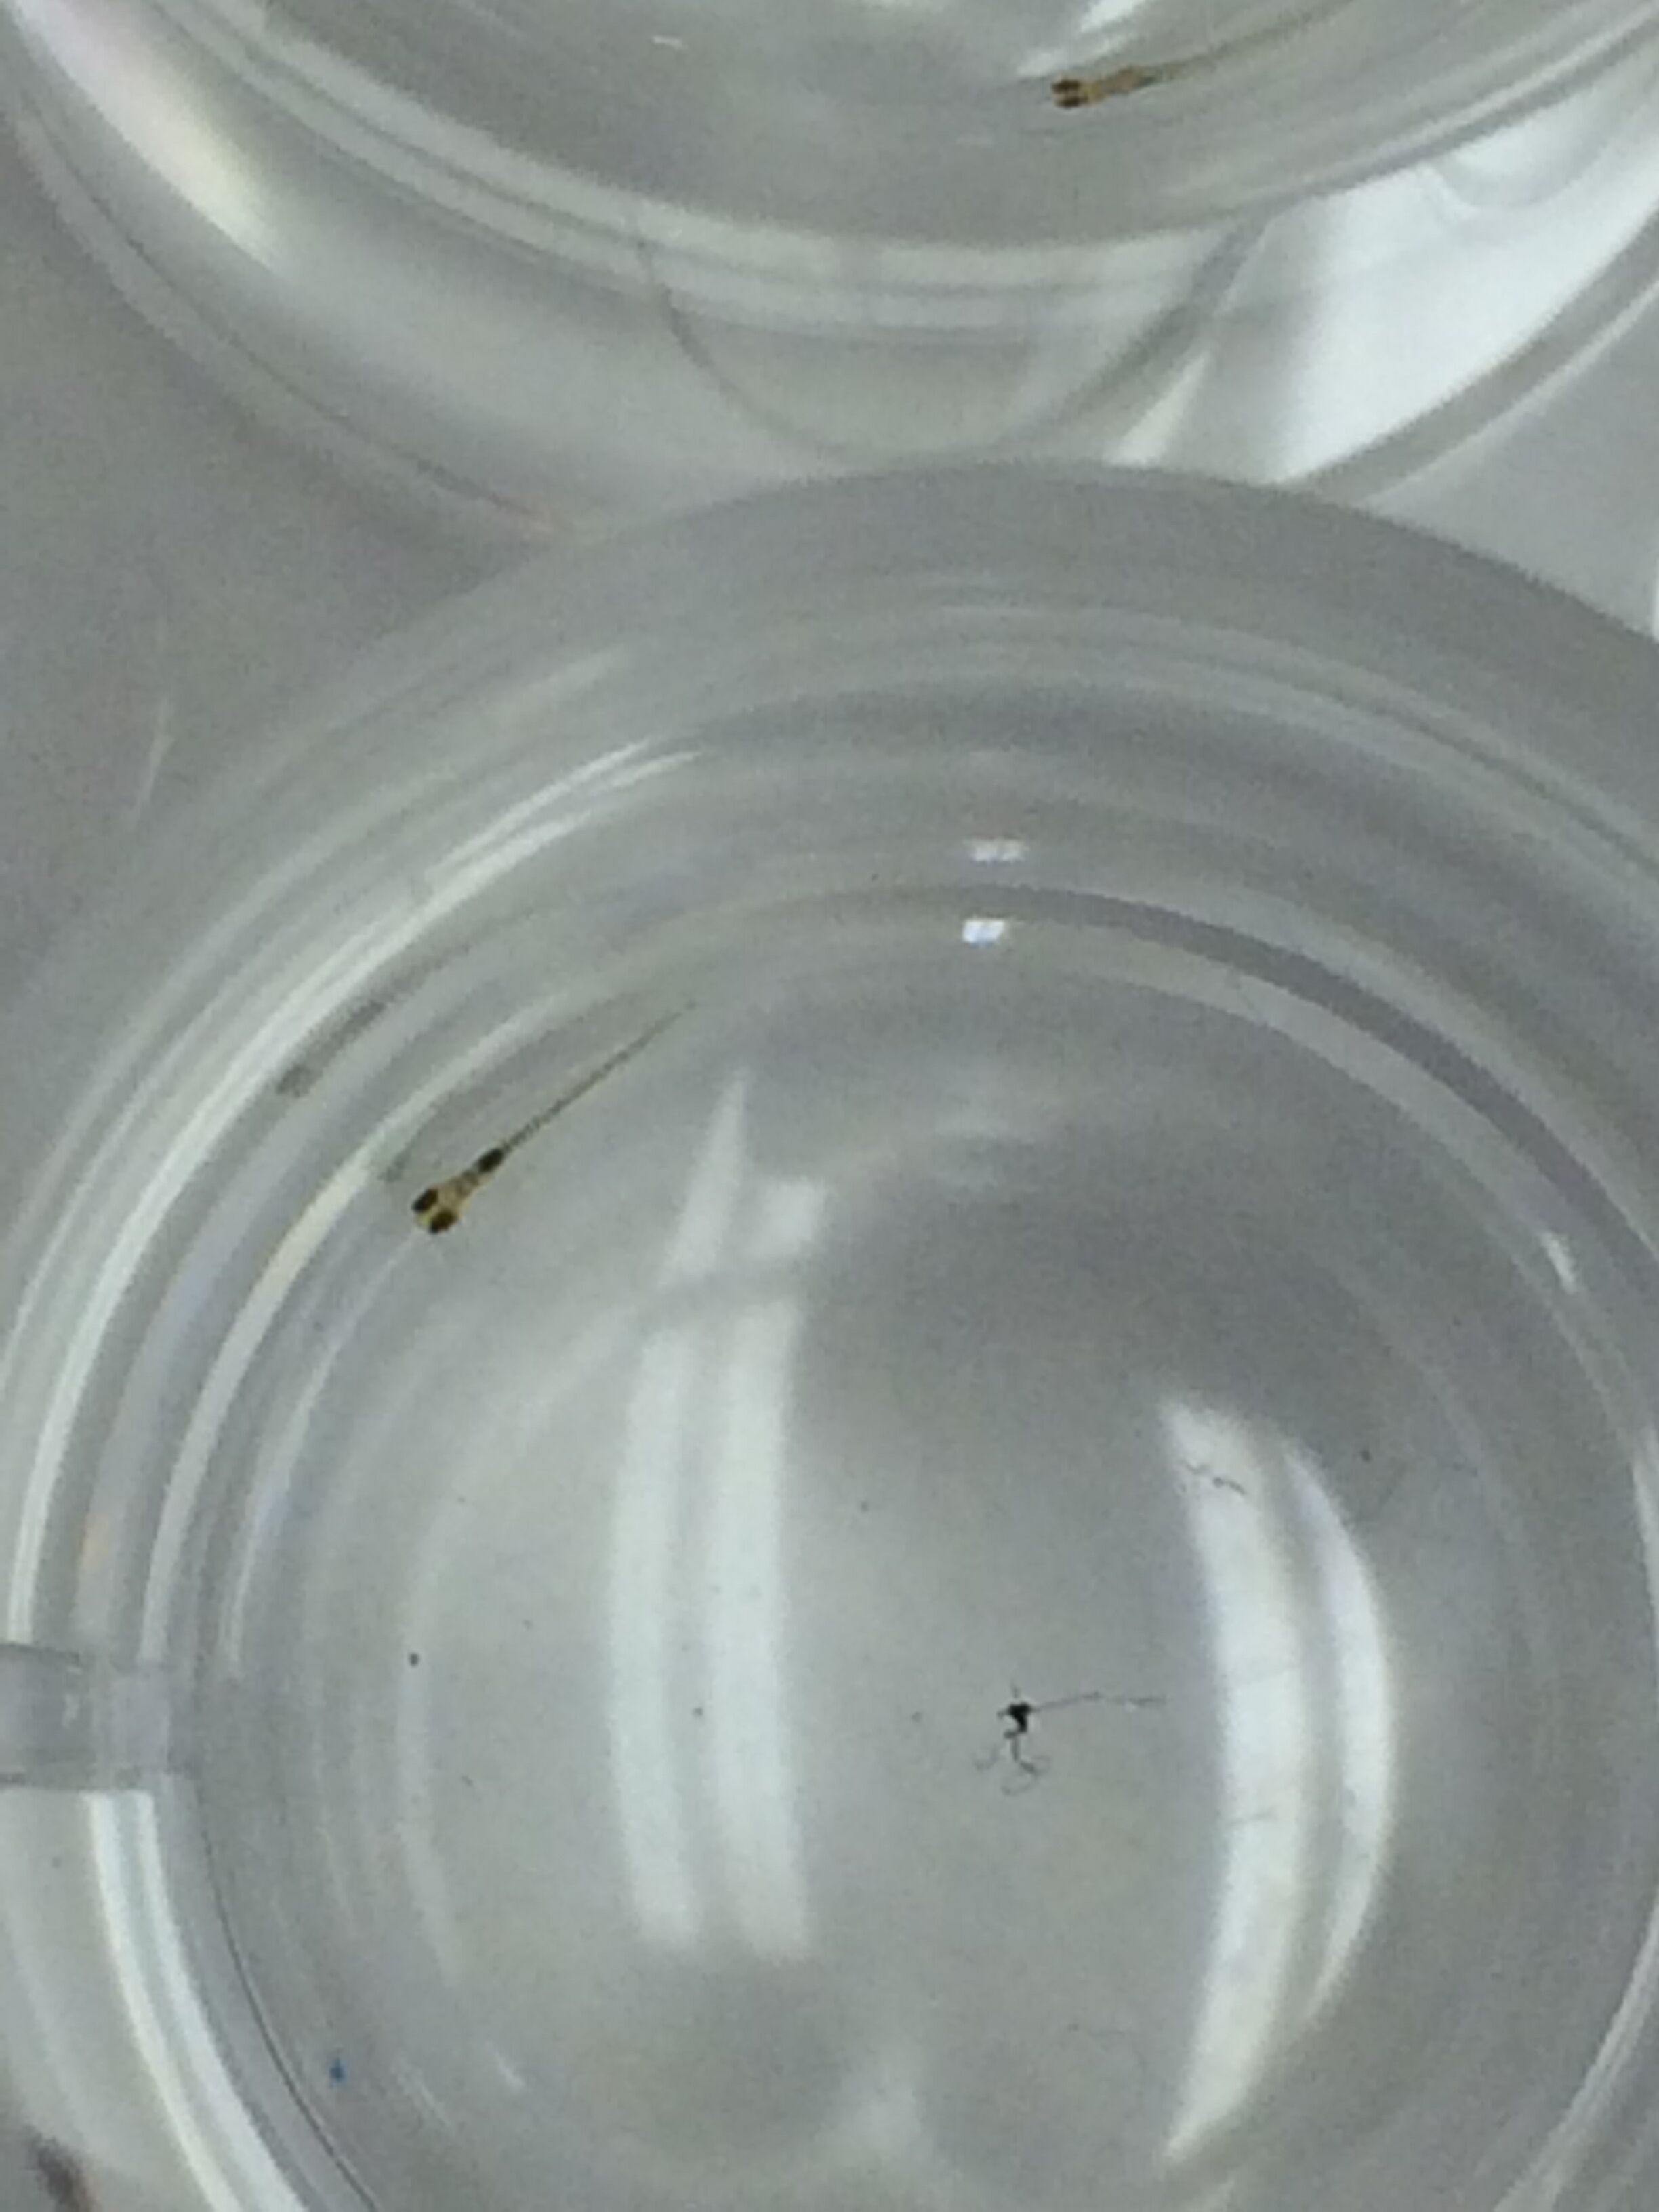
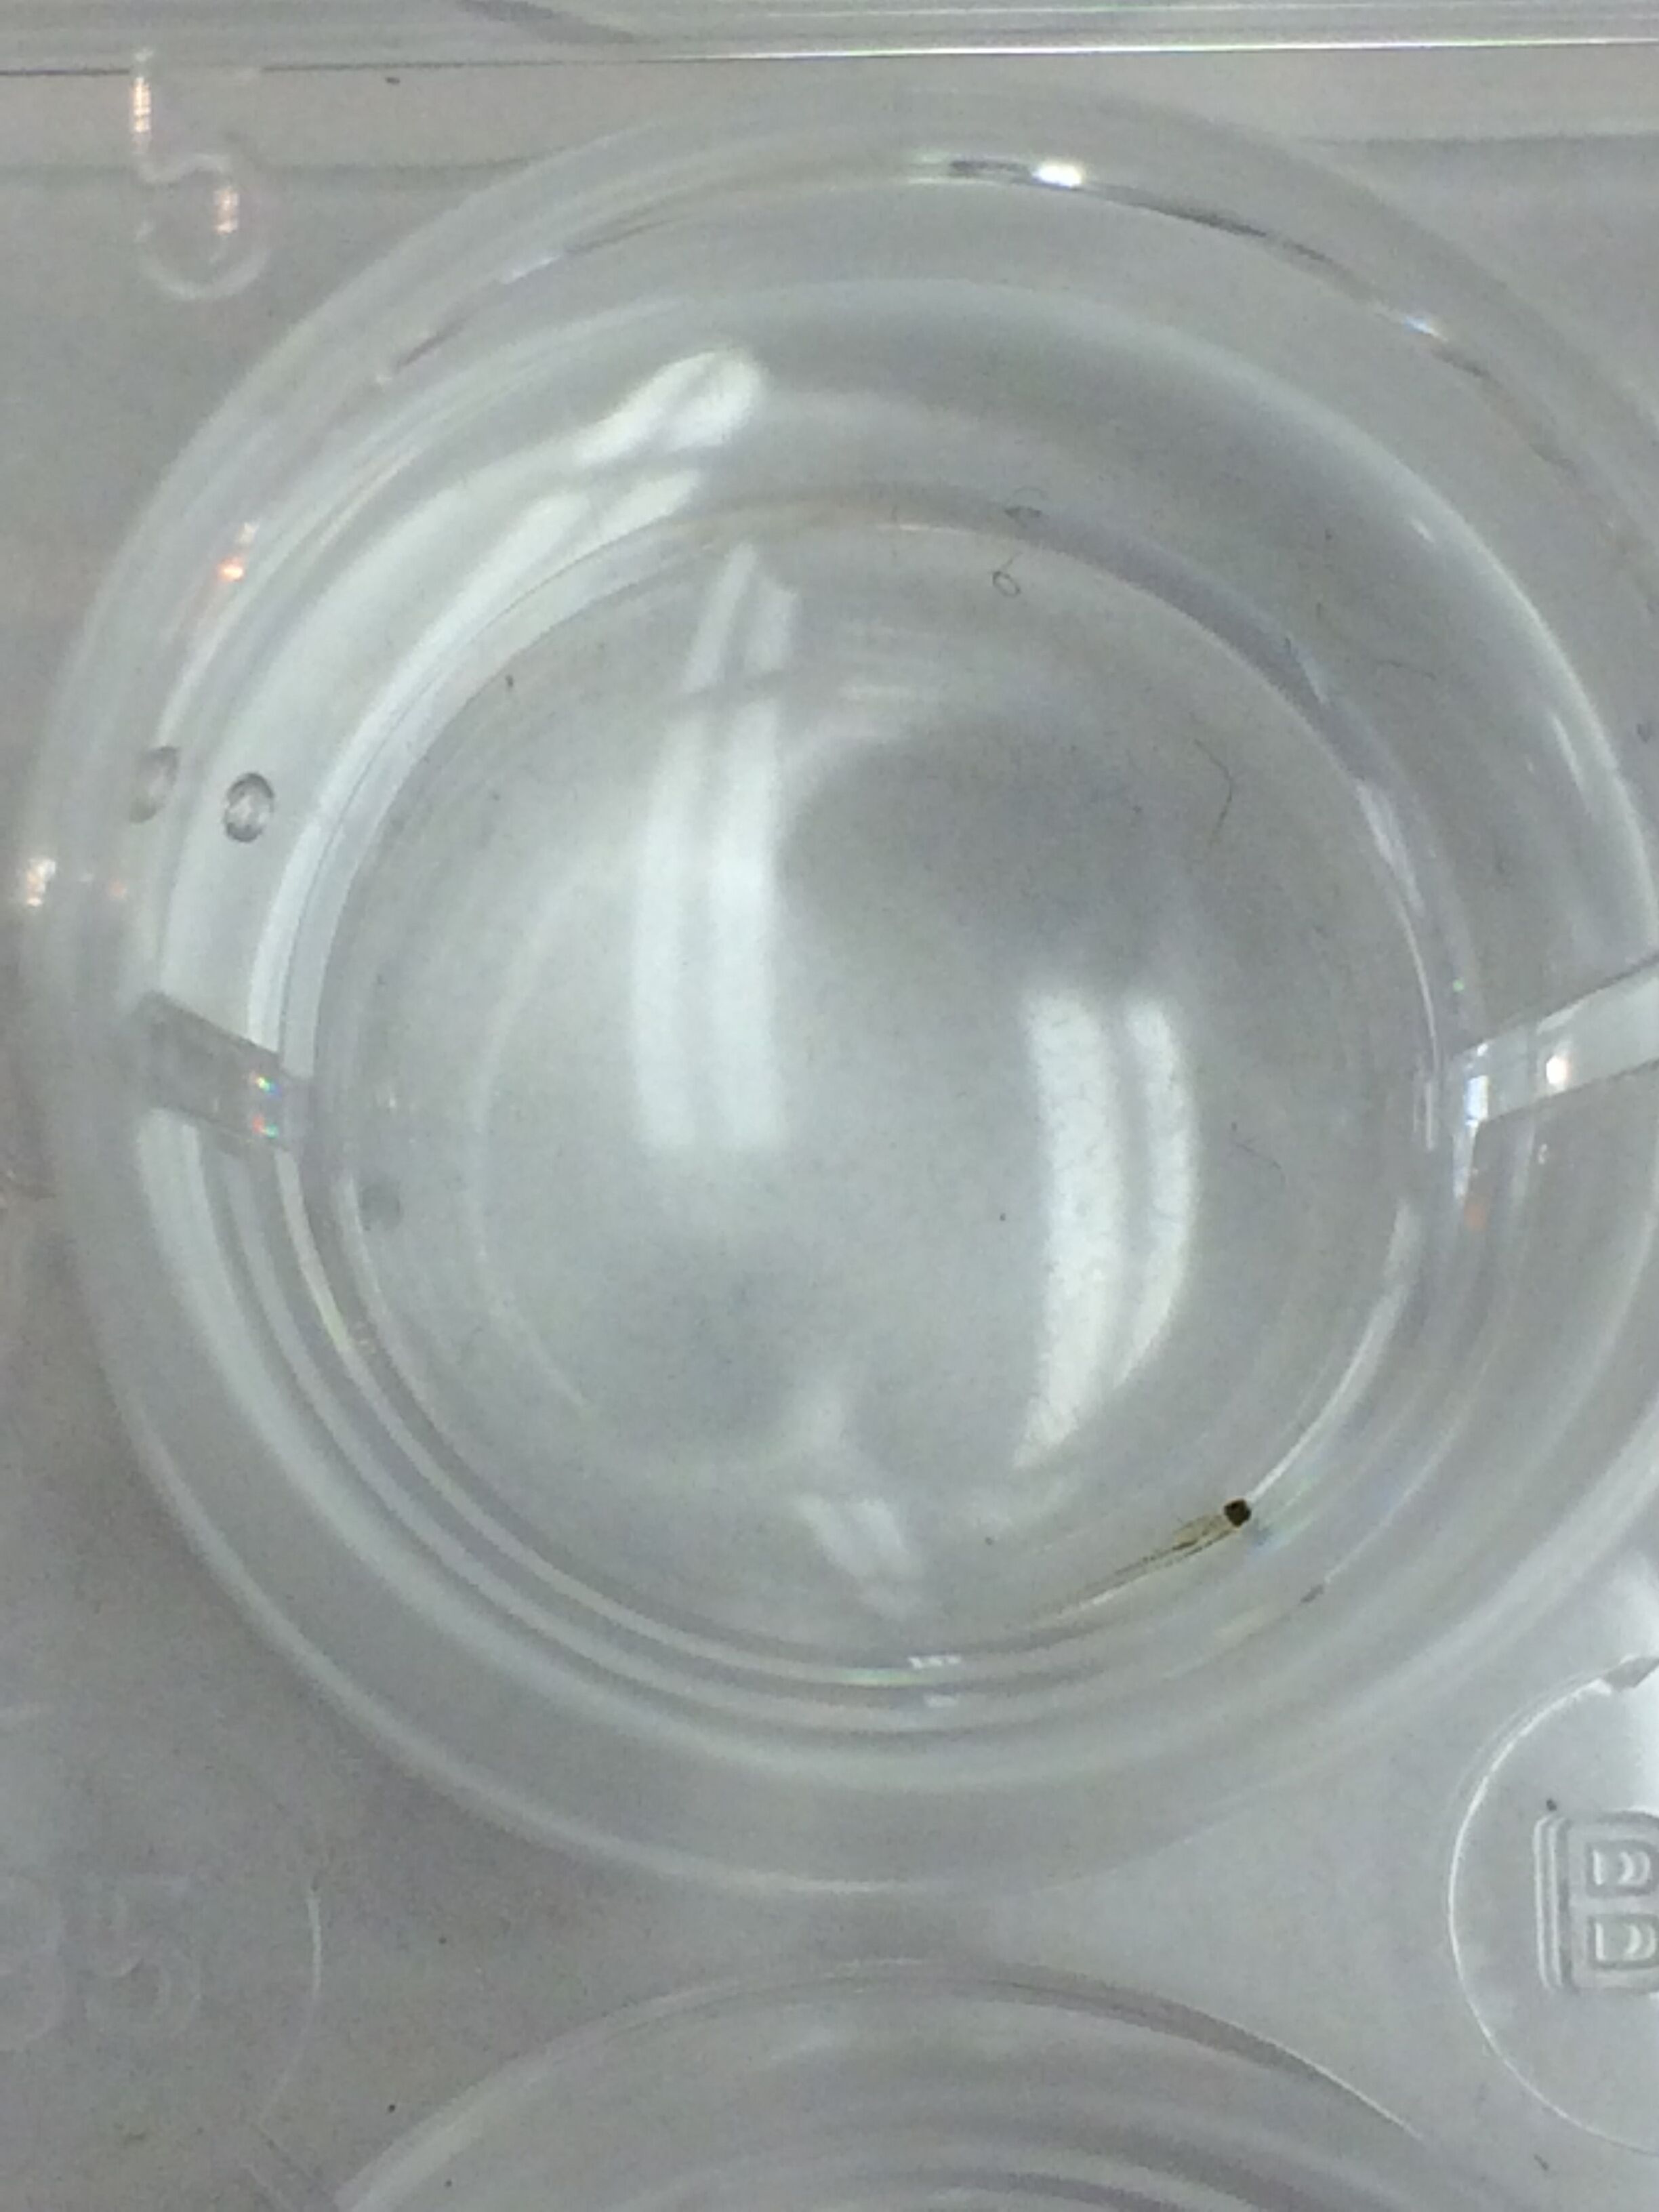
Figure 2
a.

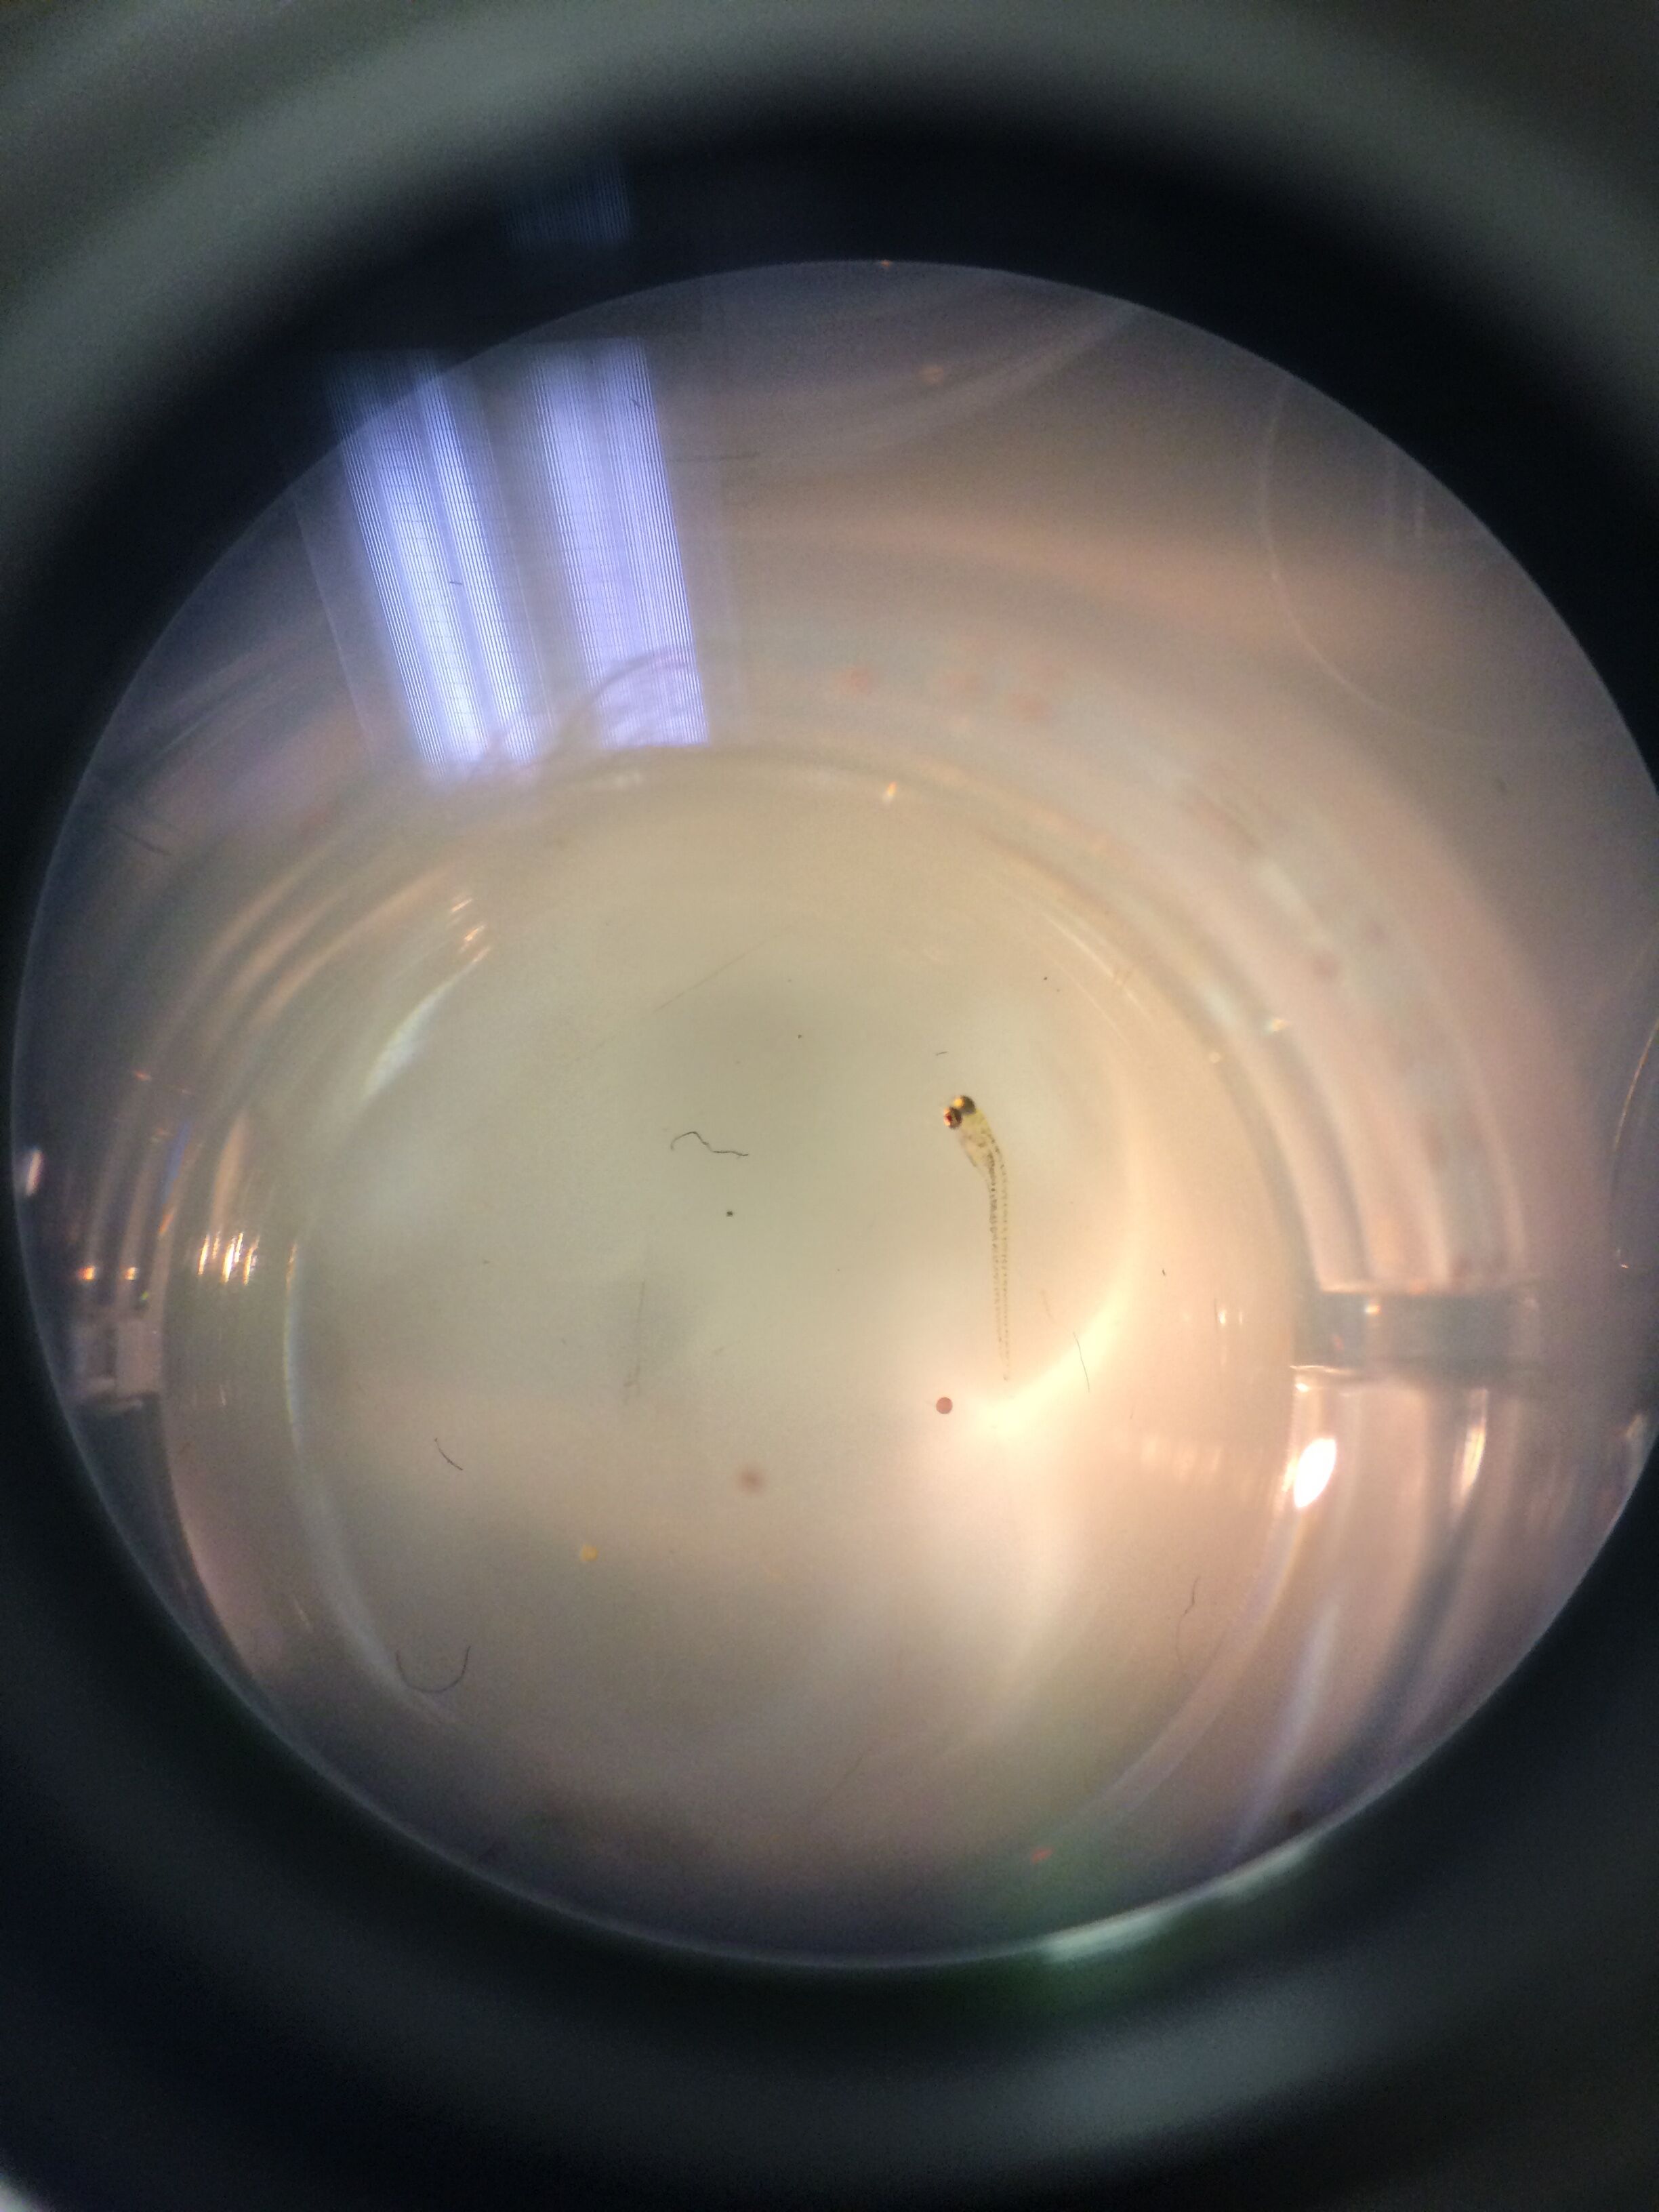
Figure 3
a.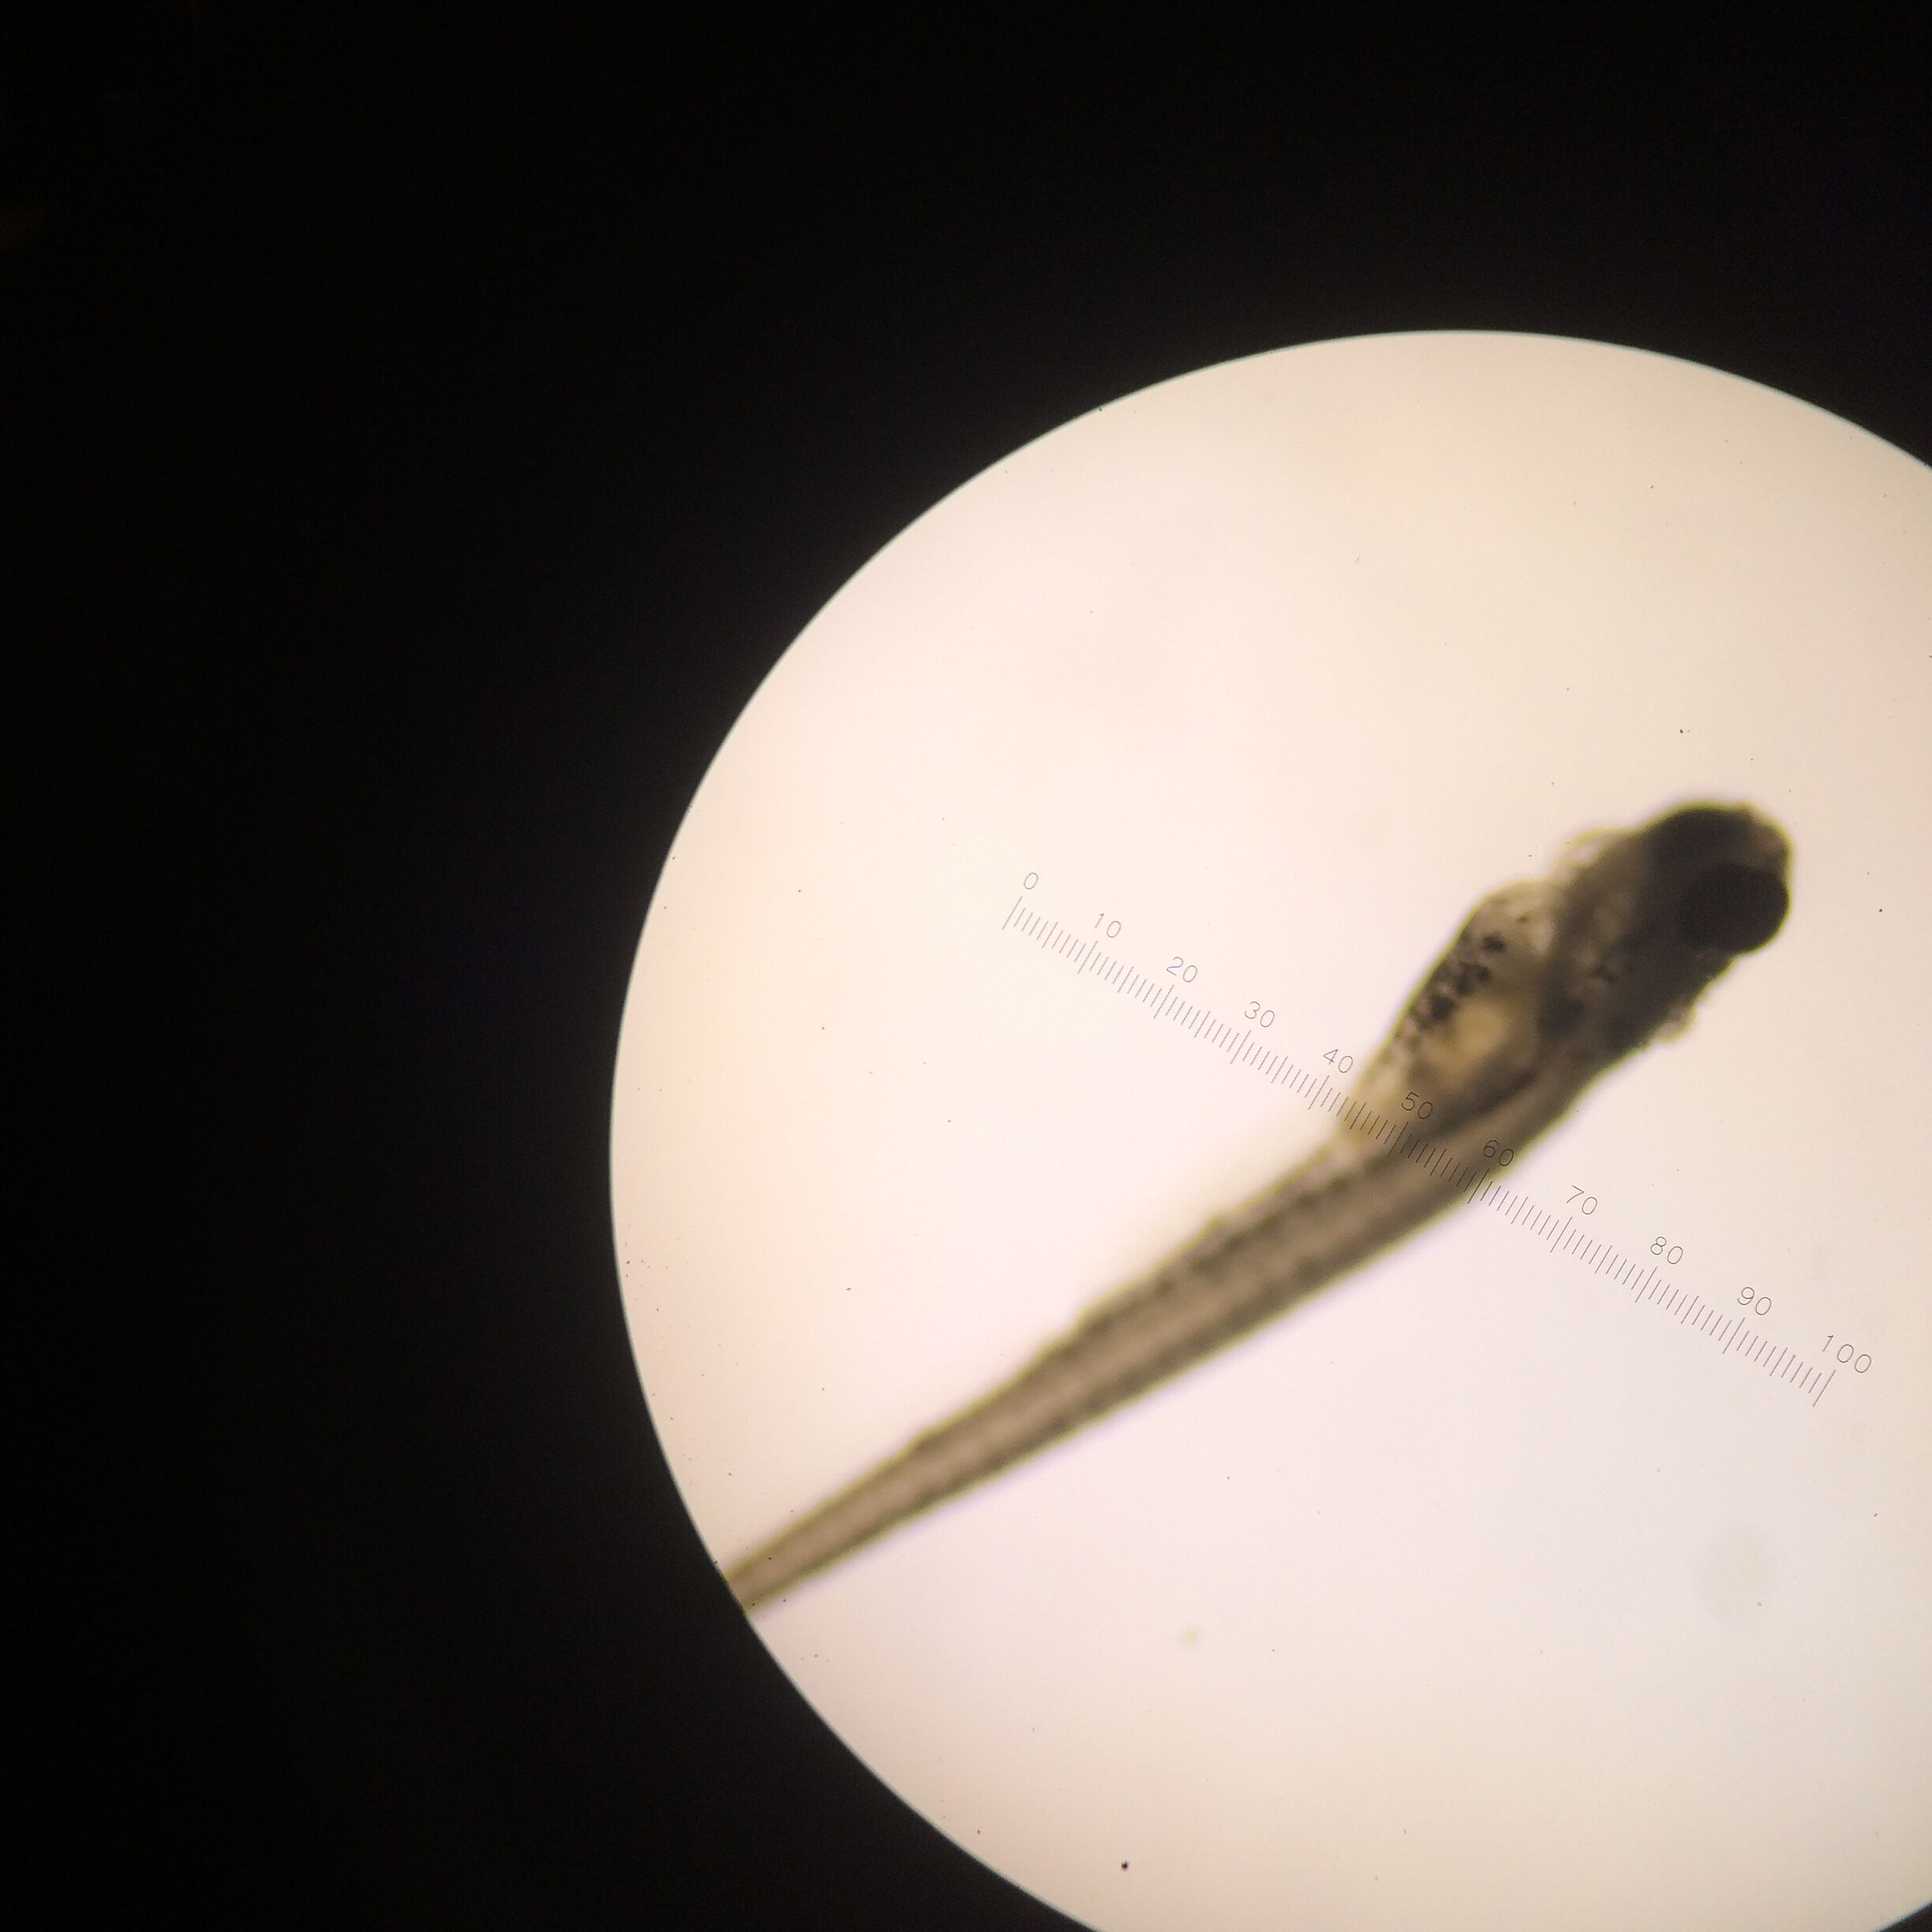
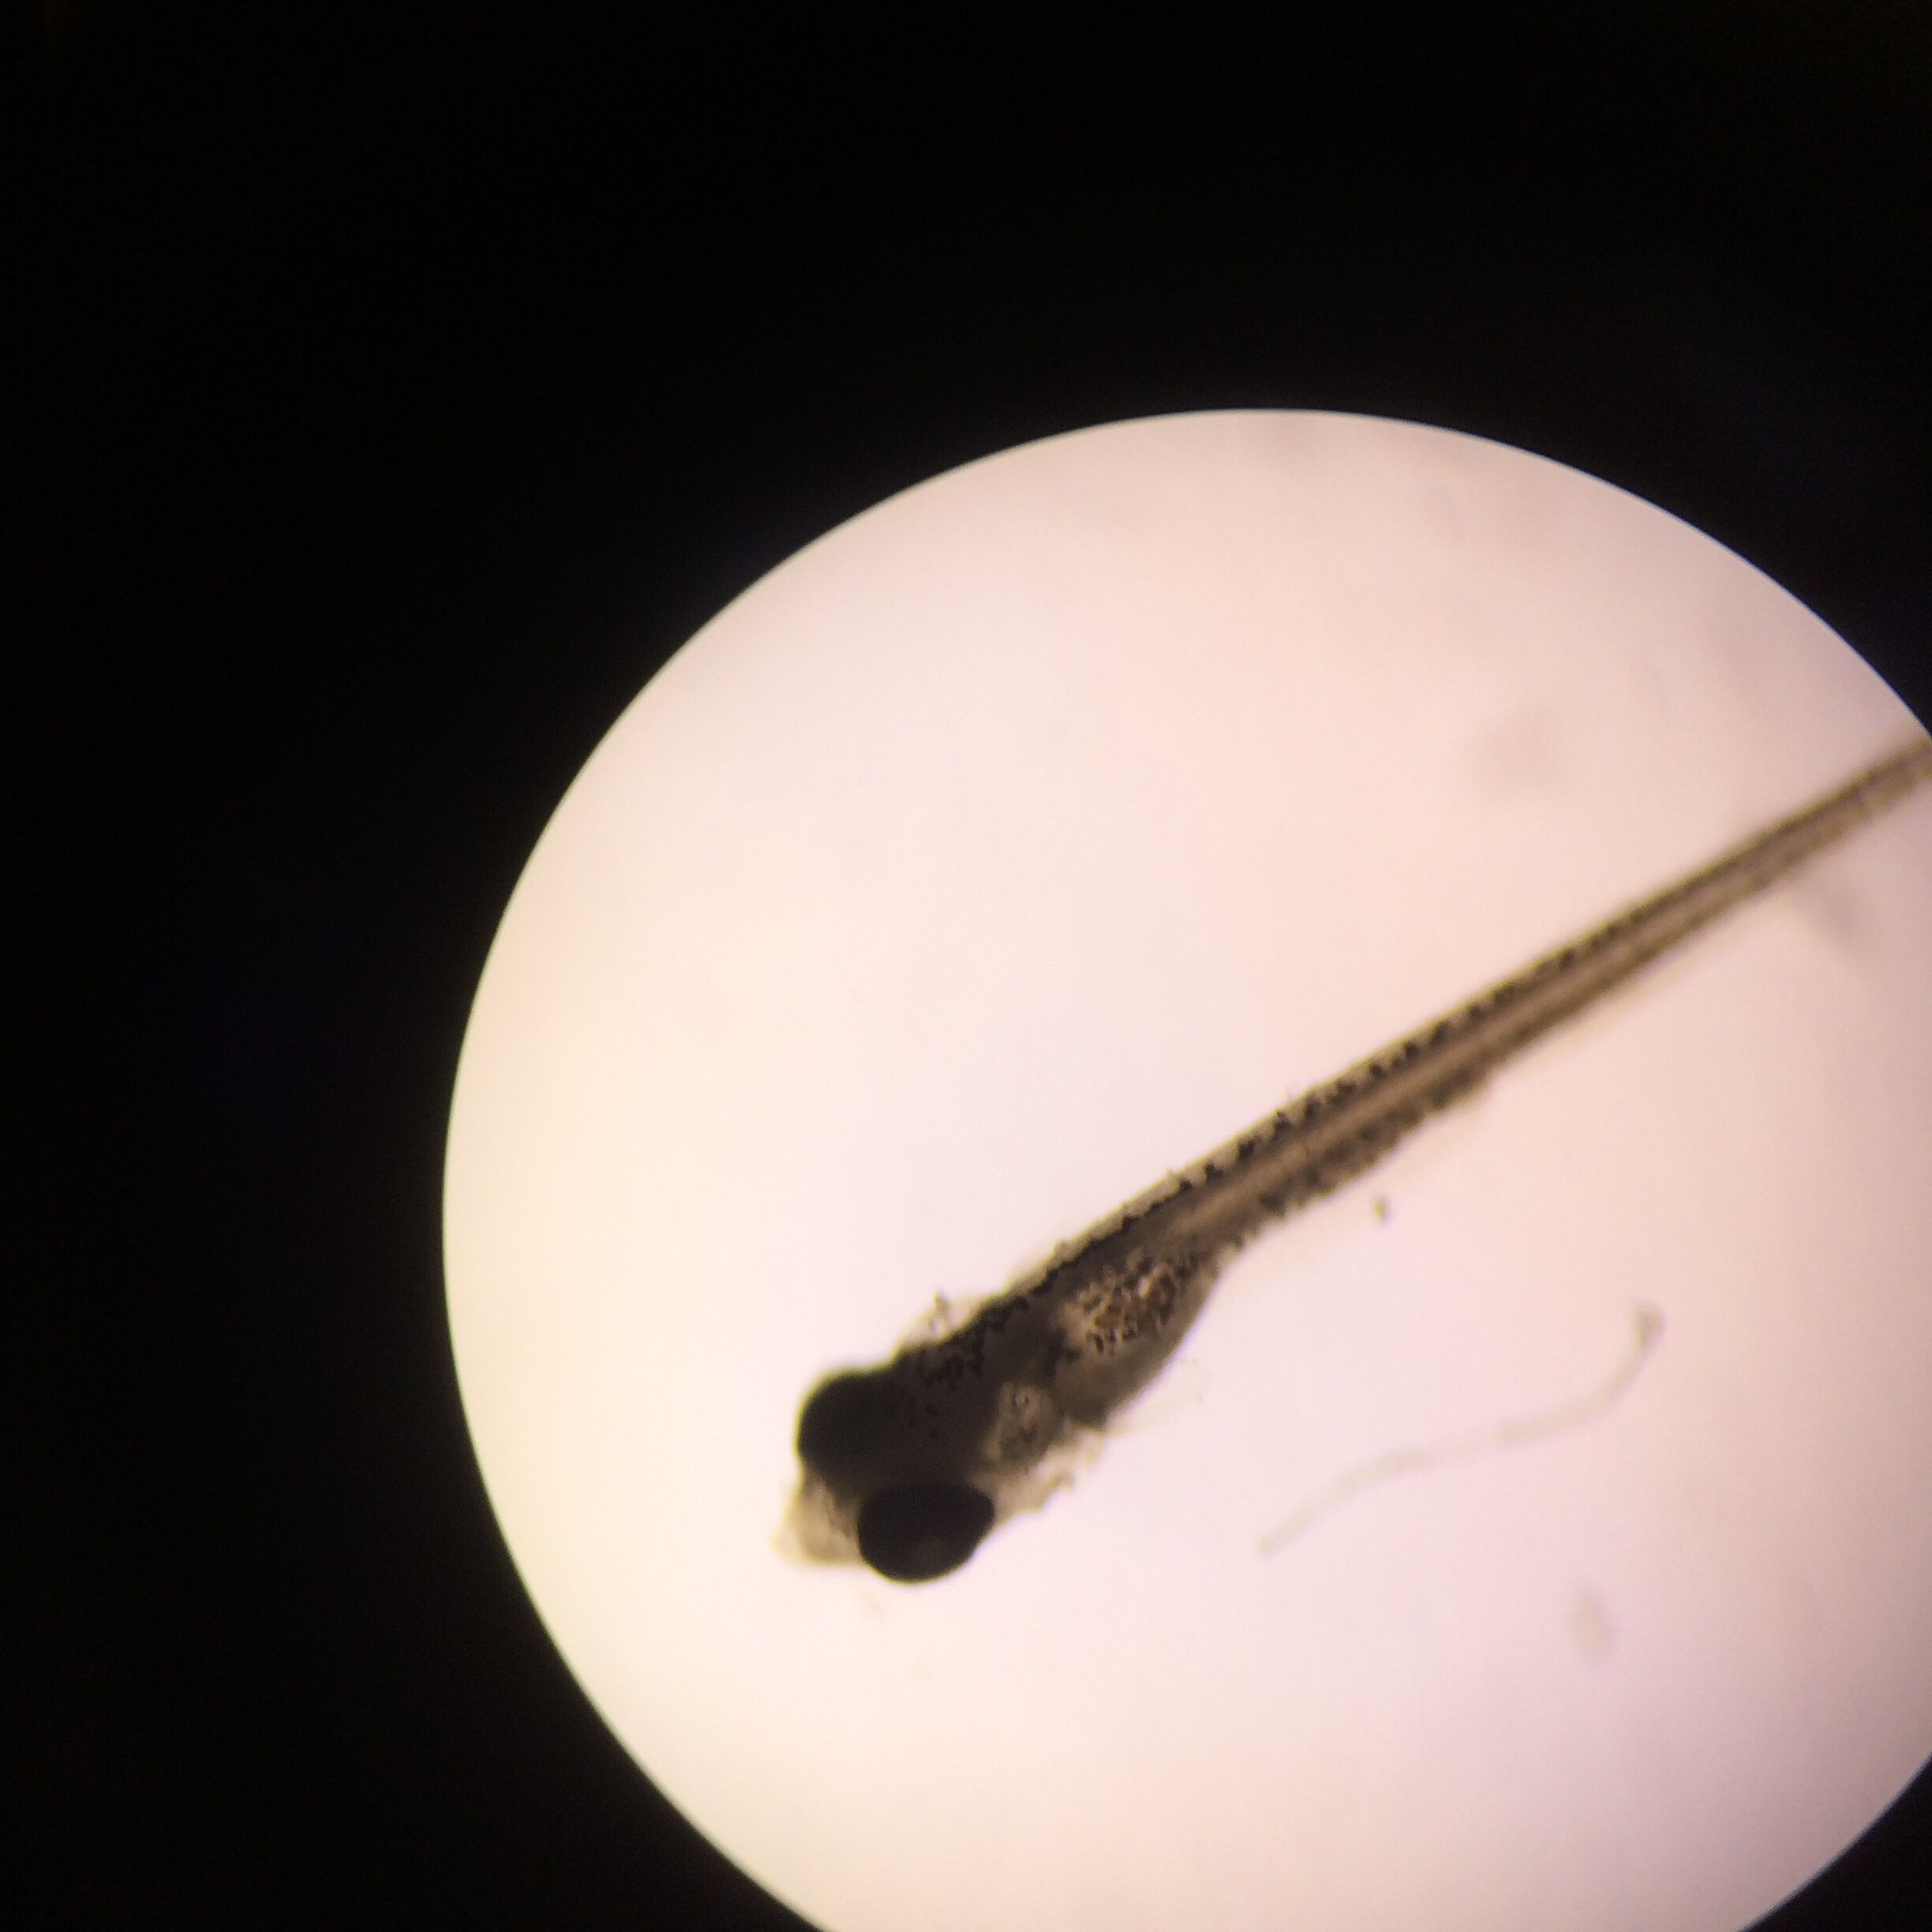

Conclusions Throughout the course of the experiment, it can be concluded that the concentration level of nicotine had prevalent effects in 3 main areas. The first is mortality. The death rate in the highest concentrated wells was far above the others from the start, and the 10 g/mL concentration began to catch up at the end, with only all but one of the fish being recorded dead at the end, which could have indicated an error. The second effect was the body shape. It was found that the control group had little to no deformation in body shape, but even in the presence of just some nicotine, like in the case of the 10 g/mL environment fish, their bodies were observed to be fairly bent in the later days of the experiment. It was most prominent in the 40 g/mL which can be seen in Figure 2c as the body is clearly and dramatically bent. Finally, eye size was greatly effected in the presence of nicotine, but it only seemed to be especially prominent in the 40 g/mL concentrations. It was observed that the presence of nicotine caused the eyes to move more towards the middle of the head, instead of on the side of the head. The observations indicated that factors that were initially hypothesized to be effected, had no prominence within the experiment. These included movement and response to stimuli, as by at least half way through, all three treatments had fish that had no movement or response.
""March 2, 2016""
Vertebrate Classification Table
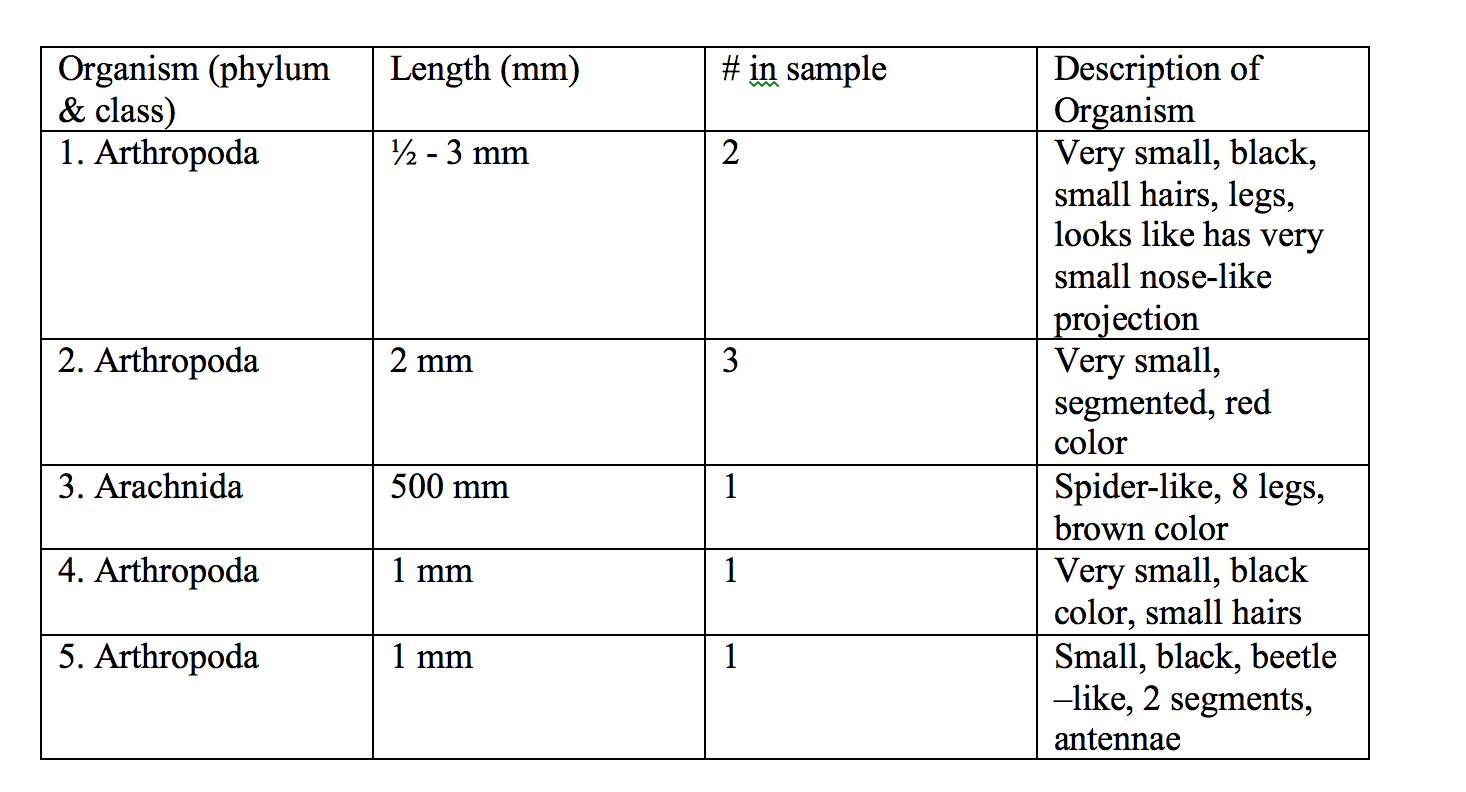
Conclusions The organisms ranged in size from 1/2 mm to 500 mm, with the arachnida being the largest, and the first arthropoda being the smallest. The organisms found here are among the most common organisms found in leaf litters in general, which include insects, but also decomposers and earthworms, who often feed and thrive in a leaf litter environment.
5 Vertebrates and Their Classifications 1. Tree Squirrel -Phylum: Chordata, Class: Mammalia, Order: Rodentia, Family: Sciuridae, Genus: tree squirrel, Species: Sciurus carolinensis -Benefitting Biotic Factors: Trees, Insects, Bacteria -Benefitting Abiotic Factors: Water, soil, rocks 2. Black Rat -Phylum: Chordata, Class: Mammalia, Order: Rodentia, Family: Murid, Genus: Rattus, Species: Rattus rattus -Benefitting Biotic Factors: dead plant and animal matter, bacteria -Benefitting Abiotic Factors: Water, soil, rocks 3. American Bullfrog -Phylum: Chordata, Class: Amphibia, Order: Anura, Family: Ranidae, Genus: Rana, Species: Rana catesbeiana -Benefitting Biotic Factors: Bacteria, insects -Benefitting Abiotic Factors: water, rocks 4. Hawk -Phylum: Chordata, Class: Aves, Order: Accipitriformes, Family: Accipitridae, Genus: Buteo, Species: Buteo platypterus -Benefitting Biotic Factors: insects, smaller birds/mammals, bacteria, trees -Abiotic Factors: water, rocks 5. Robin -Phylum: Chordata, Class: Aves, Order: Passerine, Family: Thrush, Genus: Turdus, Species: Turdus migratorious -Benefitting Biotic Factors: insects, trees, fruits, earthworms, bacteria -Benefitting Abiotic Factors: water, soil, rocks
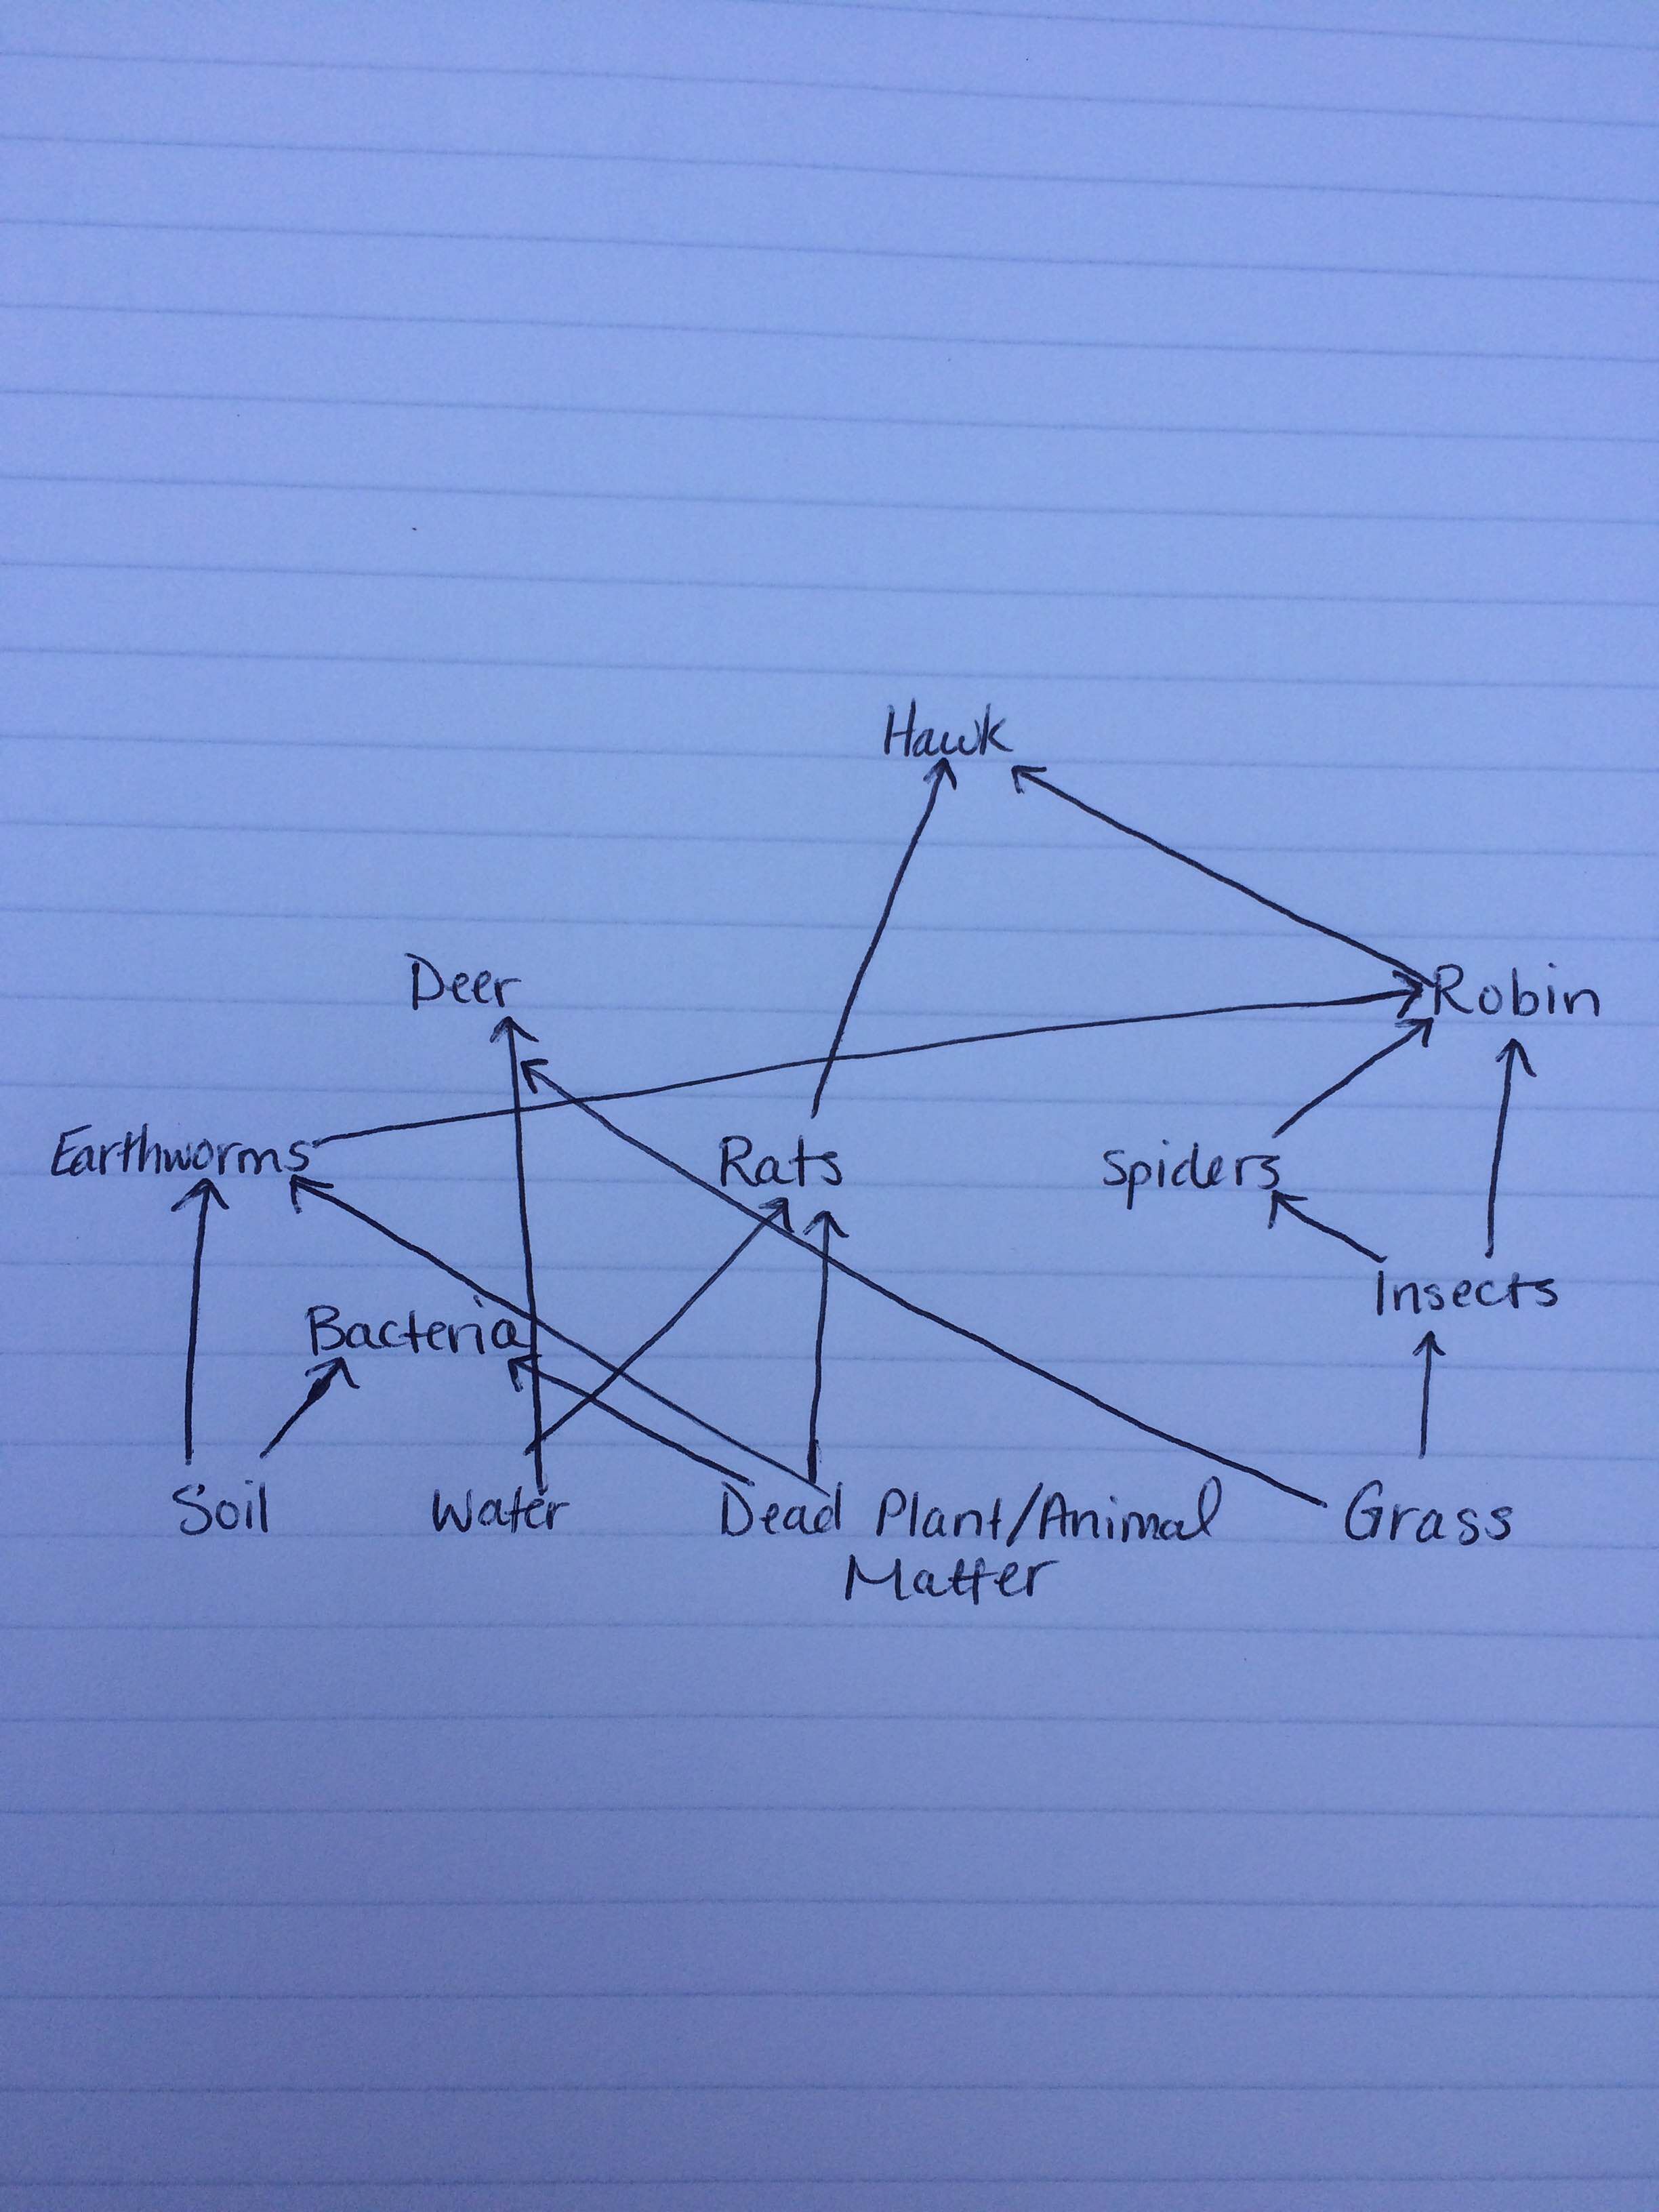
Each organism in this food web represents community in that they are all interacting with one another in a specific area, in this case, Transect 2. They demonstrate the idea of carrying capacity because through each interaction, the organisms are balancing each other out both in adaptations and population in that for an organism to be successful and reproduce, there can only be a certain number, otherwise there would be too much competition and the species could die off. Each represent trophic levels in that they all have different positions in the food chain. The plants at the bottom of the food web are the primary producers that the rest of the web relies on, while the dead matter are vital for the decomposers to survive and break down for the upper levels to use. The second trophic level, which includes the bacteria, insect, small herbivores and birds, feed on the primary producers for energy. The tertiary organisms feed on the secondary organisms for energy, and the pattern continues, illustrating the relationships between all the organisms within the transect.
K.H.
""February 24, 2016""
Sequence AGTCGAGCGCCCCGCAGGNNAGCGGCAGACGGGTGAGTAACGCGTGGGAACGTACCT TTTGCTACGGAATAACTCAGGGAAACTTGTGCTAATACCGTAGGTGCCCTTCGGGGGAAAGATTTATCGGCAAAGGATCG GCCCGCGTTGGATTAGCTAGTTGGTGAGGTAAAGGCTCACCAAGGCGACTATCCATAGCTGGGCTGAGAGGATGATCAAC CACACTGGGACTGAAACACGGCCCANACTCCTACGGGAGGCAGCAGTGGGGAATATTGGACAATGGGCGCAAGCCTGATC CATCCATGCCGCGTGAGTGATGAAGGCCCTAGGGTTGTAAAGCTCTTTCACCGGTGAAGATAATGACGGTAACCGGAGAA CAAGCCCCGGCTAACTTCGTGCCAACAGCCGCGGTAATACGAAGGGGGCTAACGTTGTTCGGATTTACTGGGCGTAAAGC GCACGTAGGCGGACTTTTAAGTCAGGGGTGAAATCCCGGGGCTCAACCCCGGAACTGCCTTTGATACTGGAAGTCTTGAG TATGGTANAGGTGAGTGGAATTCCGAGTGTANAGGTGAAATTCNTANATATTCNGAGGAACACCAGTGNNGAANGCGGCT CACTGGACCATTACTGACGCTGANGTGCNAAAGCGTGGGGAGCAAACANGATTANATACCCTGGTAGTCCACGCCGTANA CGATGAATGTTAGCCGTTGGGGAGTTTACTCTTCGGTGGCGCAGCTAACGCATTAAACATTCCGCCTGGNGAGTACNGTC GCAAGATTAAAACTCANANGAATTGACNGGGGCCCGCACAAGCGGTGGAGCATGTGGTTTAATTCNAANCAACGCNCAAA CCTTACCANCCCTTGACATACCGGTCGCGGACACAGANATGTGTCTTTCANTTCNNCTGGACCGGATACANGTGCTGCAT GGCTGTCNTCANCTCGTGTCNNGAGATGTTGNGTTAAGTCCCNGCAACGANCGCAACCCCTCNNCCTTANTTGCCAGNNT TTANNTGGNCACTCTA
Genus of Species: Uncultured Bacterium Clone
http://blast.ncbi.nlm.nih.gov/Blast.cgi#942637620
The species was identified by using the sequence above and placing it into a program at http://blast.ncbi.nlm.nih.gov/Blast.cgi. The sequence corresponding to the lab group was selected and copied and pasted into the program. After approximately 20 seconds, the program produced matches for the sequence, meaning matching genuses to the sequence. The top genus listed is the greatest match, and when selected, the break down of the sequence is produced.
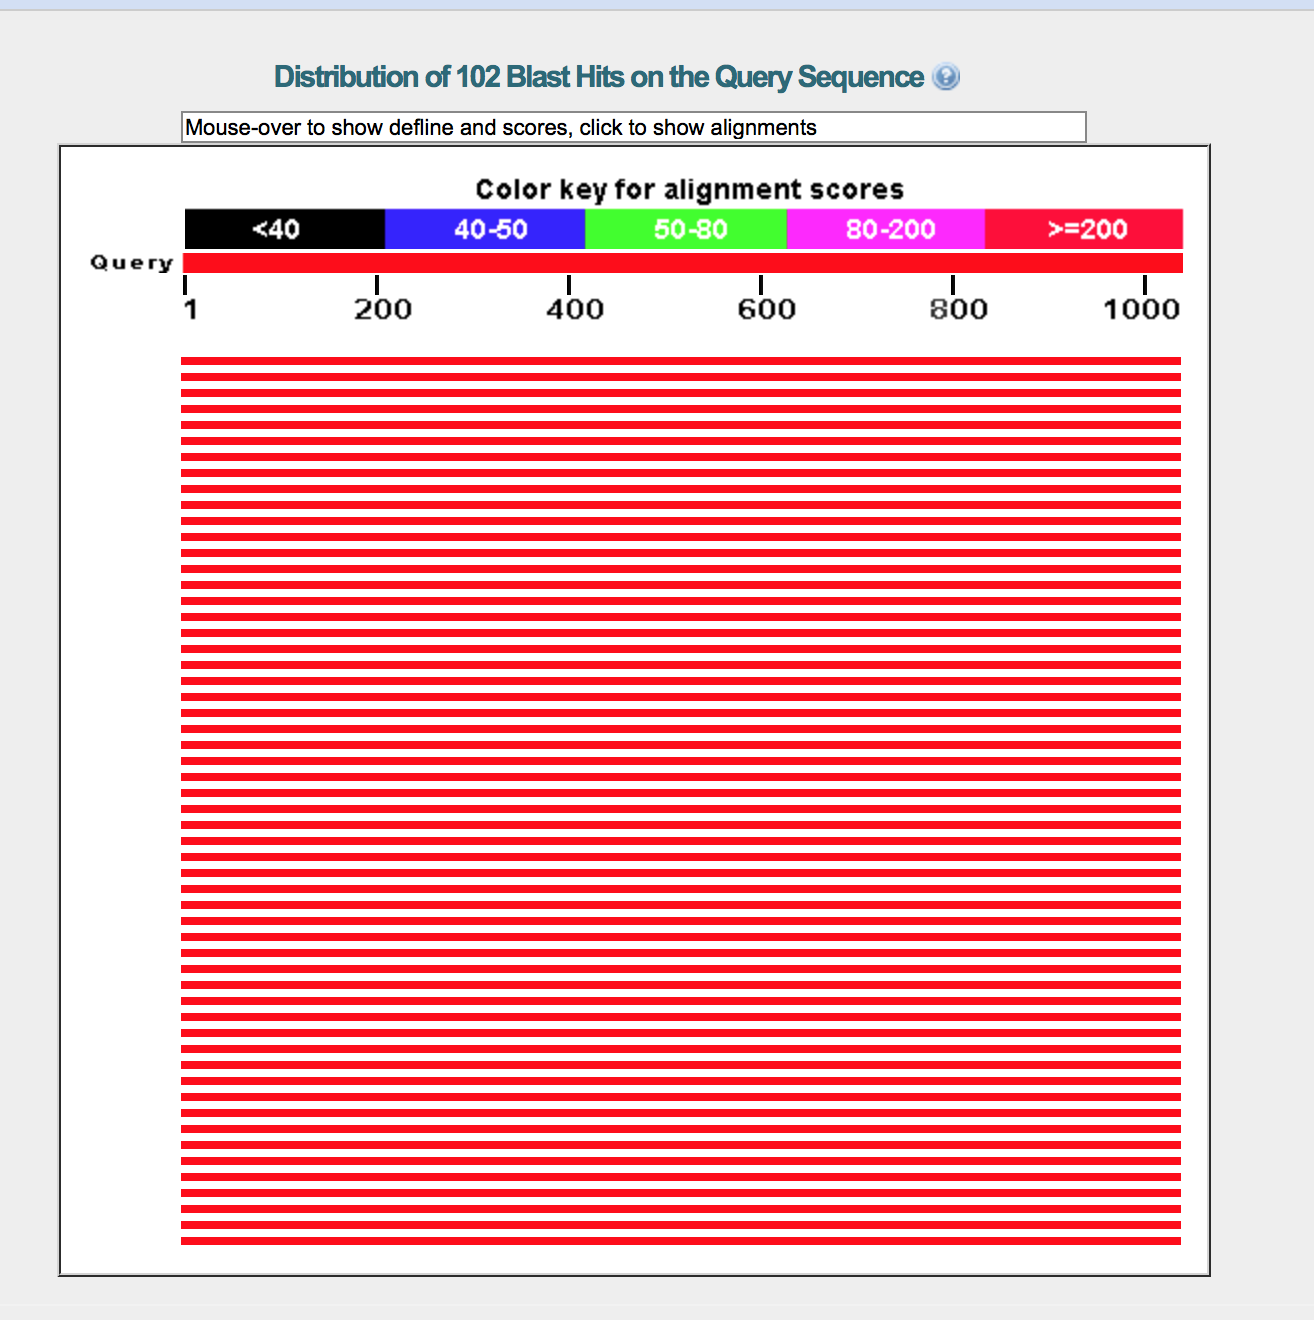
NOTE: The sequence used was one from a previous lab, due to the fact that the PCR conducted within the lab failed, which is believed to be due to the primer. Therefore, the gel that was run did not produce any data.
K.H.
""February 17, 2016""
Burlese Funnel
The Burlese Funnel was constructed by putting 25 mL of a 50/50 ethanol and water solution into a conical tube. A piece of screening material was taped onto the bottom of the funnel and then the leaf litter from the transect was placed inside. The funnel and conical tubes were secured together using more tape and then a layer of parafilm to prevent the ethanol from evaporating. The apparatus was finally placed under a 4 watt lamp and everything was covered with foil for one week.

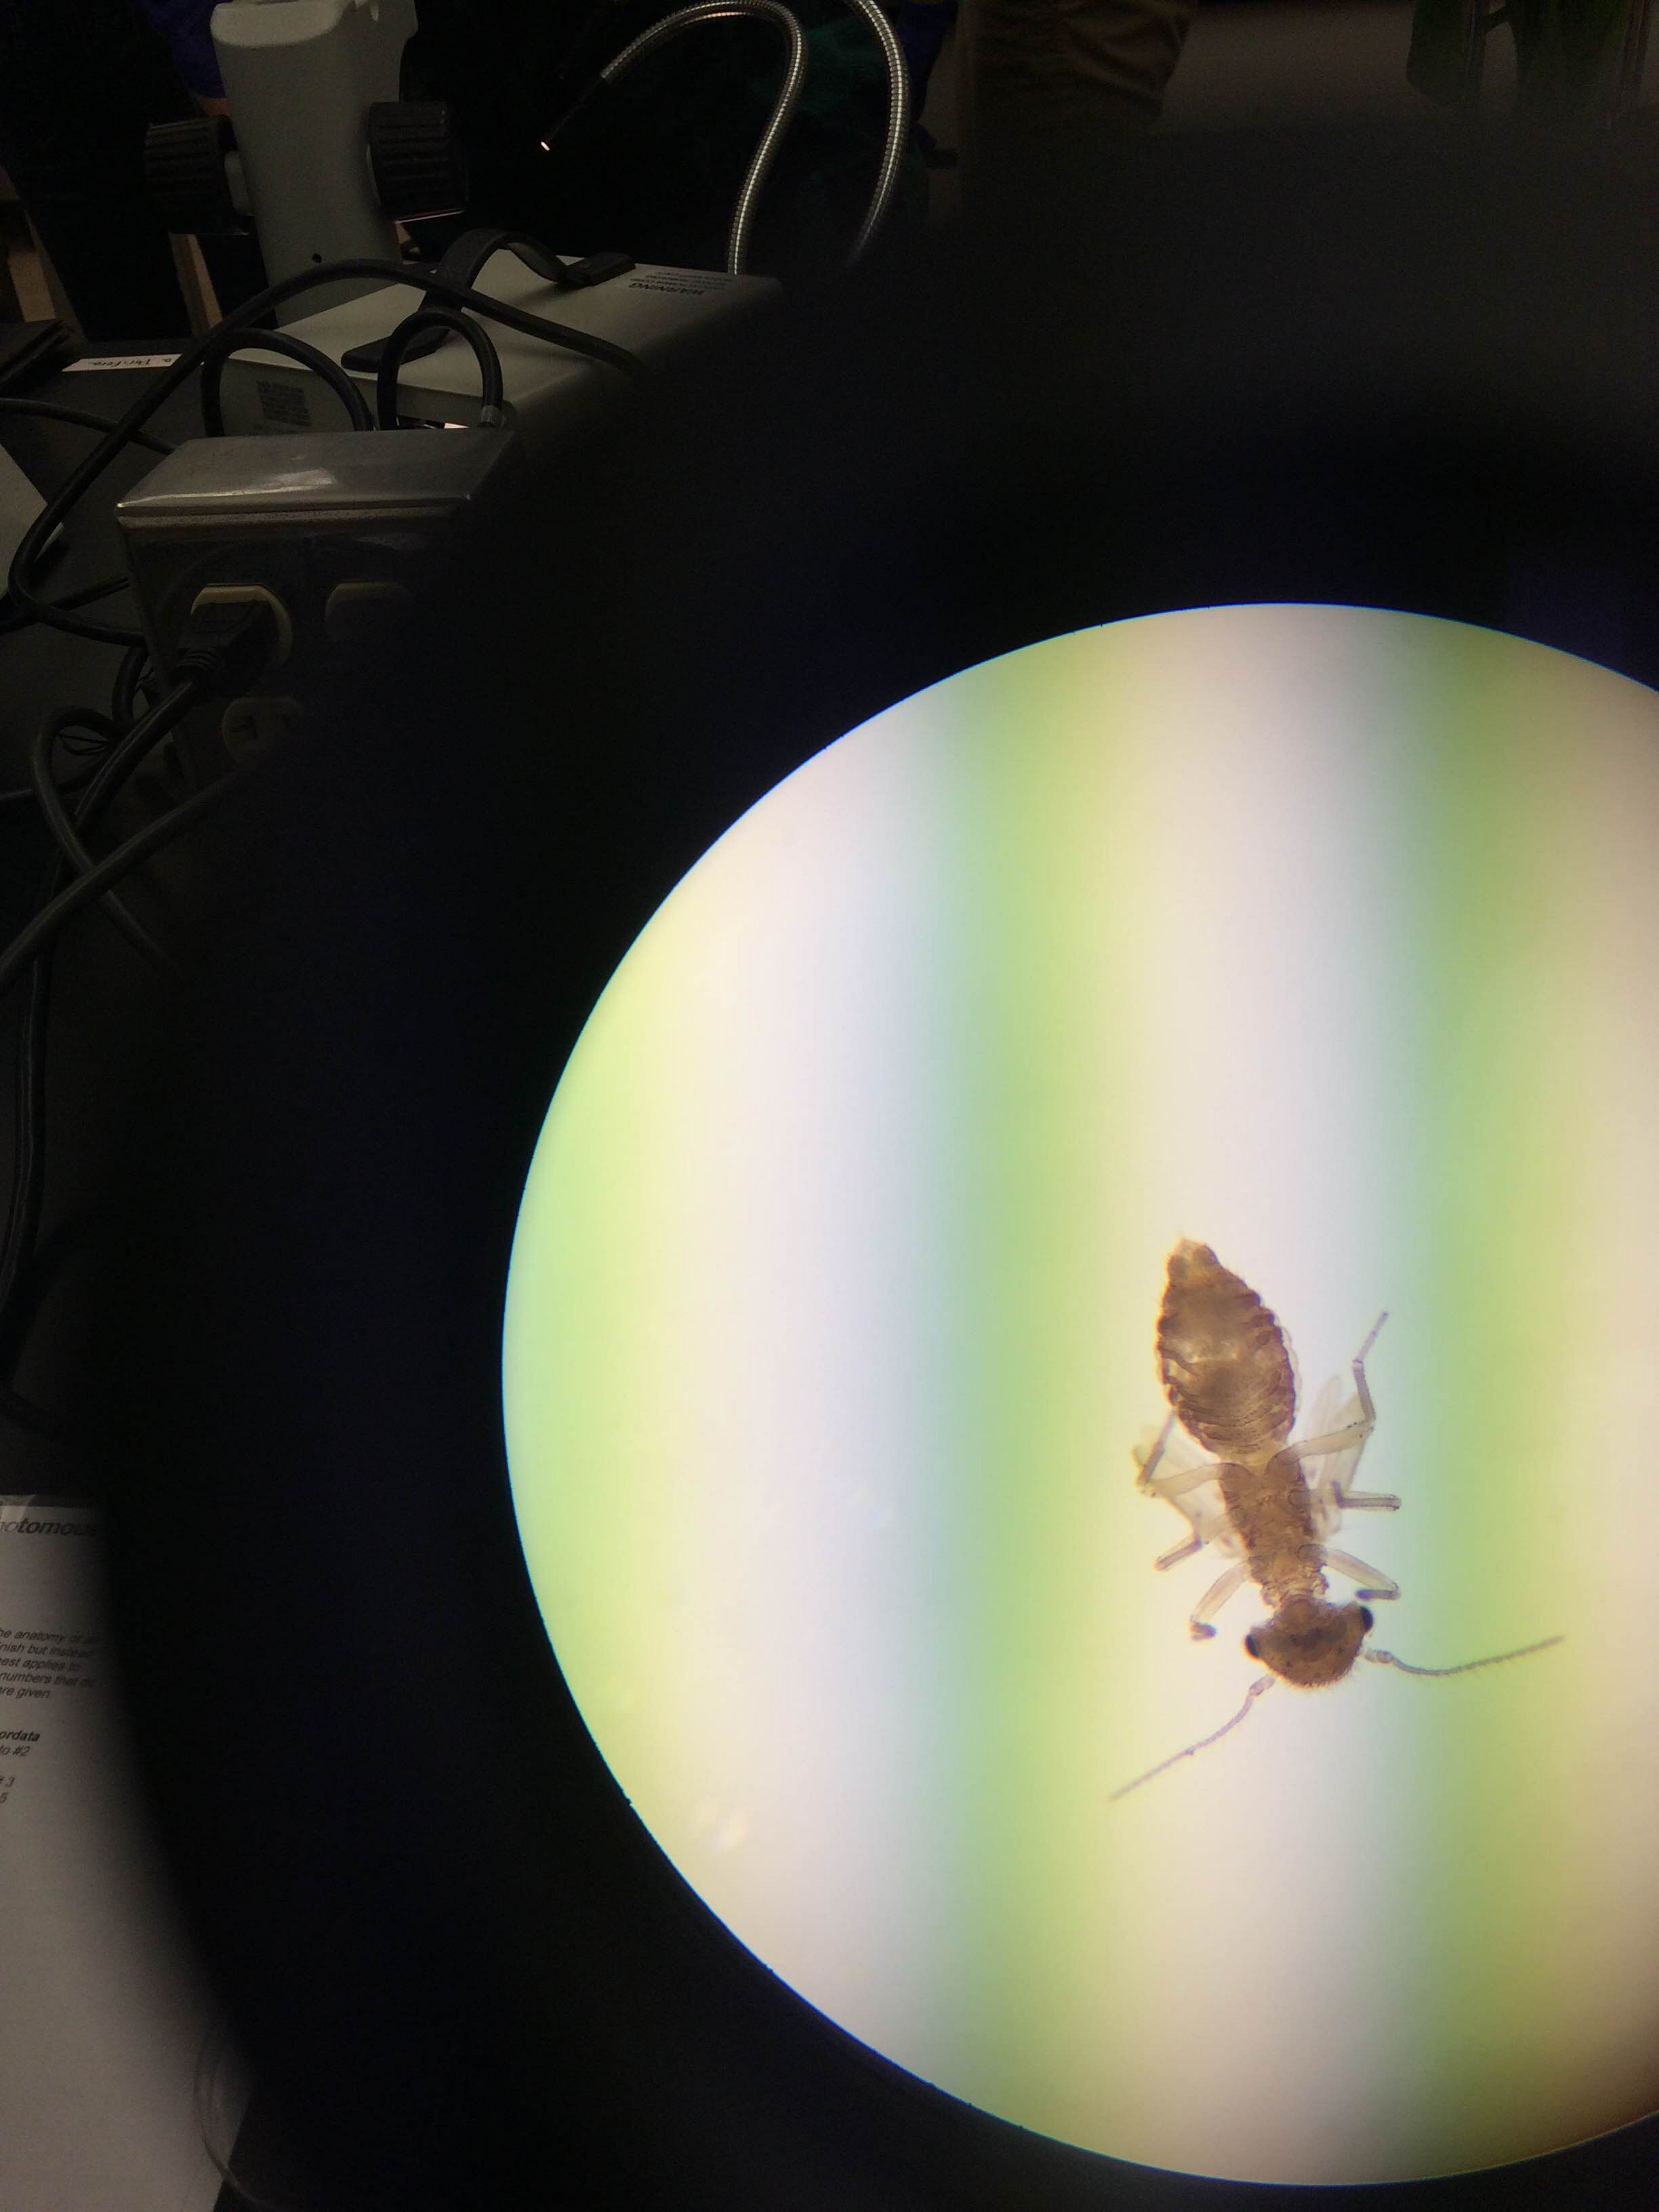
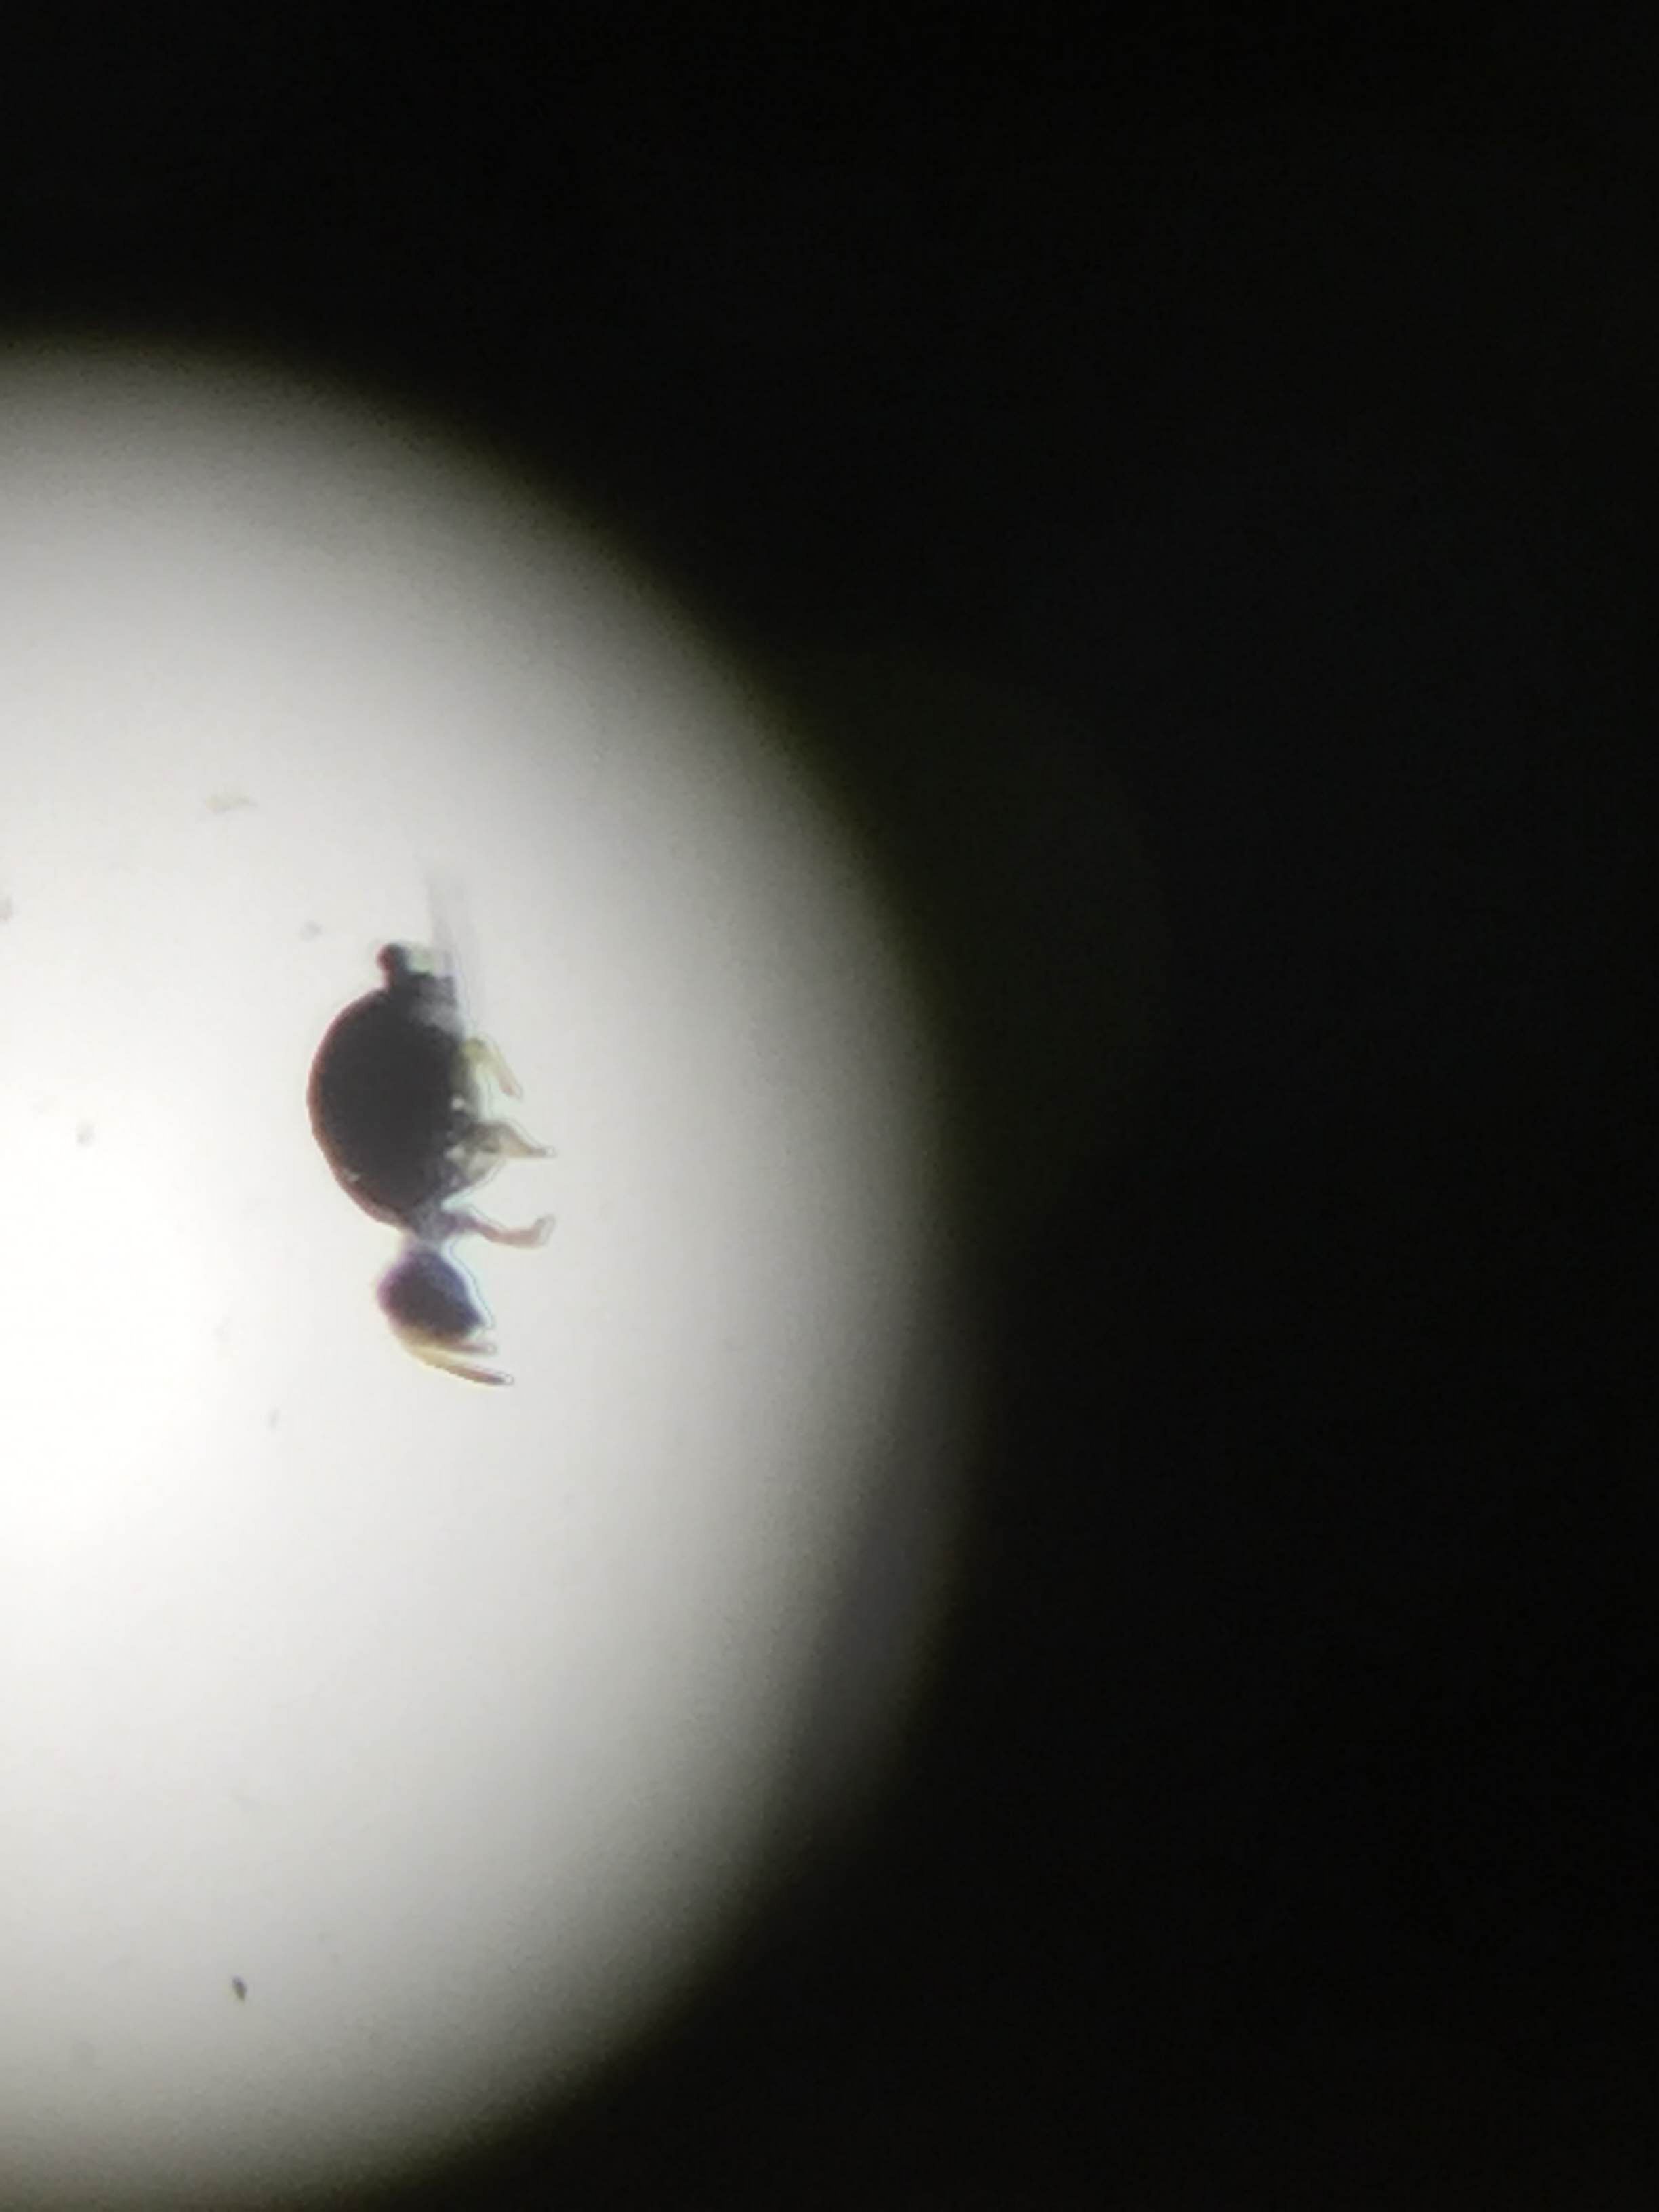
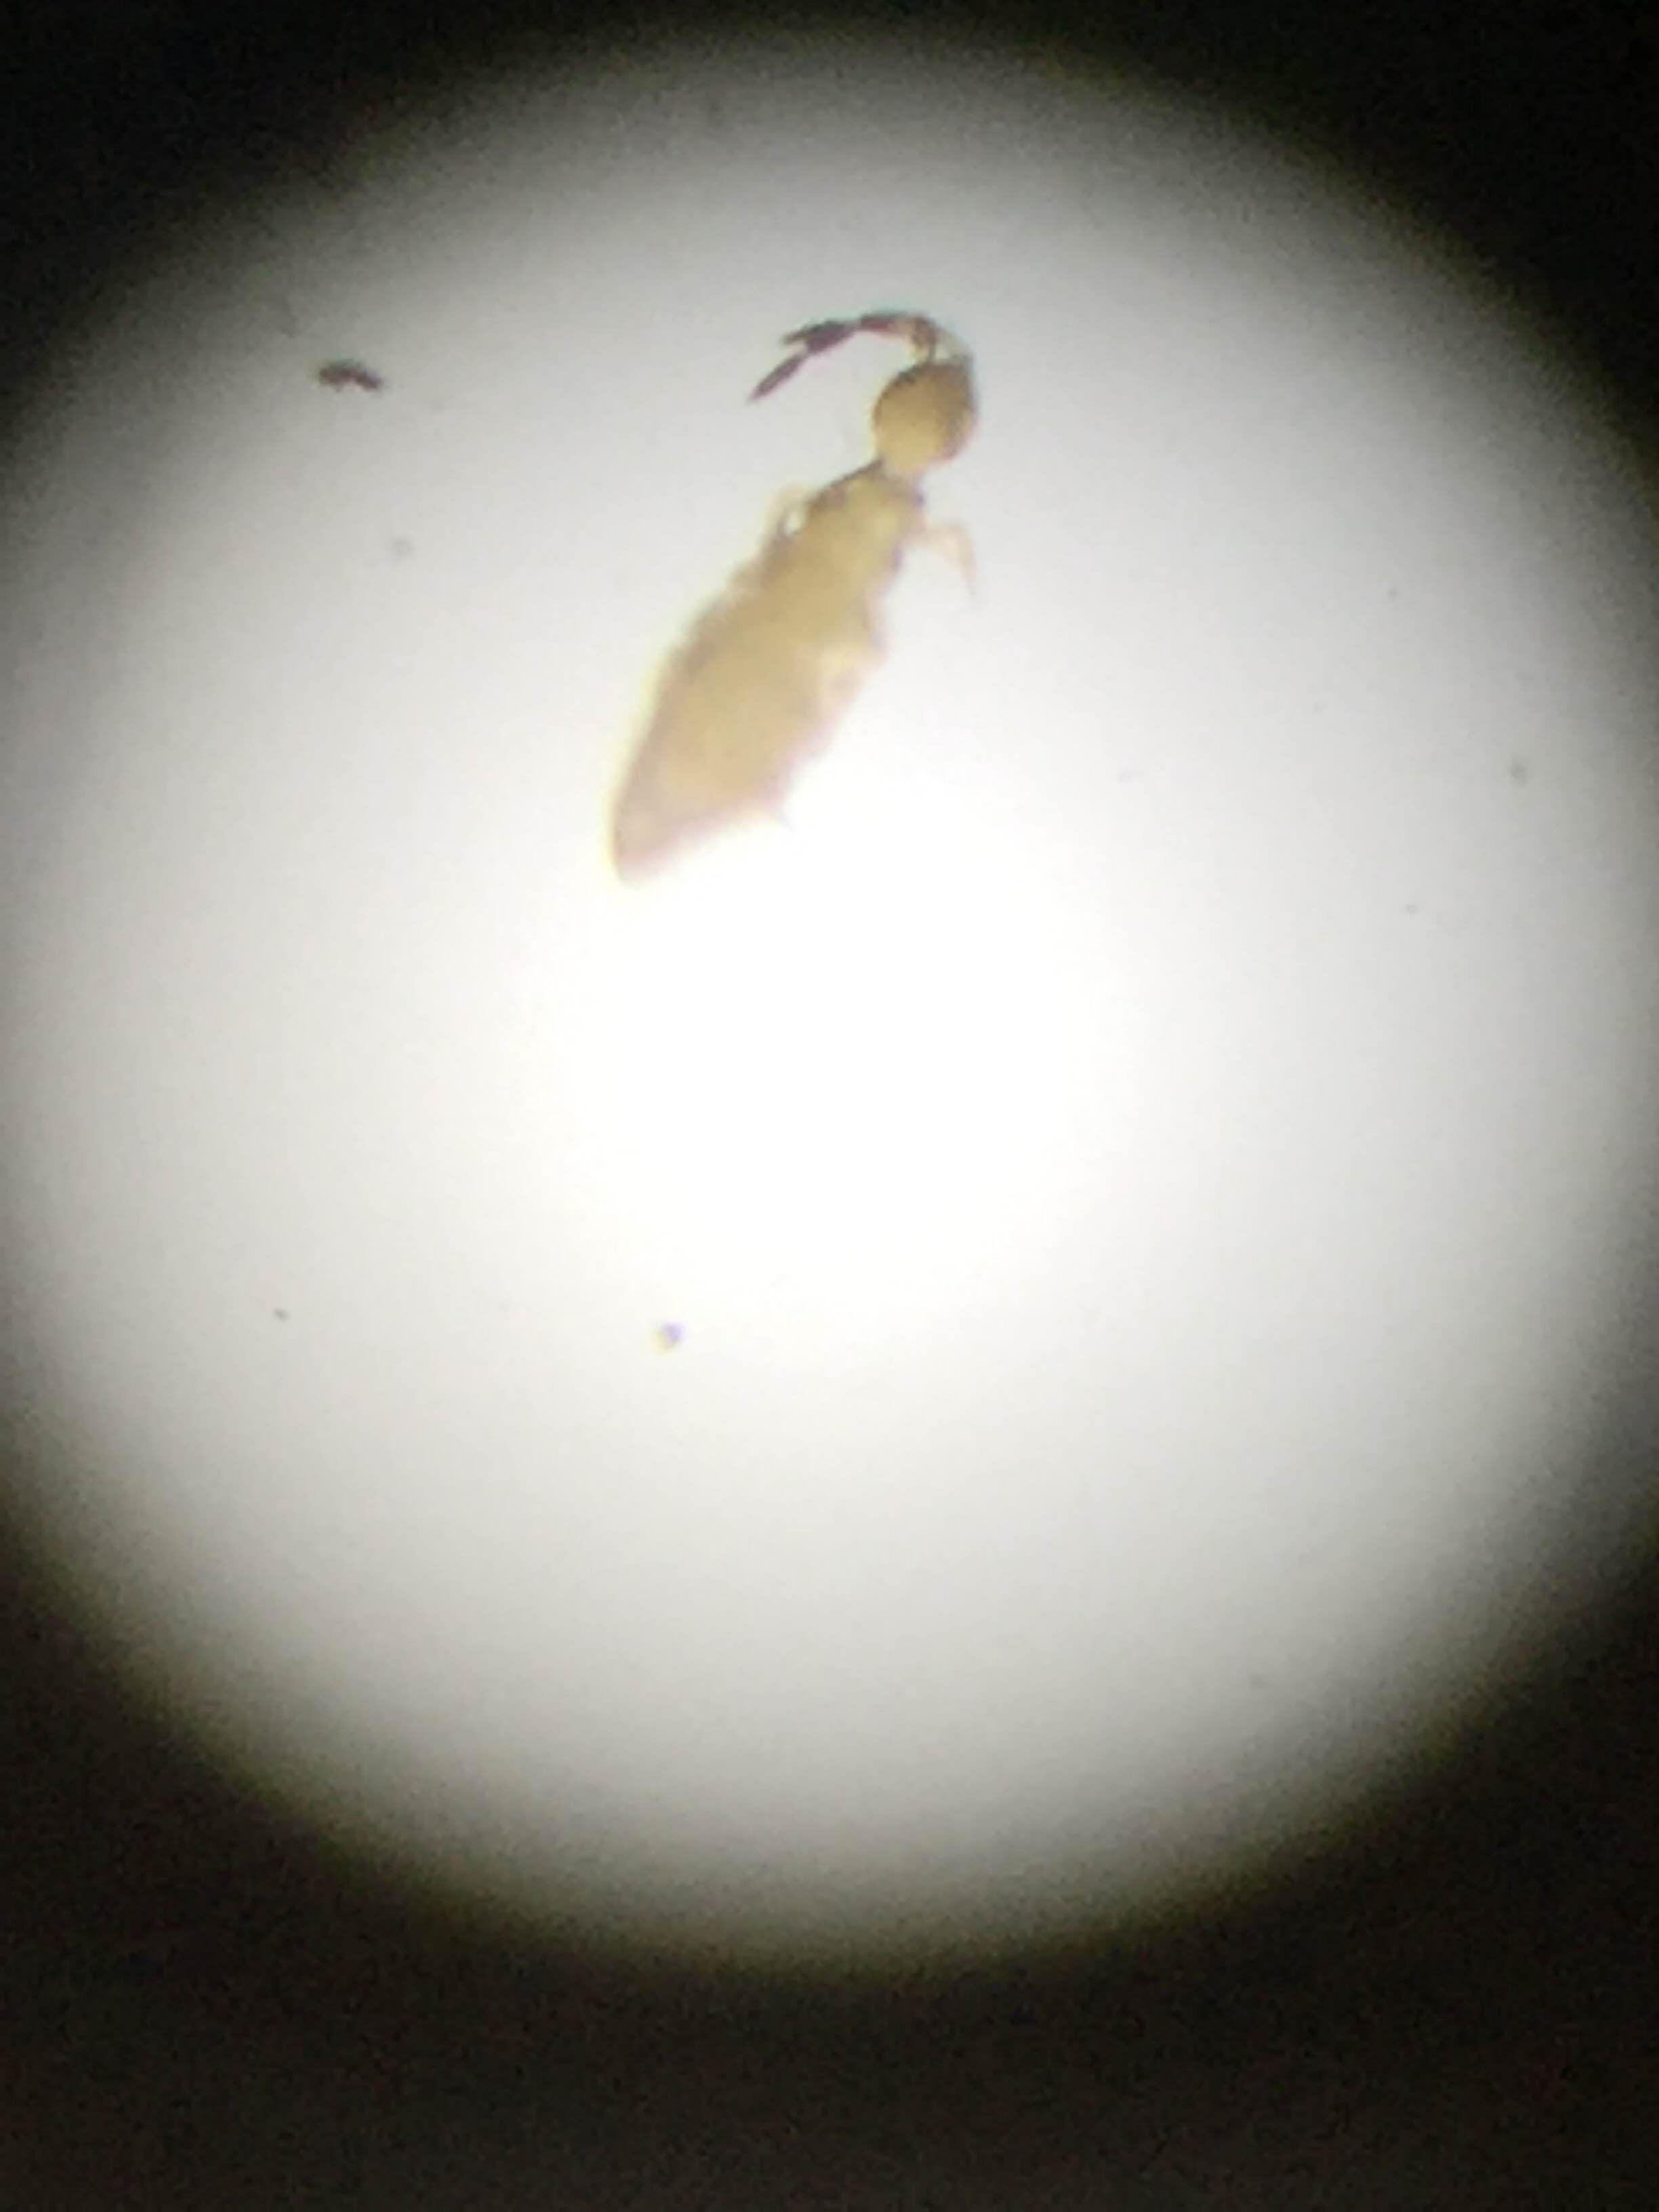
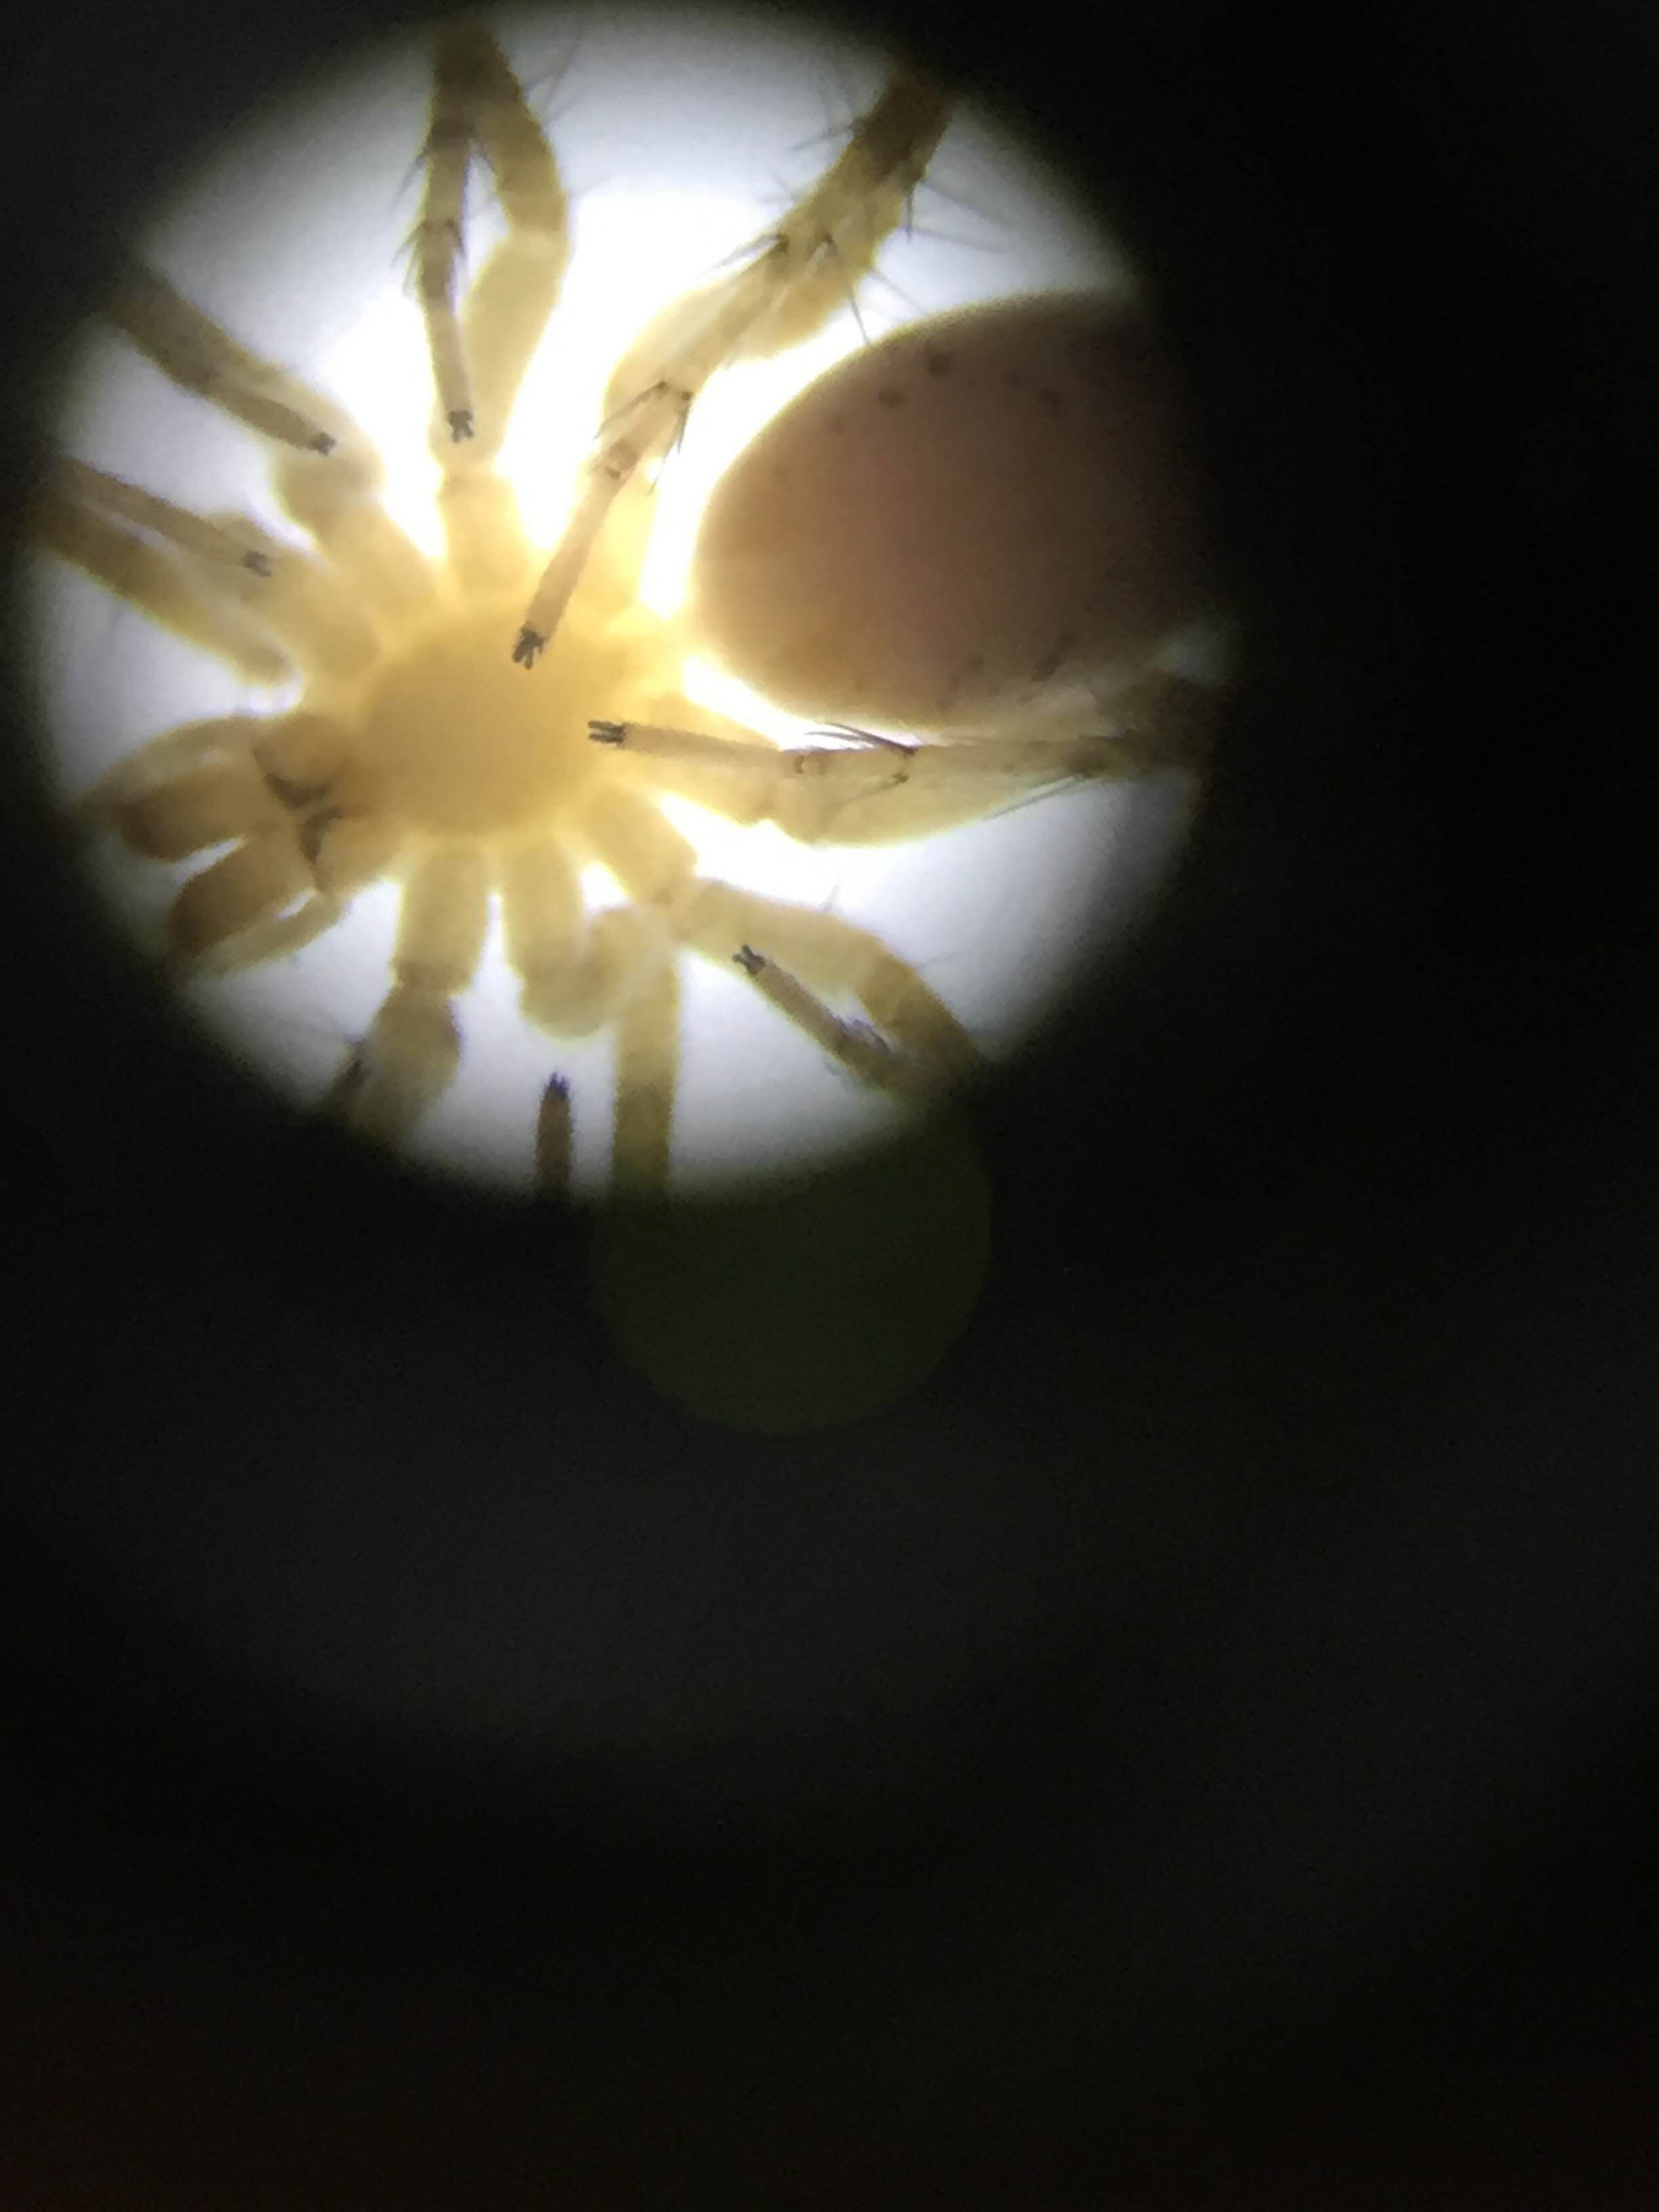
Invertebrate Characterization Organism (phylum) Length in mm Number in sample Description 1. Arthropoda ½-3 mm 2 Very small, black, small hairs, legs, nose-like projection 2. Arthropoda 2 mm 3 Very small, segmented, red color 3. Arthropoda 5 mm 1 Spider-like, 8 legs, brown in color 4. Arthropoda 1 mm 1 Small, black in color 5. Arthropoda 1 mm 1 Small, black, beetle-like, 2 segments, antennae
K.H.
""February 10, 2016""
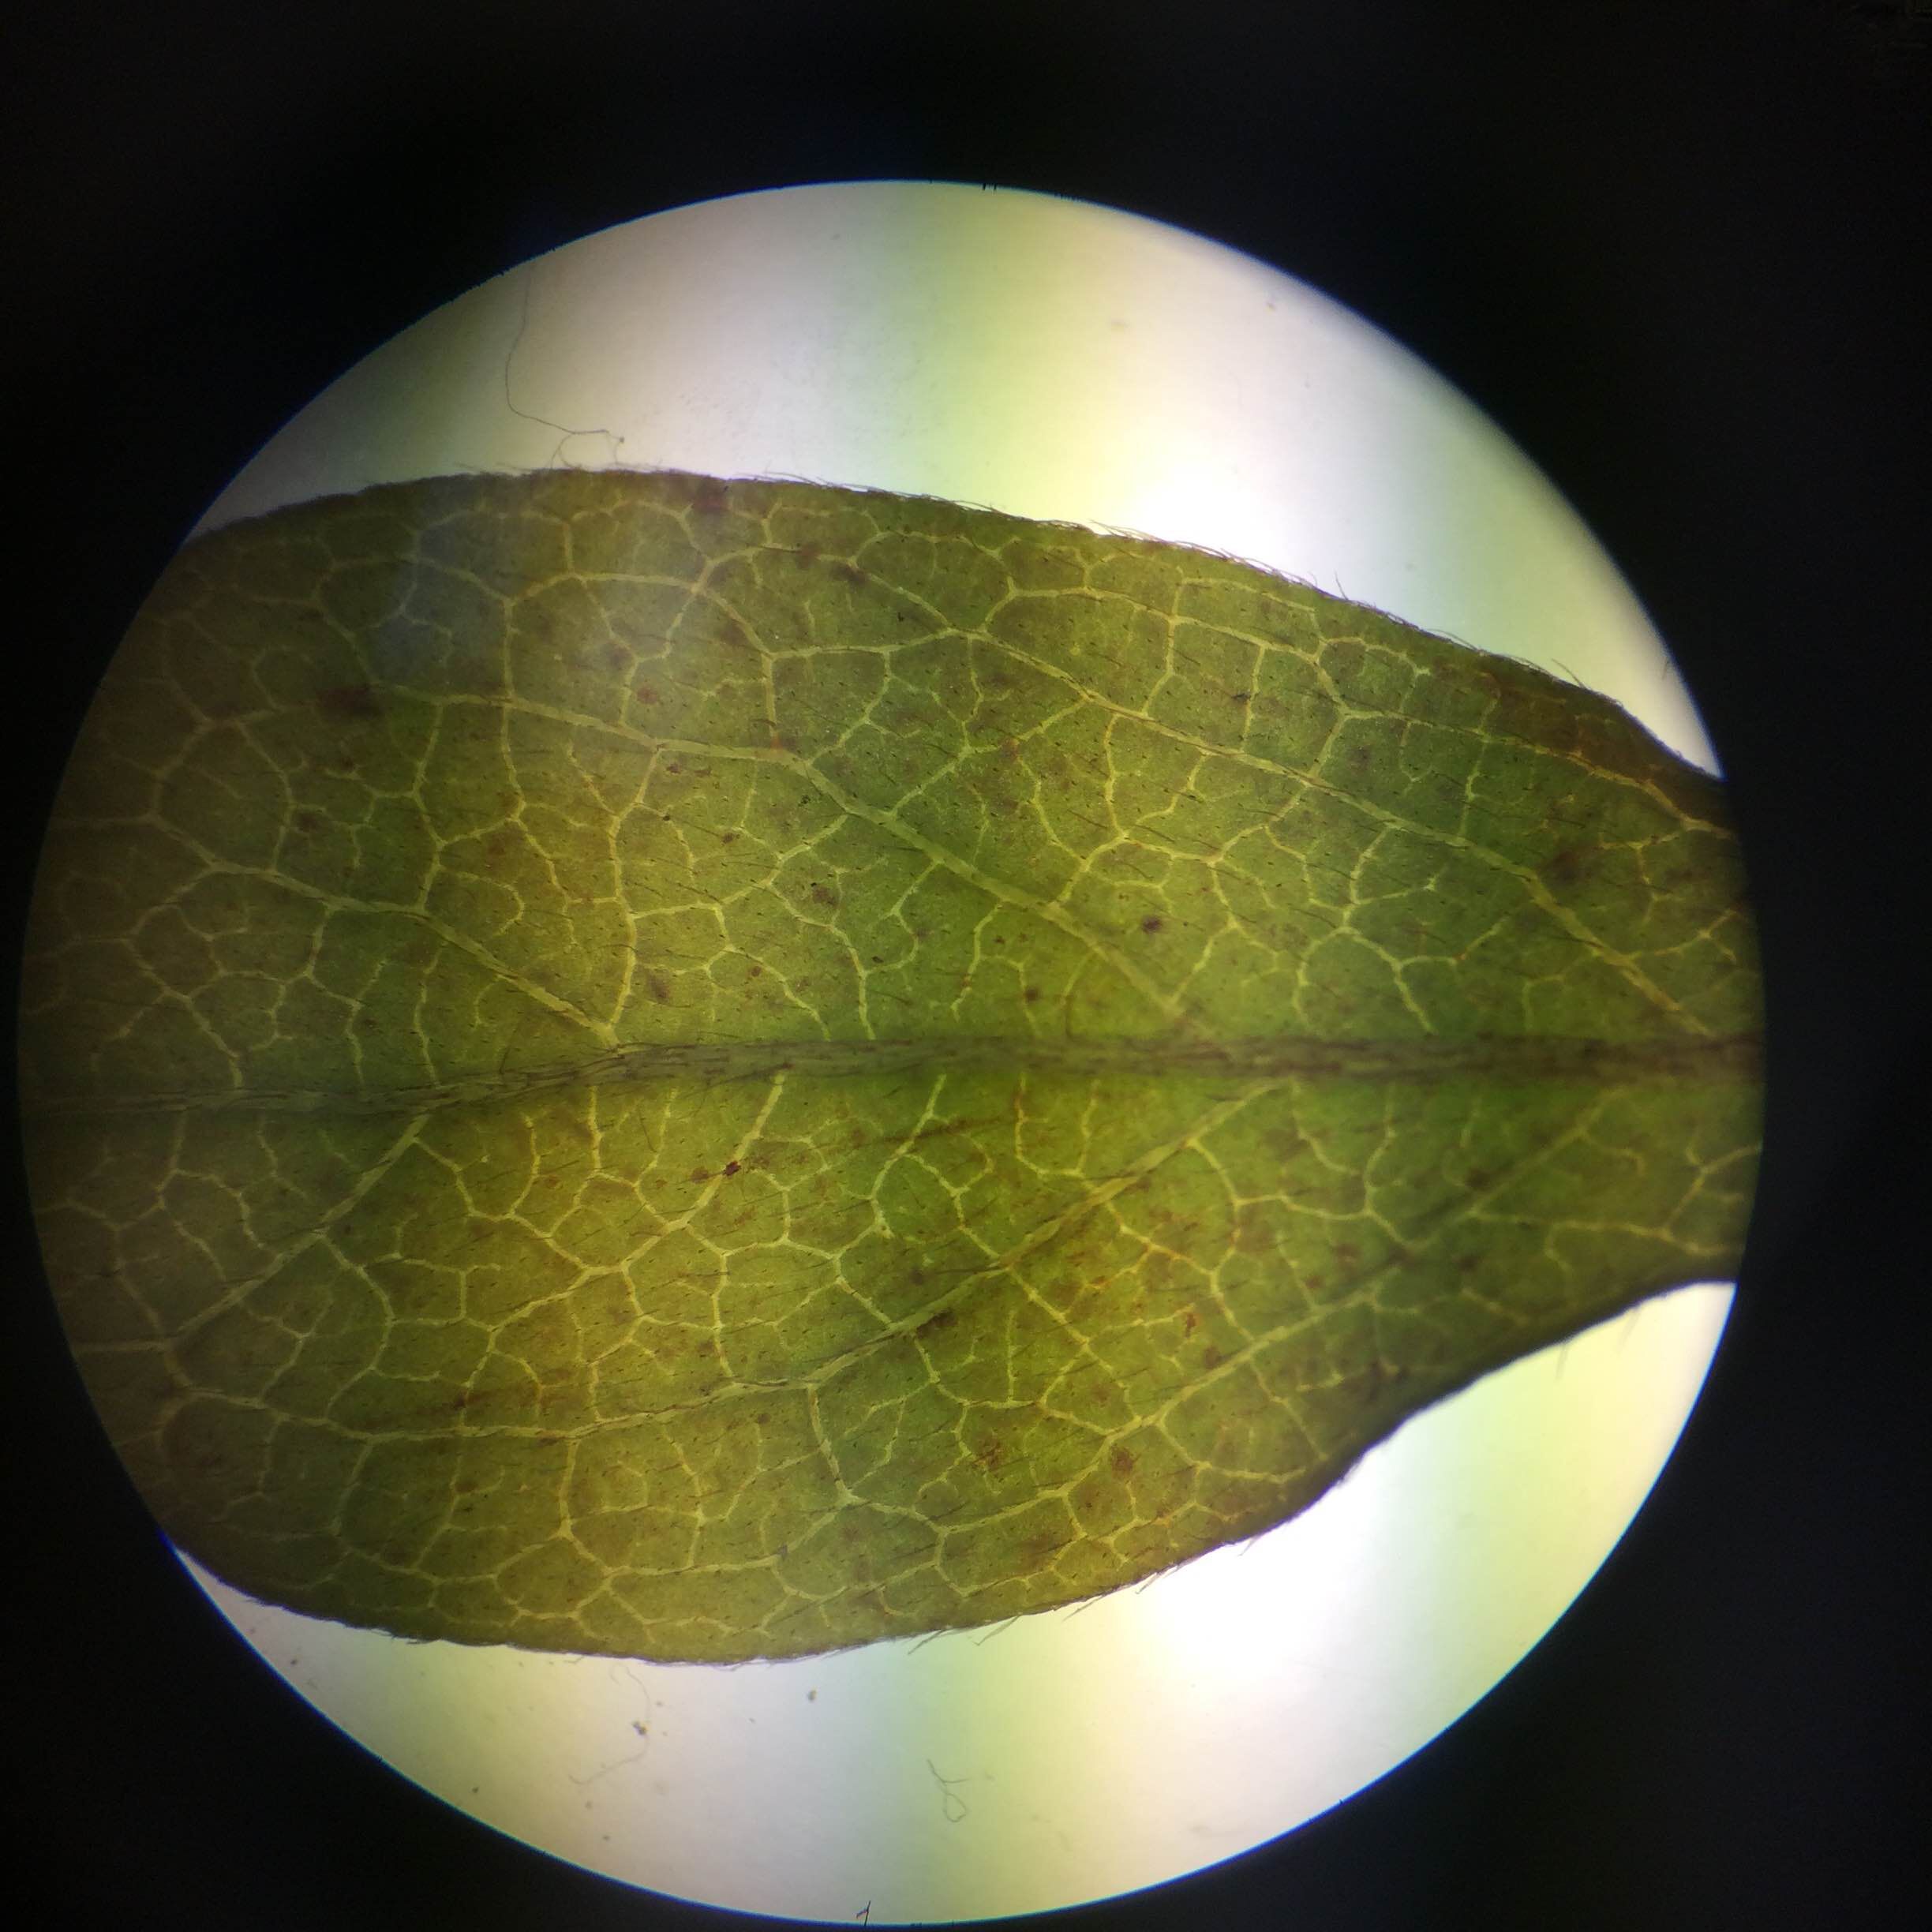
Table 1 - 5 Transect Plants and Locations Transect Sample Plants Location & # in transect Description (size & shape) Vascularization Specialized Structures Mechanisms of Reproduction
- 1 Fern Fern patch, ground Many small leaves, tall, long; 11 1/2 in Gymnosperm Vascular, spores Alternation of generations
- 2 Grass Ground, around dead leaves Tall, slim, flat; 16 3/4 in Angiosperm Monocot Double fertilization
- 3 Tree Leaf On tree branch, near edge of transect Circular, diagonal veins, small; 4 1/2 in Angiosperm Dicot, stomata Double fertilization
- 4 Ivy Leaf On ground, by stream Small, dark green, net-like veins; 2 in Angiosperm Dicot, stomata Double fertilization
- 5 Shrub Leaf From shrub lining the edge of transect Tiny, round, long; 1 1/2 in Angiosperm Dicot, stomata Double fertilization
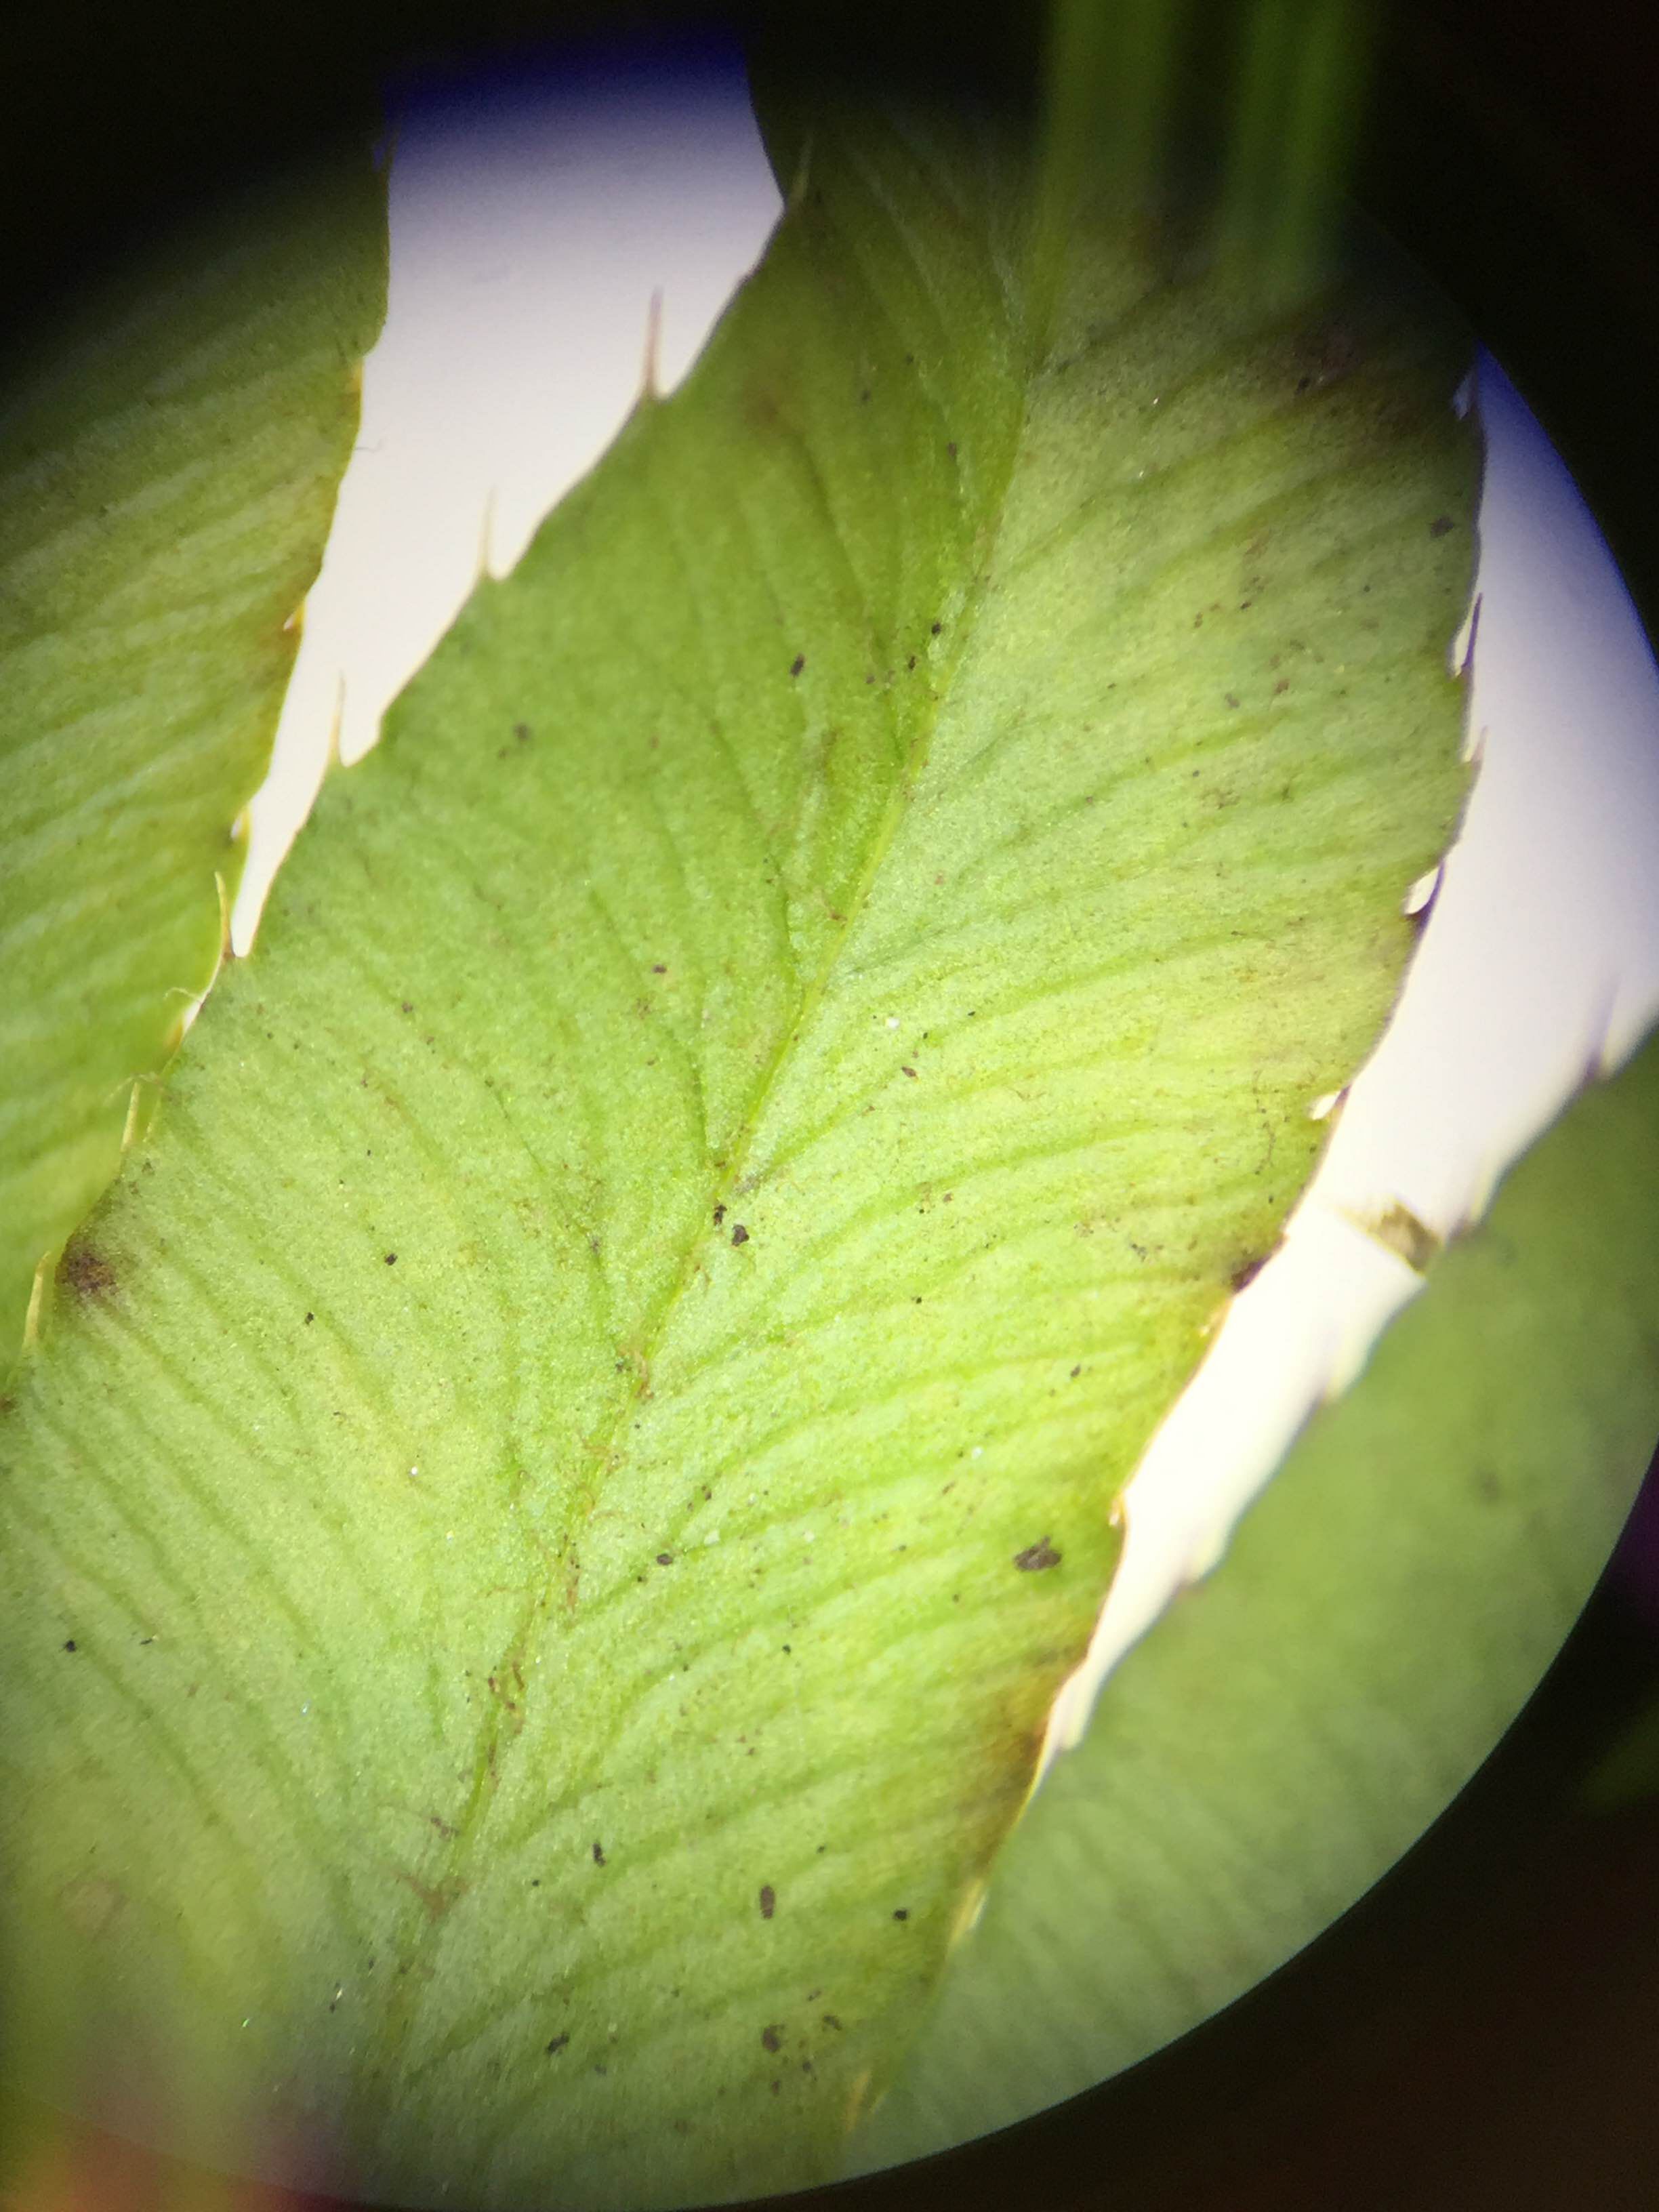
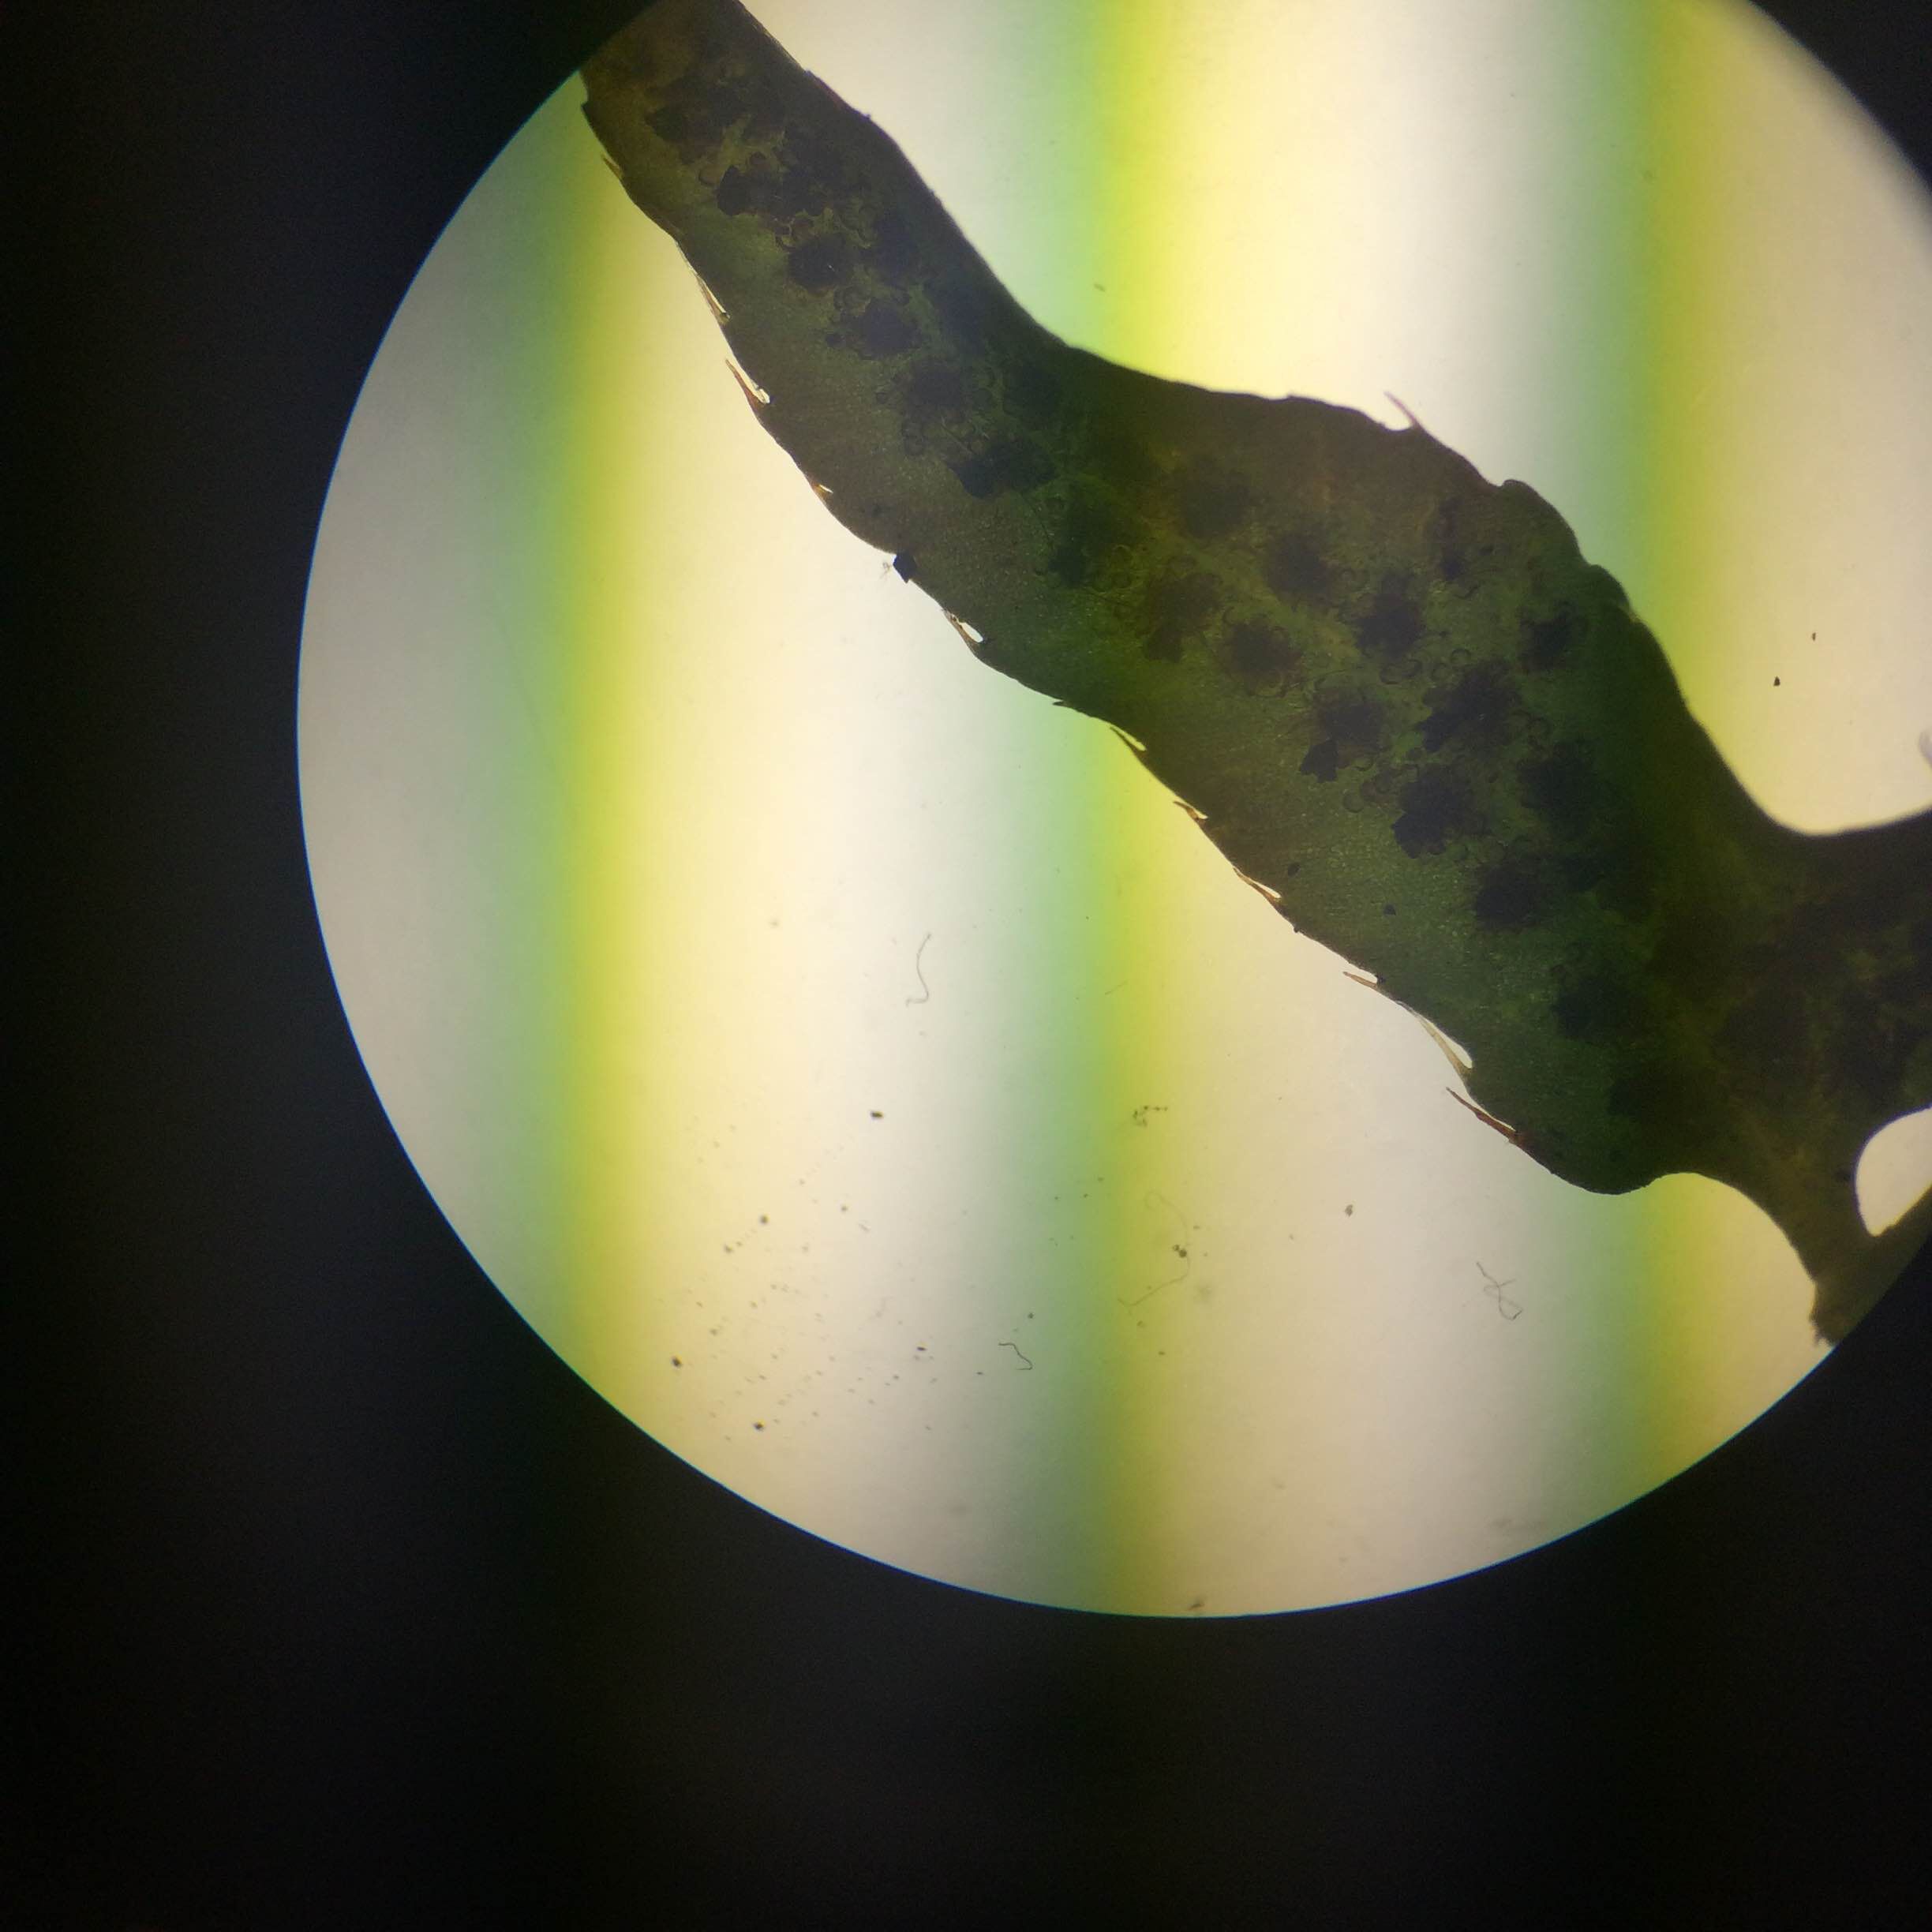
Transect Images
Fern
K.H.
""February 3, 2016""
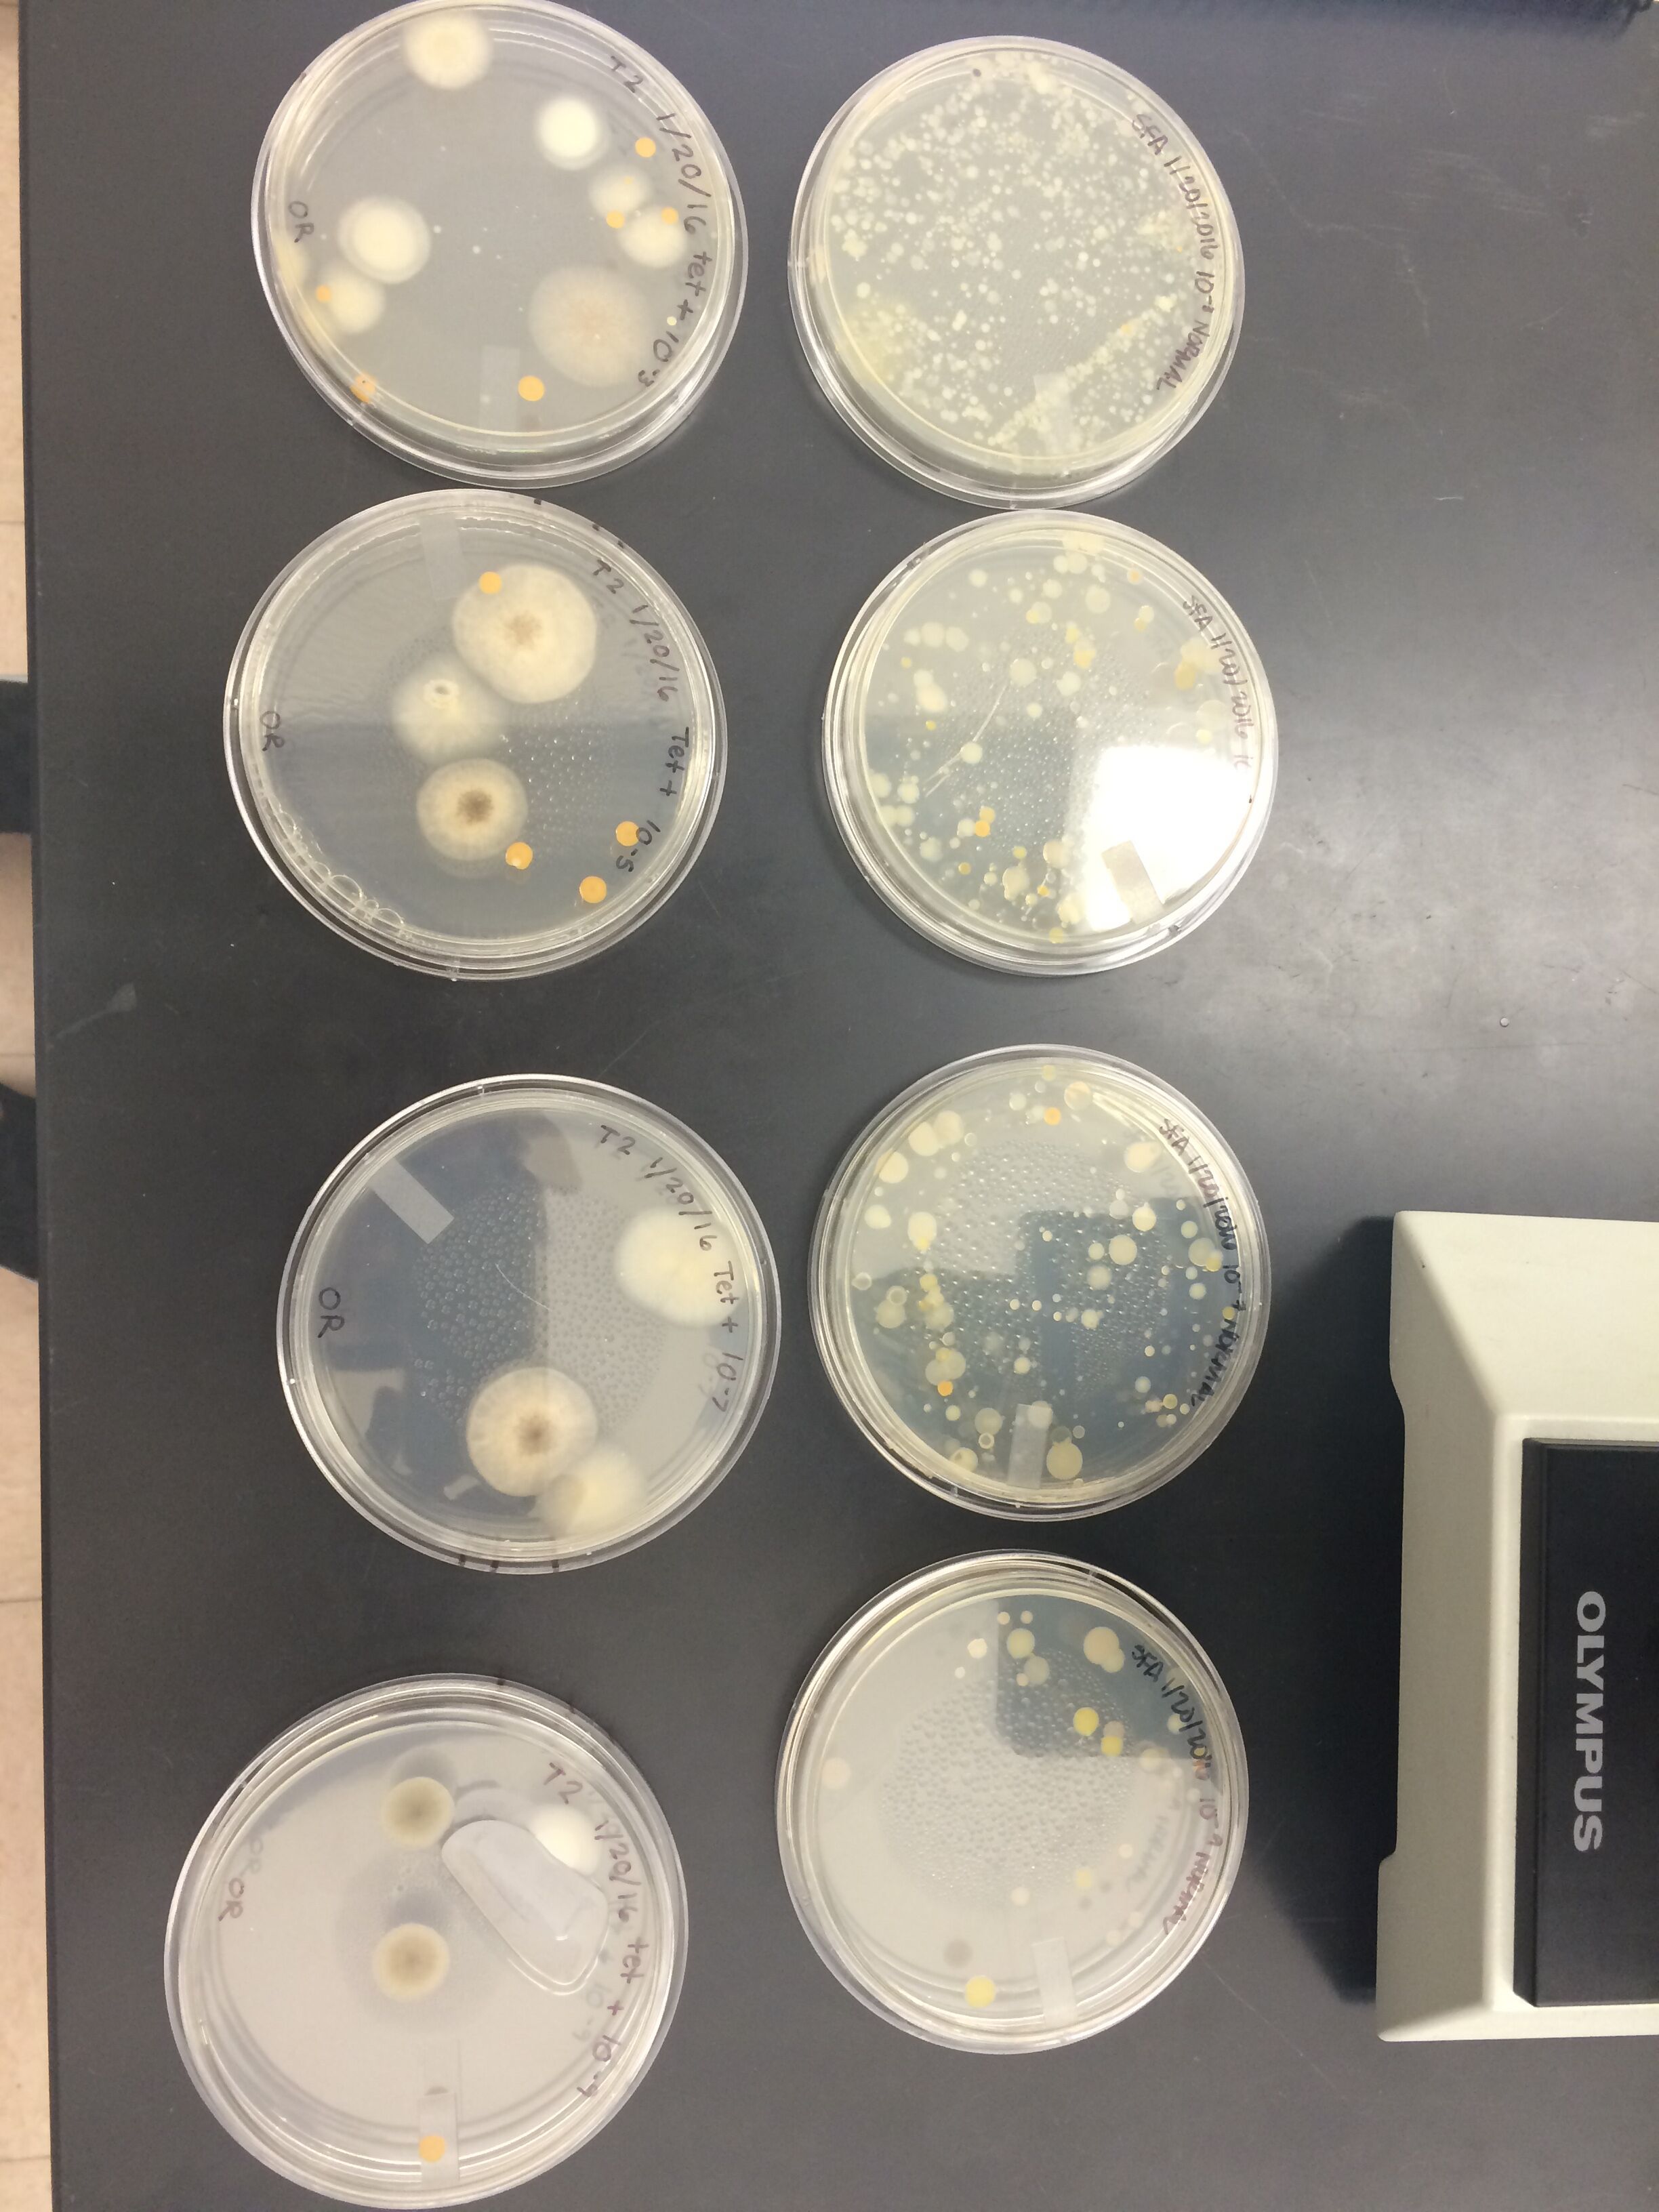
Table 1: Serial Dilutions Results Dilution Agar Type # Colonies on Plate Conversion Factor Colonies/mL 10-3 Nutrient Lawn X103 10-5 Nutrient ~100 X105 10,000,000 10-7 Nutrient ~90 X107 900,000,000 10-9 Nutrient ~27 X109 27,000,000,000 10-3 Nutrient + tet 16 X103 16,000 10-5 Nutrient + tet 7 X10⁵ 700,000 10-7 Nutrient + tet 3 X10⁷ 30,000,000 10-9 Nutrient + tet 4 X10⁹ 4,000,000,000
The colonies where tetracycline was not present were much more populated and spread out, compared to those where the antibiotic was present, there were much fewer colonies. This indicates that the antibiotic is successful in inhibiting bacterial growth. Therefore, the total effect of tetracycline on numbers of bacteria is that it decreases the amount present within the colonies. -Tetracycline works by attacking the ribosomes within the bacteria in order to inhibit the continuous growth and spread (Cassie Gould, Microbiology PowerPoint).
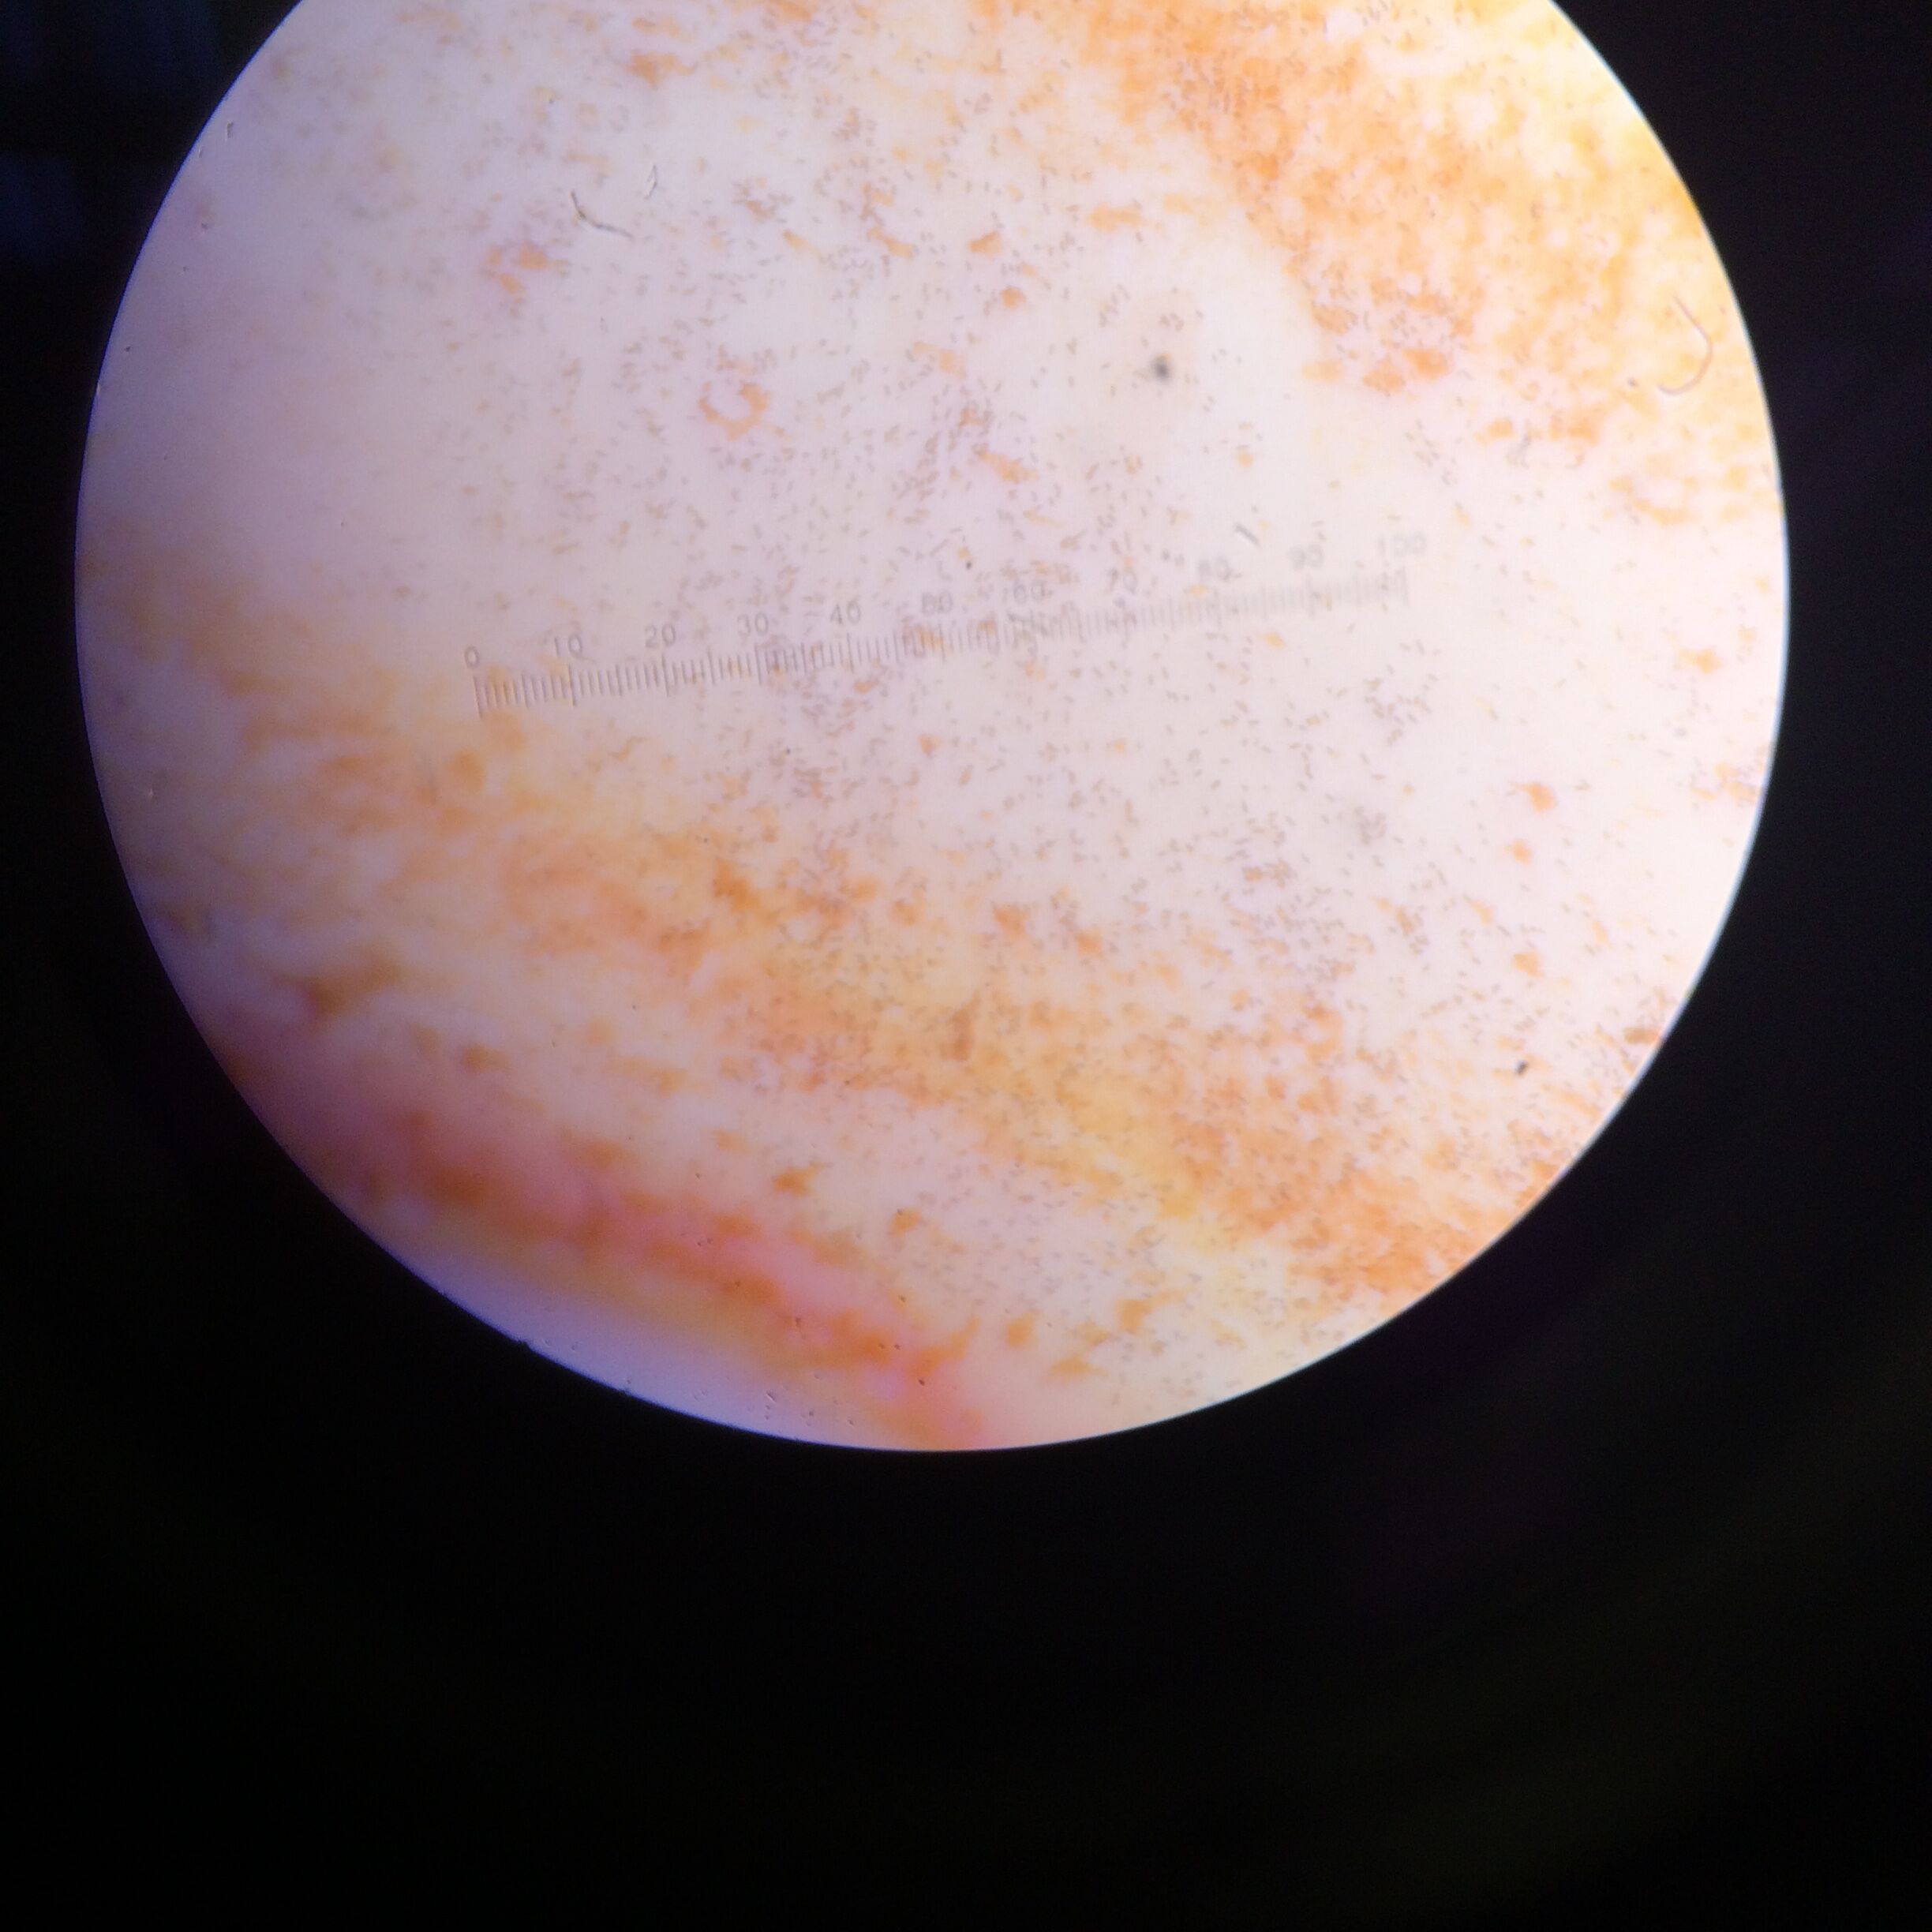
Table 2: Bacteria Characterization Colony Label Plate Type Colony Description Cell Description Gram + or Gram - 10-7 Tet (+) Round, white/pink, slightly raised Bacillus, no motility Stained purple/blue = Gram + 10-9 Tet (+) Round, dark grey and green, slightly raised Bacillus, no motility Dark purple/blue = Gram + 10-5 Tet (-) Small white and orange circles, scattered Coccus, fast moving Dark red/pink = Gram - 10-9 Tet (-) Small white and orange dots, spread out, raised Coccus, no motility Very light pink/orange = Gram -
Materials and Methods:
Gram Stain
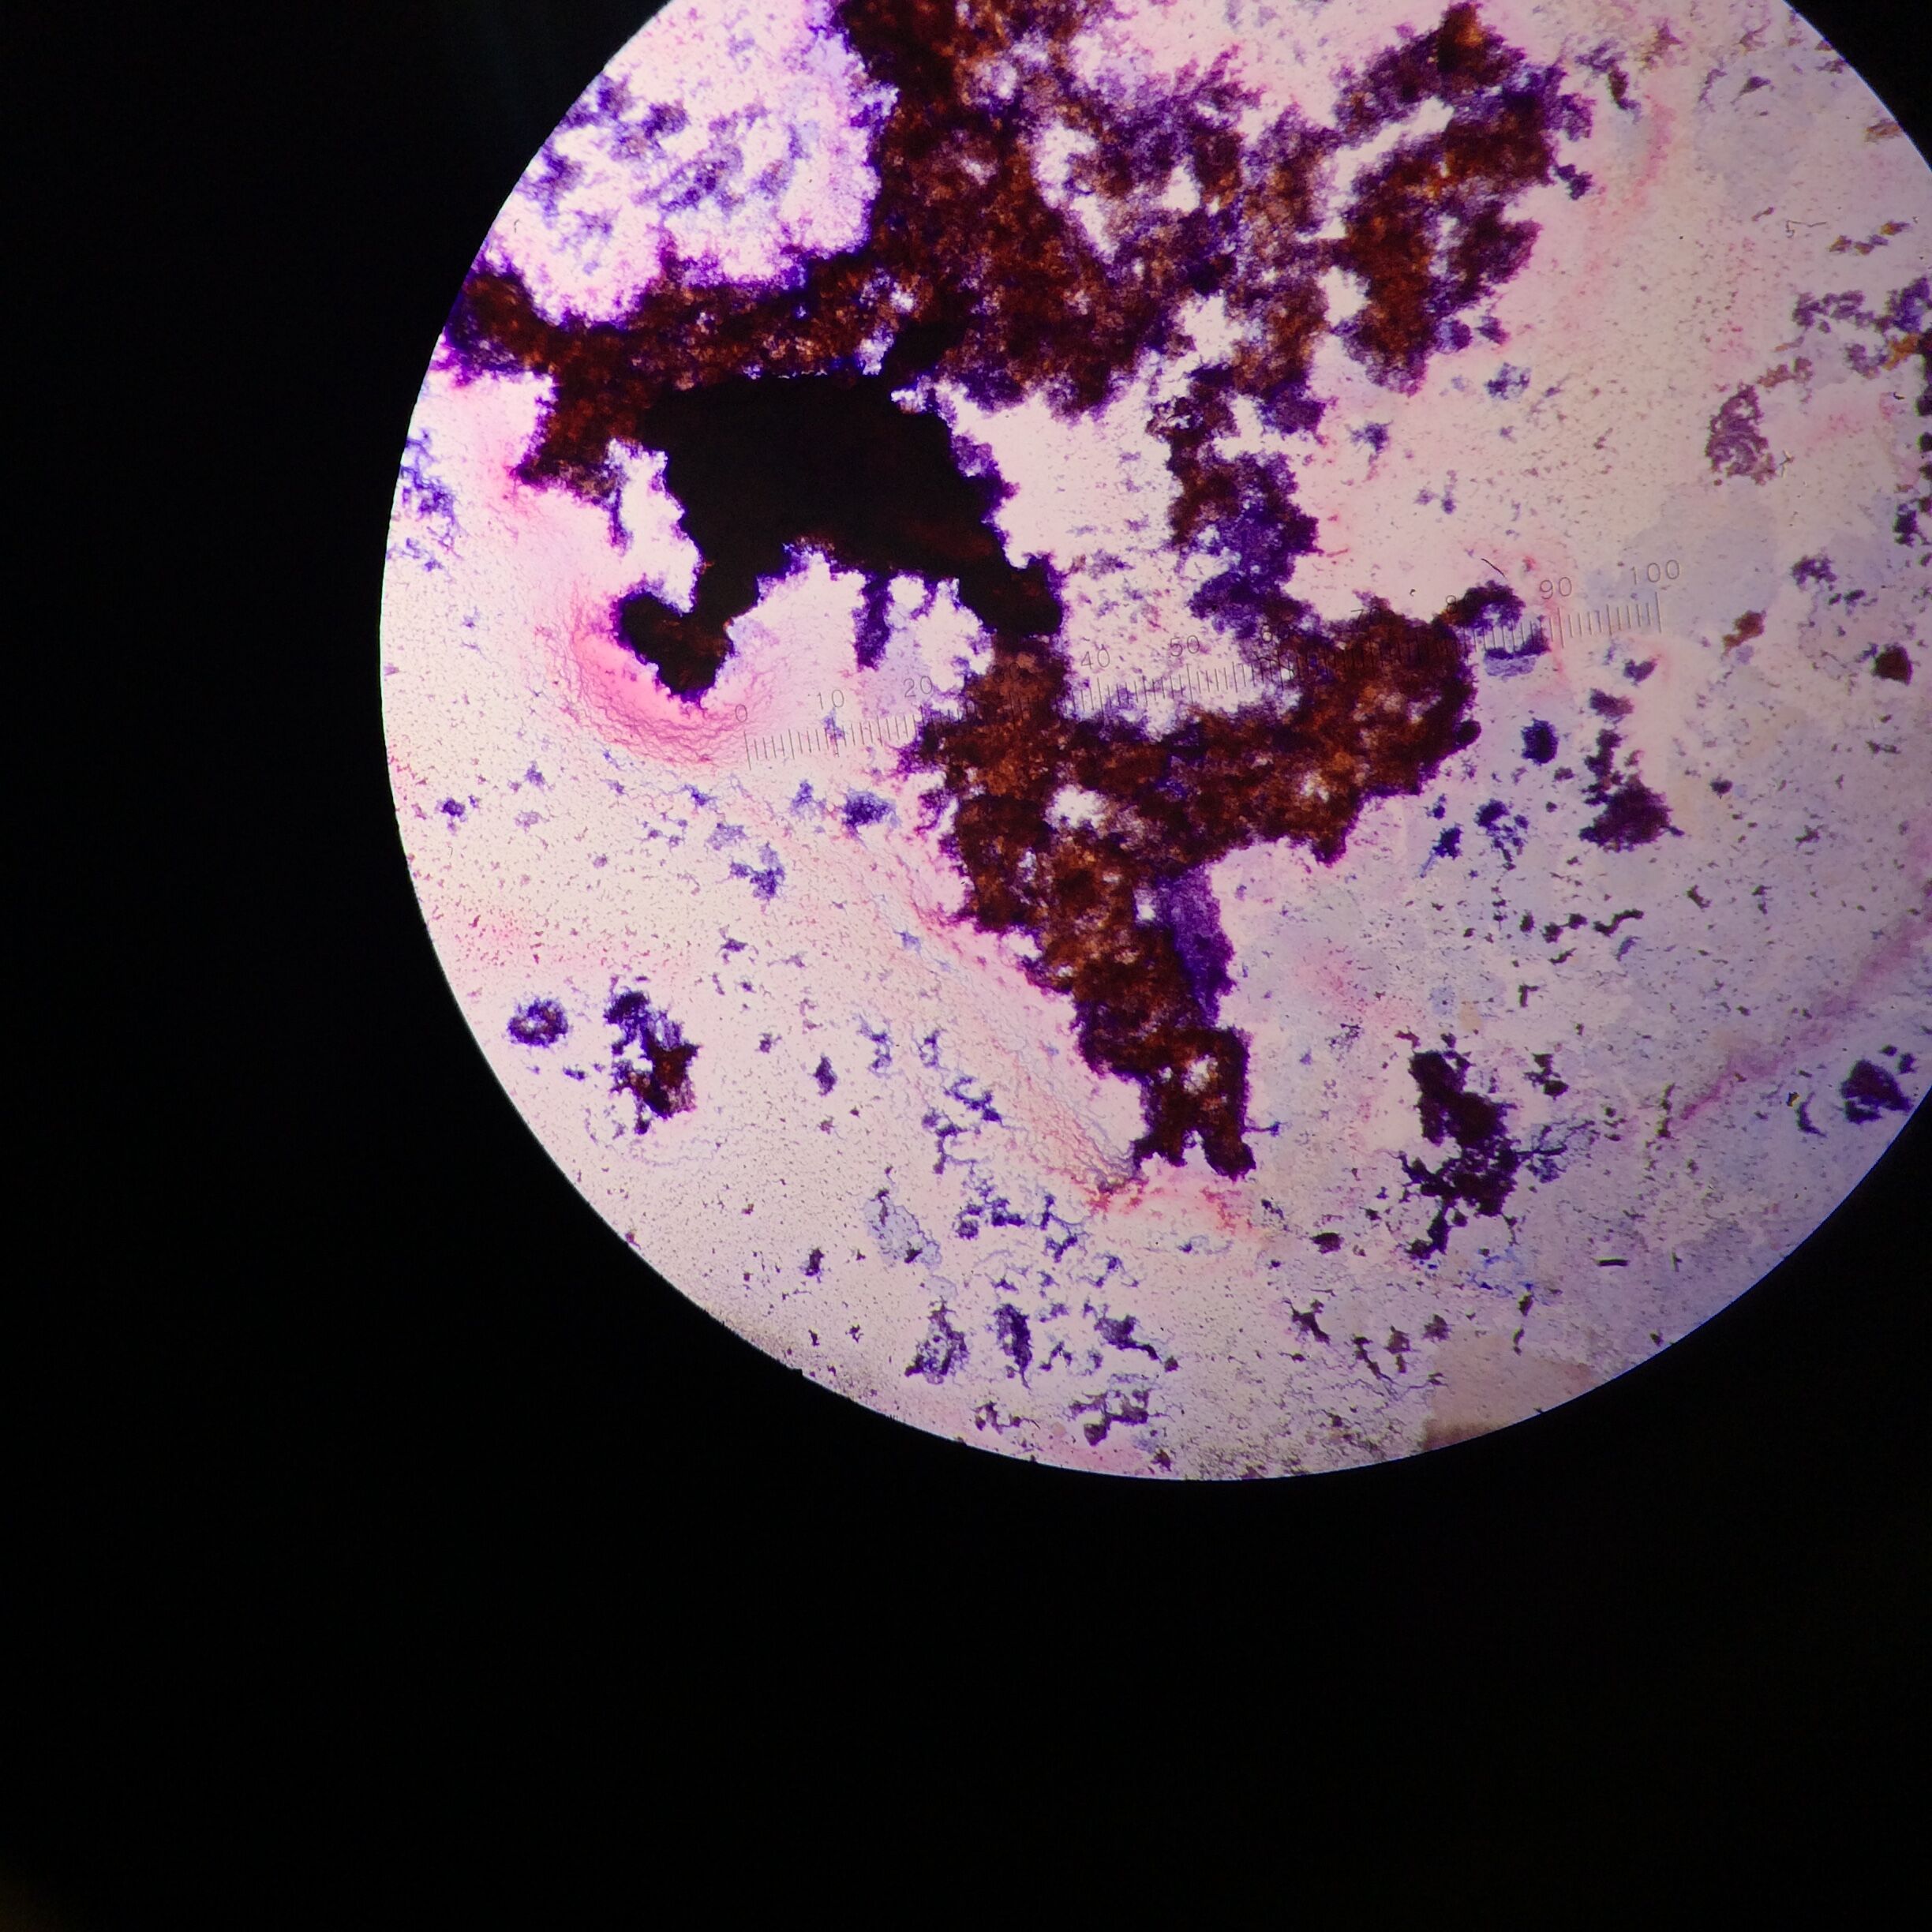
-A loop was sterilized over a flame and then used to gather a sample of the bacteria which was then placed on a slide and mixed with water. It was heat fixed by being passed over a flame and then placed in the staining tray. It was first washed with crystal violet for one minute, then rinsed off with water. Then the Gram's iodine mordant was added next for one minute and washed off with water. Finally, a 95% alcohol solution was used to remove the color and put on slide for around 20 seconds. It was washed off with water one final time and the excess liquid was blotted and then the slide was examined under a microscope.
DNA Isolation and PCR Isolation -20 micro liters of a primer and water mixture were added to 2 PCR tubes respectively labeled to identify transect, group number, and colony. The mixture was shaken to properly mix the solution and ensure that it is all in the bottom of the tube. Then, using a sterile toothpick, a piece of the examined bacterial colony was added to their respective PCR tubes and shaken and placed in the PCR machine.
K.H.
""January 27, 2016""
Initial Observations for Hay Infusion - Film on top of infusion is much thicker and whiter in color - A lot of water seemed to have evaporated - Much more sediment on the bottom of the infusion - Plant matter much more decomposed, soggy, and flat - Smell is much more pungent Hypothesis: Appearance and smell may change from week to week because of the great amounts of decomposition within the infusion. The decomposition could be a result of the specimens living within the infusion and how they feed on what is inside, affecting the appearance. The smell may come from the milk that was added in the beginning rotting and decomposing, leading to the pungent smell.
-Archaea species may not have grown on the agar plates prepared because most archaea live in very extreme environments, and the hay infusion is far from an extreme environment. -All three protist samples grown in the agar plates came from the bottom portion of the hay infusion --struggled to find any specimen within the first layers
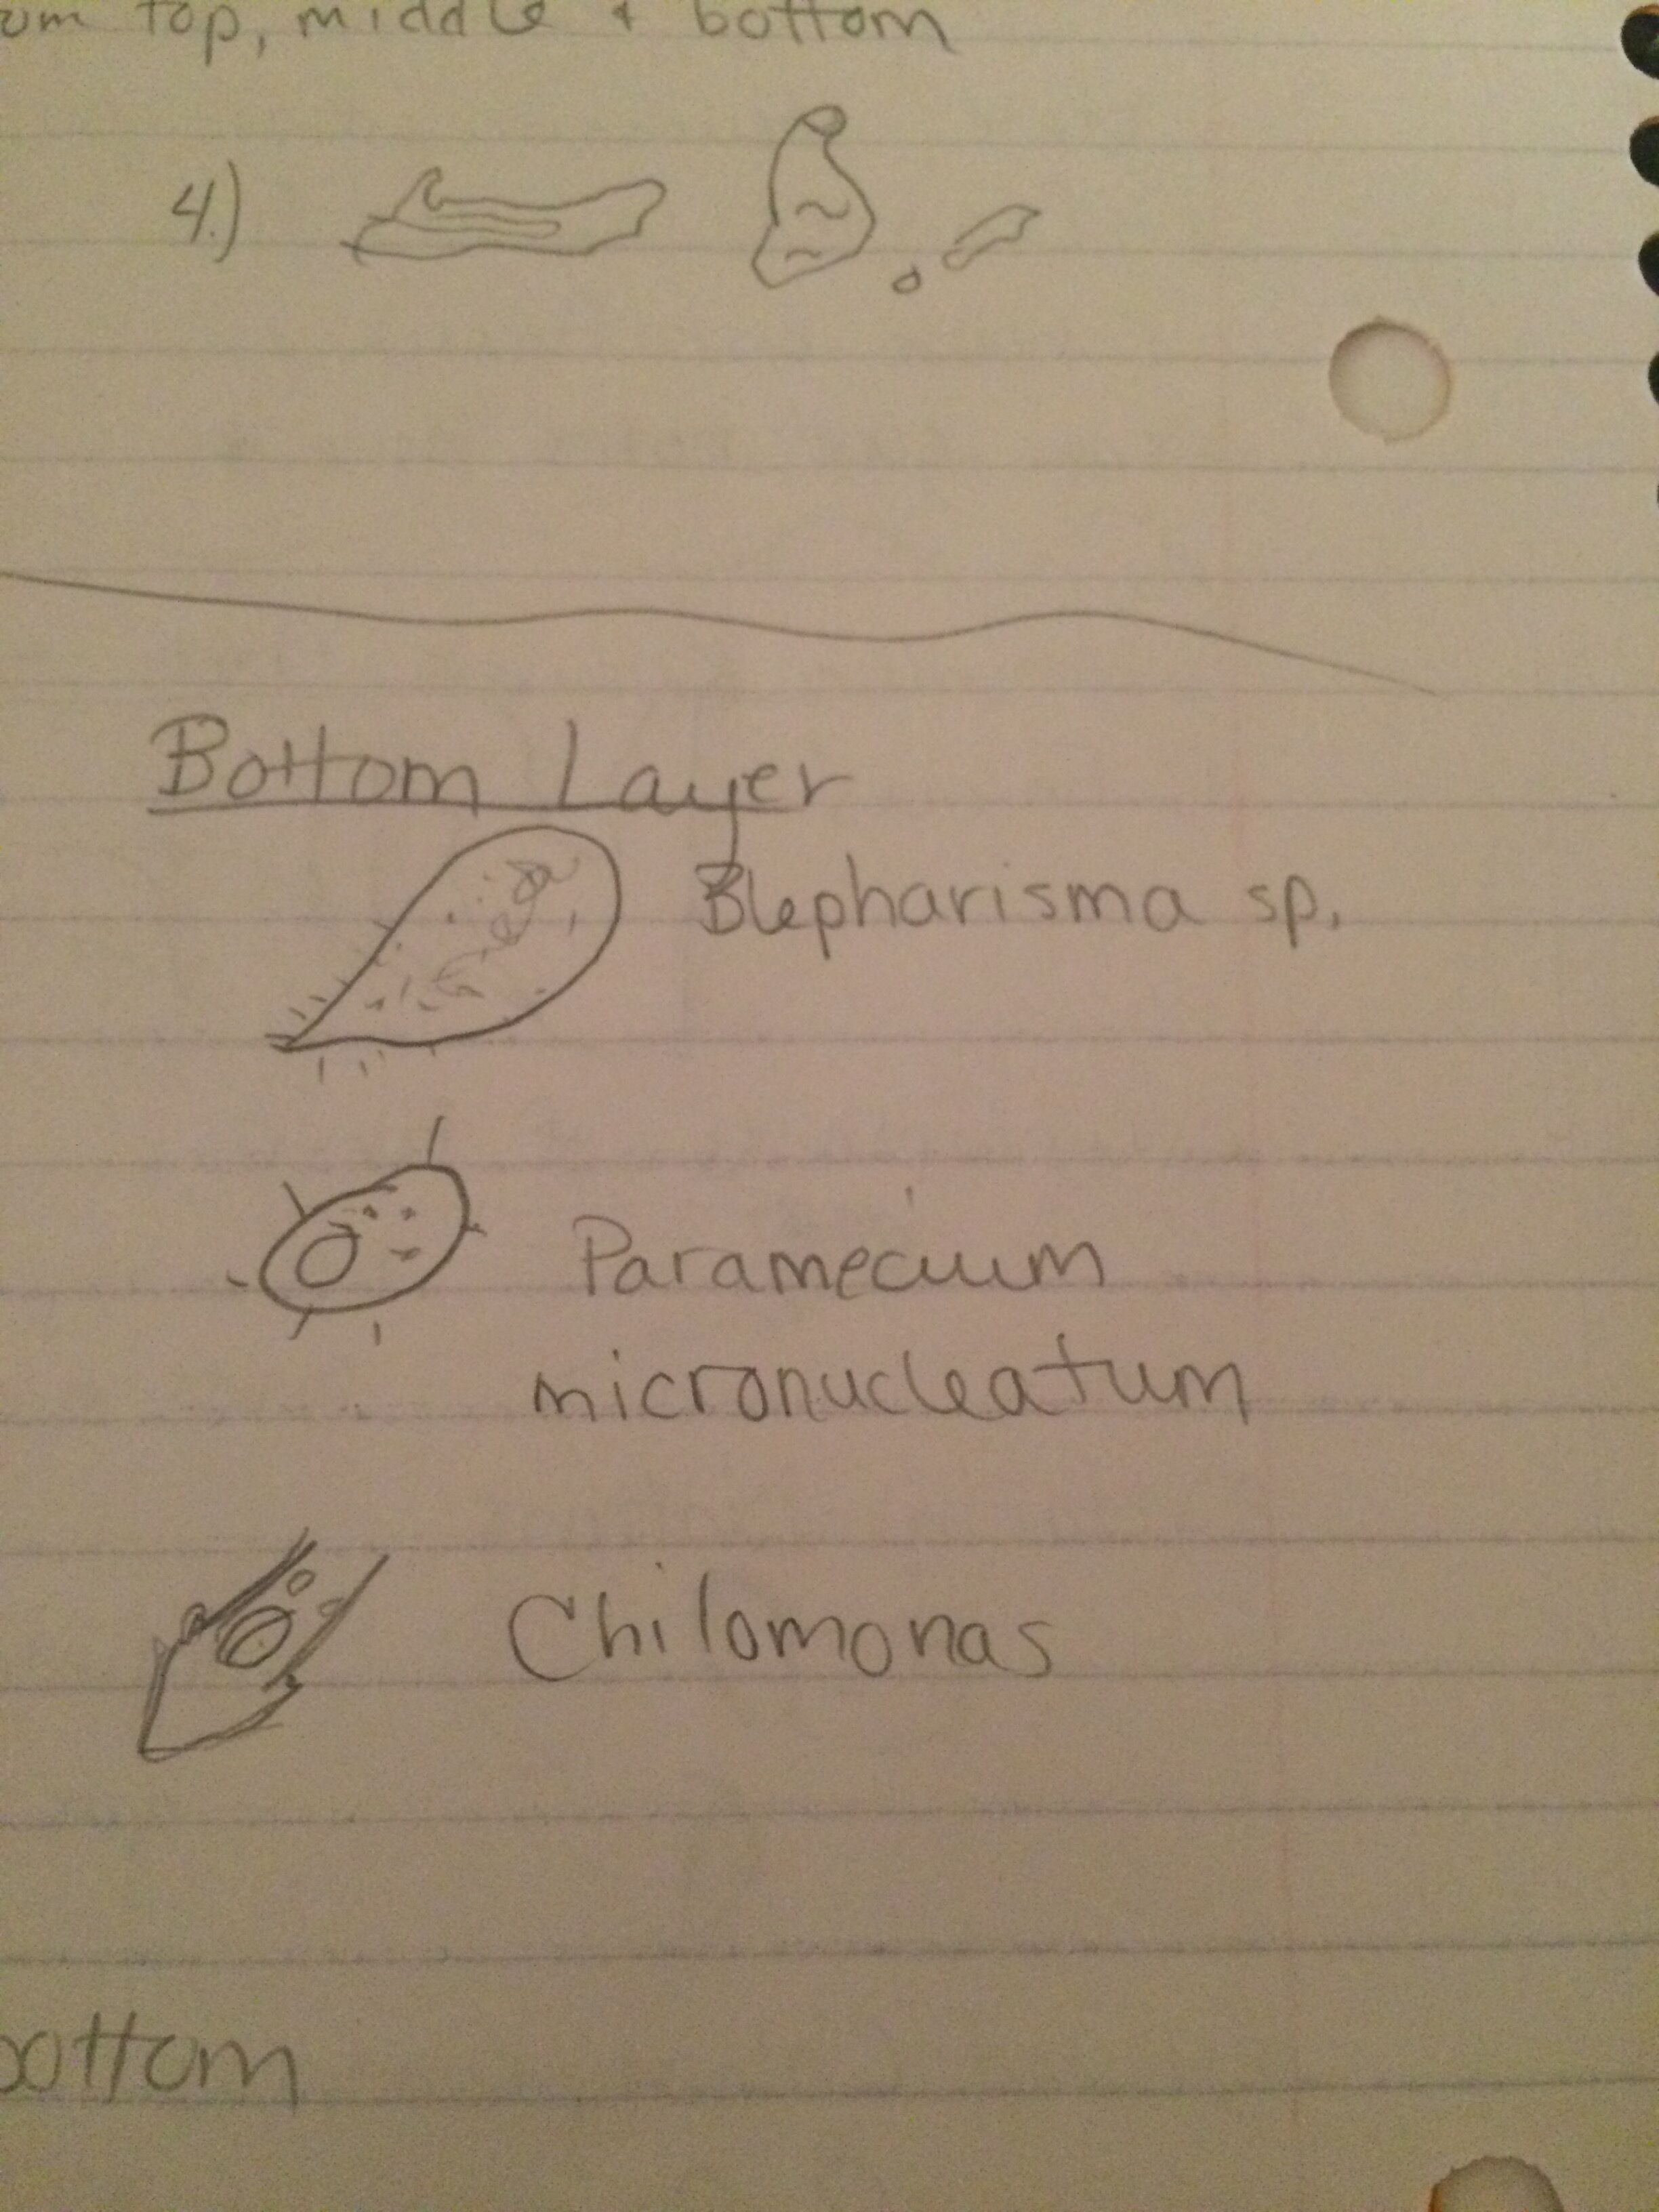
Protist Samples -Most of the protists identified were colorless and slow moving, if at all -There were some species that were very fast moving -Very little color, only one sample showed specimen with color Protists Identified --> Blepharisma sp., Paramecium micronucleatum, and Chilomonas --found it difficult to use the dichotomous key and have a confident identification of the specific specimen
Picture of Protists Found within Hay Infusion
K.H.
January 20, 2016
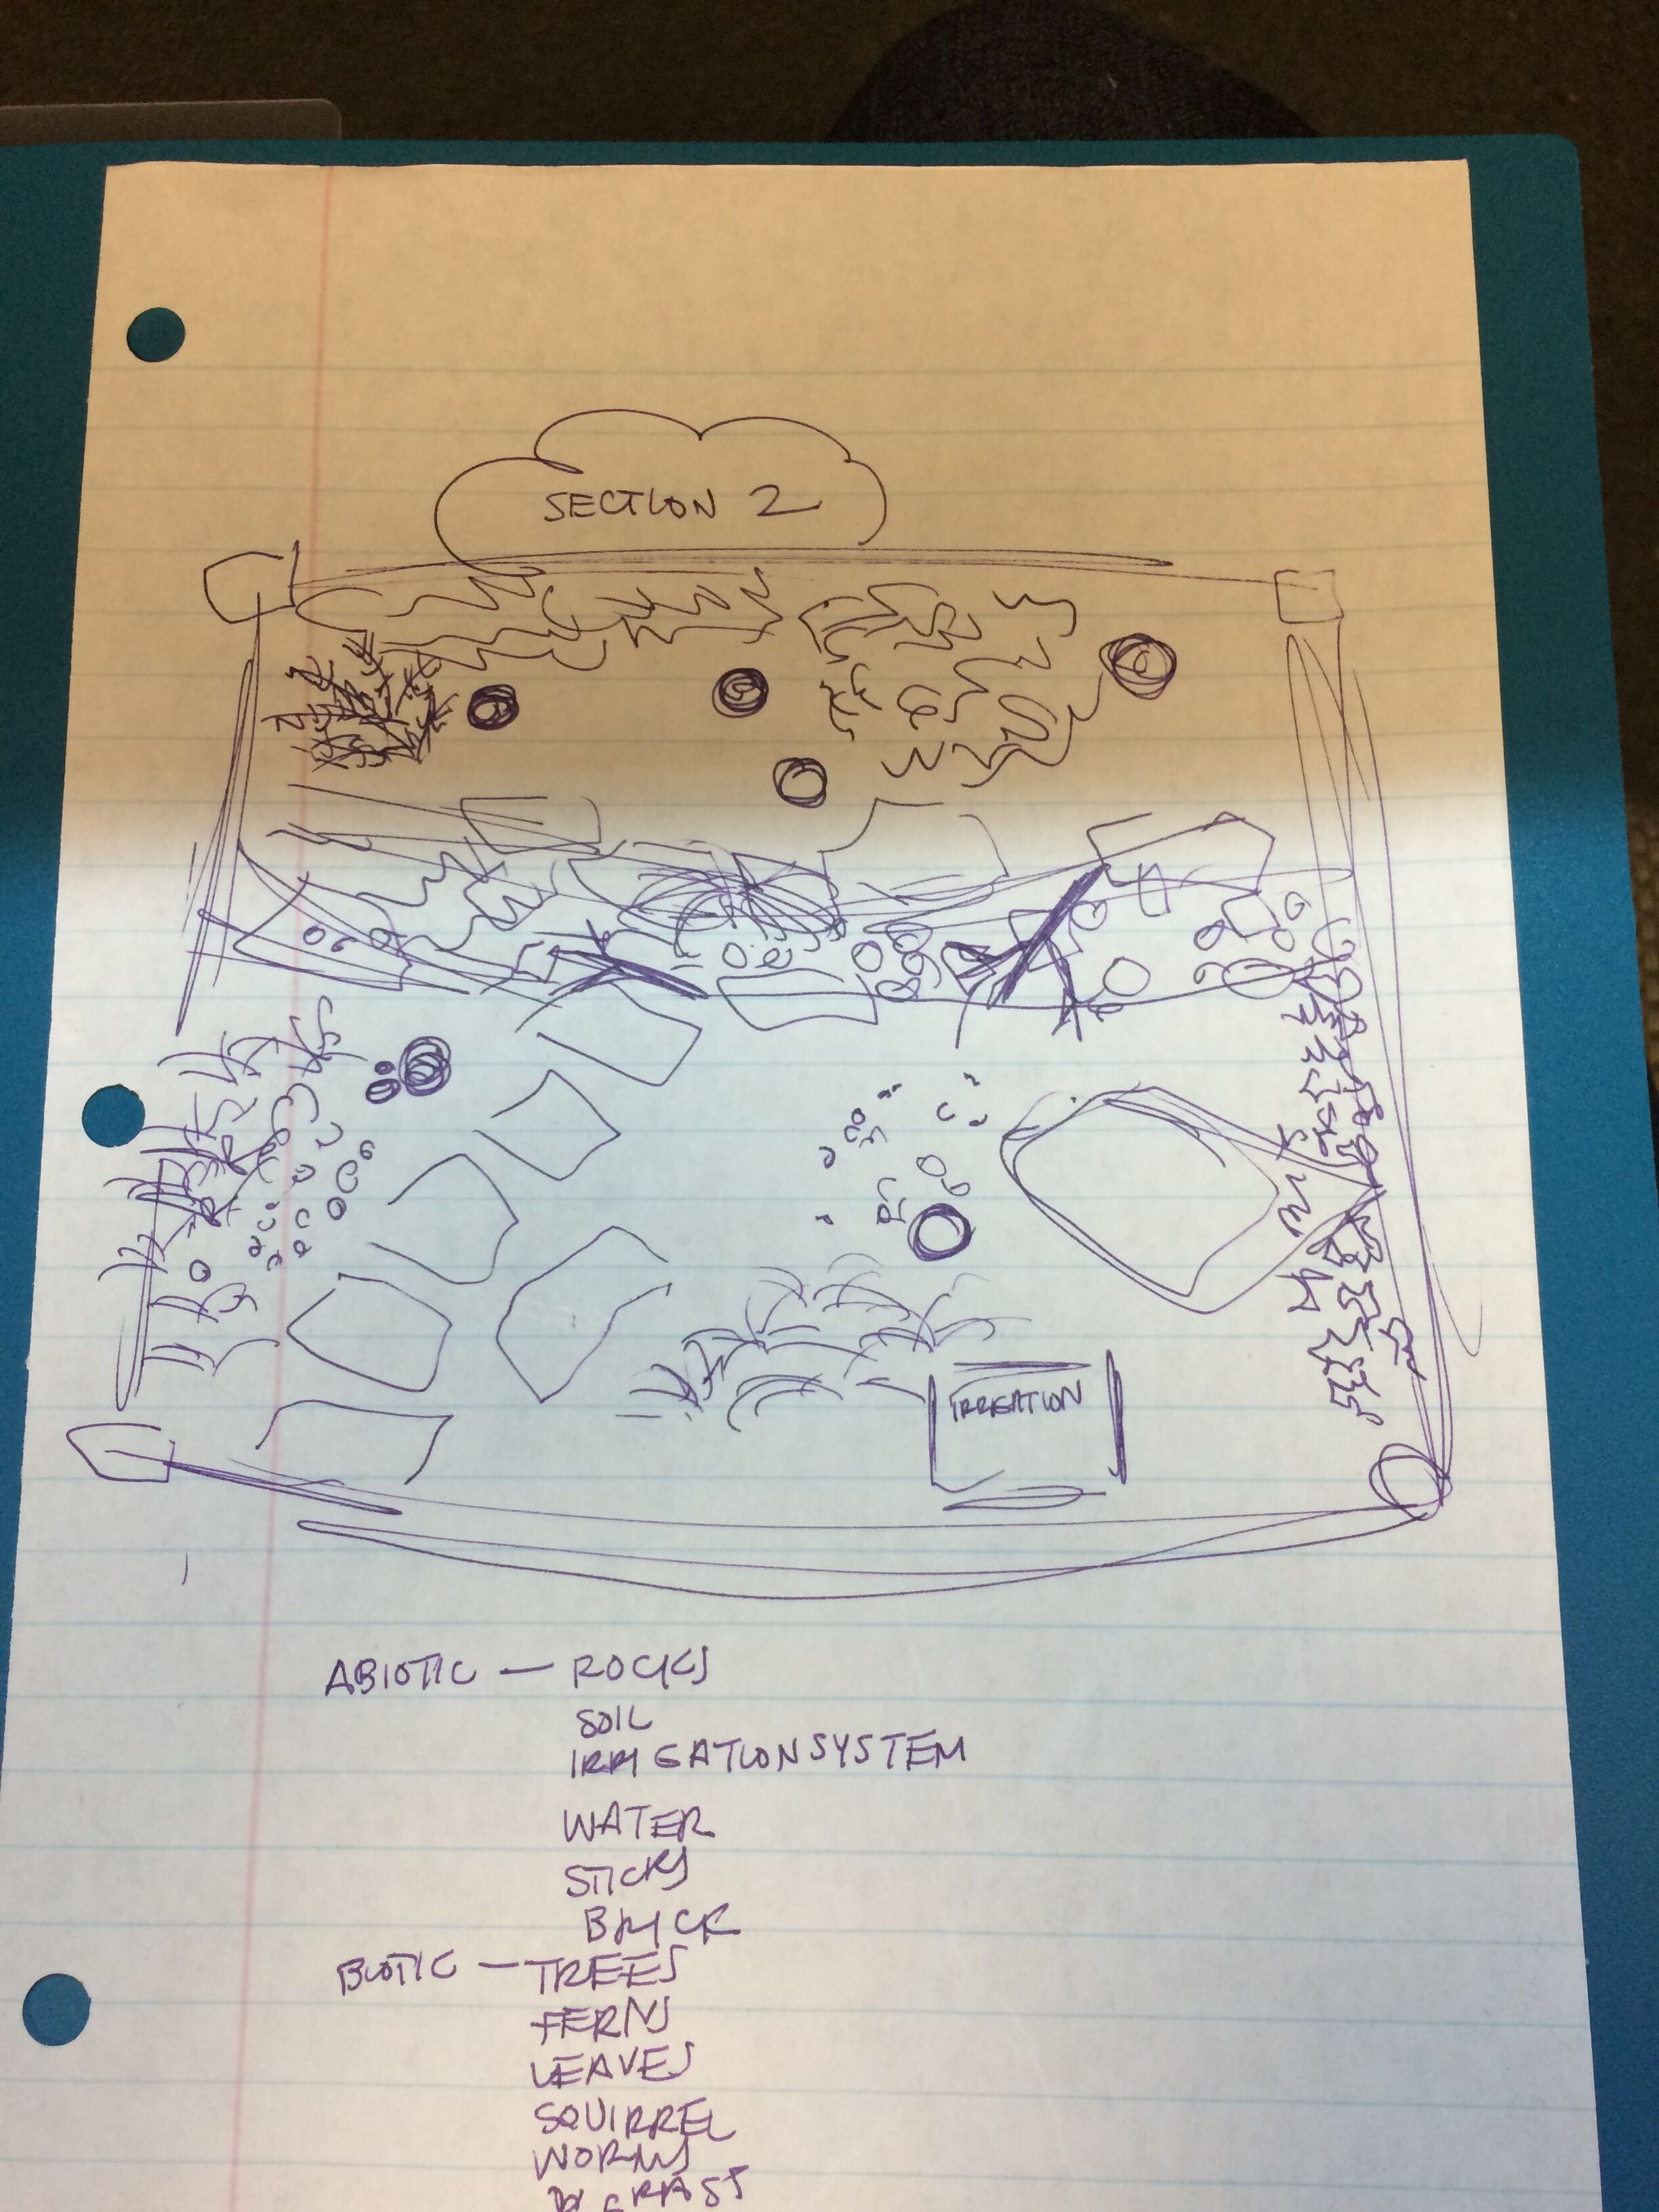
Biotic Components: -trees -animals -plants (ex. ferns, grasses)
Abiotic Components: -rocks -water -soil
Transect #3 Description: The transect was in a more secluded area of the campus. It's major feature was a creek that ran straight through it. Within the creek, there were various-sized rocks and a rocky soil that covered the bottom. What looked to be a form of ivy and some fern plants lined the edges of the creek, with soil and trees covering the rest of the area. It was very cold out at the time of the observations, so the soil was semi-frozen and there were dead leaves and tree debris - including leaves, sticks, and bark - covering the transect floor. Also due to the temperature, there were a scarce amount of animals, but it seemed to be a perfect area for insects and animals, like squirrels, to populate the area. One other less natural characteristic to note was an irrigation system that ran through the transect as well.
K.H.
