User:Jamie Nunziata/Notebook/Biology 210 at AU
Effects of Nicotine on the Embryonic Development of Zebrafish
03/04/2015 J.N.
Introduction:
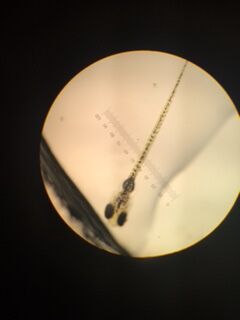
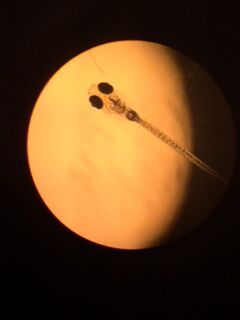
The purpose of this experiment was to use zebrafish as a model organism to study the effects of nicotine exposure to embryonic development. Zebrafish are good model organisms because they lay their eggs, making it easy to observe the effects of fish when their eggs are exposed to different treatments, and the fish can be observed even before it is hatched. Nicotine has been known to cause some defects such as a decreased eye diameter, a change in body morphology, and an overall decrease in survival ability (Parker & Connaughton, 2007). The hypothesis of this experiment was to observe these noticeable differences in our zebrafish growing in our nicotine treated water, such as change in eye shape, a change in behavior, and a decrease in ability to life in those conditions.
Materials and Methods:
This lab began by adding 20 zebrafish each to two separate plates (Note: all transferring of zebrafish and zebrafish eggs were done by using a plastic transfer pipette with the tip cut off, and separate pipettes were used to not mix and treatments). The designated control plate was filled with 20mL of distilled water with methylene blue and labeled "Control". The other plate was labeled "Treatment" and was the designated nicotine treated plate, and was filled with 20mL of 25mg/mL nicotine solution. These plates were then covered and put in the class bin overnight.
Every Monday, Wednesday, and Friday, measurements were made of the zebrafish were to be measured and observed under a dissecting microscope, and under a microscope with a depression slide. The water was also changed during these 3 days by removing 10 mL of dirty water, including egg casings and dead fish, and 15 mLs of the appropriate water back into the petri dishes. Once the measurements were made, the dished were once again taped up and placed back into the classroom bin.
When all of the fish died the first day, 20 new fish were added for testing. However, when the fish died the second time, only 10 more fish were added to the experiment for testing.
Data:

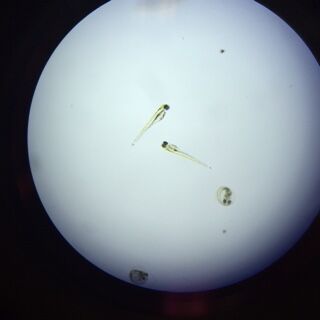
Zebrafish with Nicotine Exposure

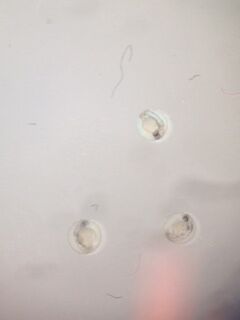
Zebrafish without Nicotine Exposure
Conclusion:
The results to our experiment were pretty inconclusive. There was a major problem in keeping our zebrafish alive, due to losing the water in the bucket if other groups were to tip over the petri dished, unexpected mold growth, or just a too harsh treatment of nicotine to the fish. Since a lot of the time no dead fish bodies were even recovered in the petri dishes when going from week to week, that implies that a main reason for our recurring zebrafish deaths are largely linked to the mistreatment of the dish in the class bucket, by either dropping or tipping the dish when digging for each group's desired plates. Since we could not keep these fish alive, we kept having to start over with fish that were growing in normal water, meaning our results are not completely reflective of zebrafish development in a nicotine treatment because only a short period of time was actually spent in the treatment. For future experiments, a recommendation to improve this part of the experiment would be to set up multiple plates for treatment and control (for instance, 2 plates of 10 fish each instead of 1 with 20). This is help because is one plate is tampered with in a way which would negatively effect our experiments, or if mold grew, then the experimenter would essentially have backup plates that already have zebrafish growing in the desired treatment.
References:
Bentley, M., Laslo, M., Walters-Conte, K., & Zeller, N. (2015). In A Laboratory Manual to Accompany General Biology 2. Department of Biology, American University.
Parker, B., & Connaughton, V. (2007). Zebrafish, 59-68.
16S PCR product
Only one sequence was achieved for our PCR, because the other sample was poor quality. For MB29, the normal phase sequence told us that our bacterium was Chryseobacterium, a rod shaped and gram negative bacterium.
Invertebrates and Vertebrates
02/18/2015 J.N.
Introduction:
This lab was performed to identify any invertebrates caught by our Berlese funnels and observe any vertebrates that may be living in our transect. This lab was the final element needed to gain a clear picture of all of the diversity in life on our transect. Mammalian species can be classified into two different groups, vertebrates (containing a spinal cord) and invertebrates (lacking a spinal cord). Throughout this process, we have identified different classes of organisms that correspond to different trophic levels in our ecosystem. A trophic level is the level on the food chain that an organism is assigned to based on what it preys on and what preys on it. The different trophic levels, going from the bottom to the top of the food chain, are producers, primary consumers, secondary consumers, and at the top are the tertiary consumers (Freeman 2014). These trophic levels are different in every ecosystem because of the ecosystem's carrying capacity, which limits the amount of species that a particular ecosystem is capable of sustaining (Freeman 2014). The purpose of this lab was to identify the different relationships between organisms in the community that lives in the Tall Bushes transect.
Materials and Methods:
This lab began by first collecting our Berlese Funnels from last week. Once the appropriate funnel is found, the funnel and the conical tube attached to the end with the ethanol solution were detached from each other. The funnel was washed and returned to the appropriate area. A small Petri dish was obtained and in the top of the Petri dish was designated for the top layer of solution in the tube, taken out with a transfer pipette to isolate the top and bottom layers. The bottom layer was then poured into the bottom of the Petri dish. Four wet mount slides were made (without cover slips), two with organisms from the top layer and two with organisms from the bottom layer. These slides were examined under a microscope and five organisms were identified by using a dichotomous key provided online (http://hope.edu/academic/biology/leaflitterarthropods/). These observations were recorded in Table 1.
Data:
Table 1: Invertebrates Collected in the Berlese Funnel

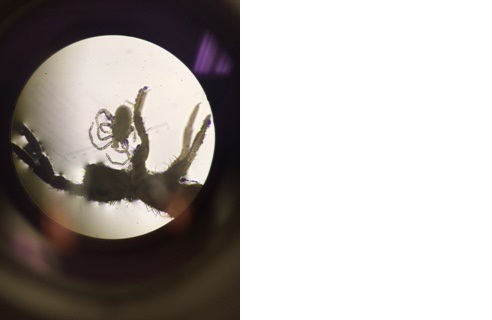
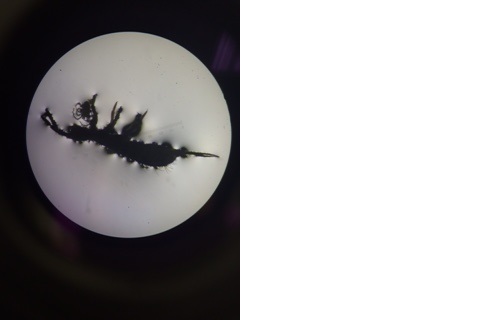
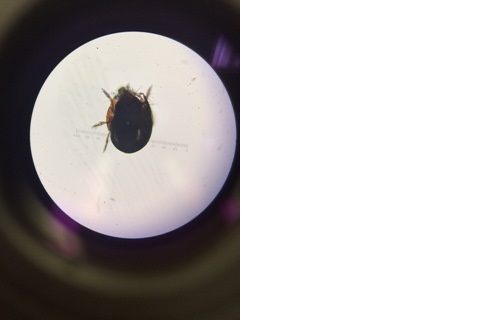
As you can infer from Table 1, the most common type of invertebrate found in our leaf litter was the soil mite. The size range for the invertebrates found our leaf litter is from 0.4 millimeters to 2.0 millimeters, with the mite being the smallest organism and the beetle being the largest.
Mite (Arthropoda arachnida)
Spring-tail (Arthropoda insecta)
Soil Mite (Arthropoda arachnida)
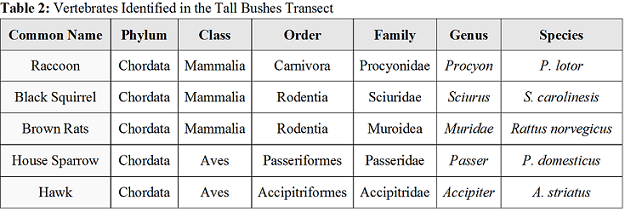
Table 3: Worms

Figure 1: Food Web of the Tall Bushes Transect
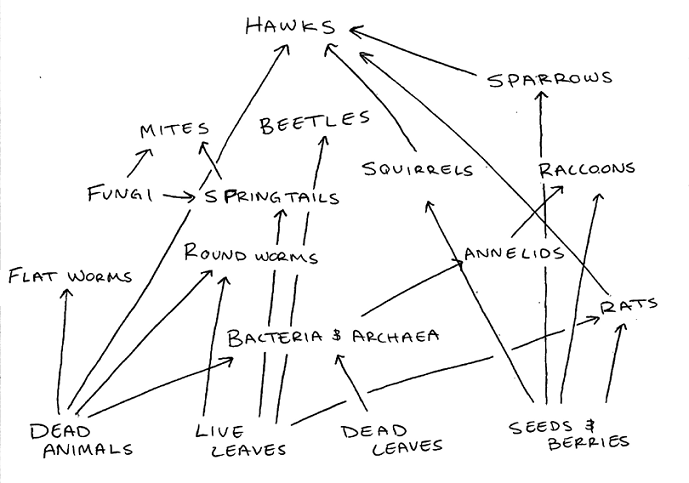
This food web shows the relationship between all organisms identified in the Tall Bushes transect, including vertebrates and invertebrates from this lab and plants, bacteria, and fungi identified in previous labs.
Conclusion:
The variety of species identified to be living in our transect depend on certain biotic and abiotic factors. Squirrels depend on the bushes and trees that live in the transect for shelter and rely on their nuts and berries for food. Squirrels also need dirt around to burry their nuts for the winter months. Rats and sparrows also depend on the trees and ground shrubs for shelter and, like squirrels, with feed off of and berries and nuts produced by the plant life. The bacteria will feed off any dead leaves and animals that may exist in our transect, and our invertebrate insects identified will feed off of the bacteria. Hawks are tertiary consumers and are at the highest trophic level, since it will feed off of the secondary consumers like sparrows, squirrels, and any other dead animals. The diversity and relationship between these organisms is known as a community, and is what makes an ecosystem thrive.
References:
Bentley, M., Laslo, M., Walters-Conte, K., & Zeller, N. (2015). In A Laboratory Manual to Accompany General Biology 2 (pp. 44-49). Department of Biology, American University.
Freeman, S. (2014). Biology and the Tree of Life. In Biological science (Fourth ed., pp. 1150-1151).
Plantae and Fungi
02/11/2015 J.N.
Introduction:
This lab was performed to gain a better understanding and appreciation for the diversity of plants and fungi. Land plants evolved from eukaryotic green algae from modern day Bryophytes (Bentley et al. 34) These bryophytes adapted to land by creating physiological mechanisms for the accommodation of land temperature fluctuations, sexual reproduction, and their access to water and nutrients (Bentley et al. 34). Classification of these plants depends on presence of (or lack there of) three general structures: vascularization, specialized structures, and mechanisms of reproduction. Fungi was the second point of interest in this lab. Fungi is a niche necessary to any ecosystem because it is a decomposer, and by that definition it releases CO2 into the atmosphere and nitrogenous materials into the soil (Bentley et al. 42). Just as plants have their major divisions, fungi can be categorized into three groups of its own: zygomycetes, basidiomycetes, and ascomycetes. The purpose of this lab was to develop classification techniques for different species of fungi and plants and to set up an apparatus for invertebrate analysis.
Materials and Methods:
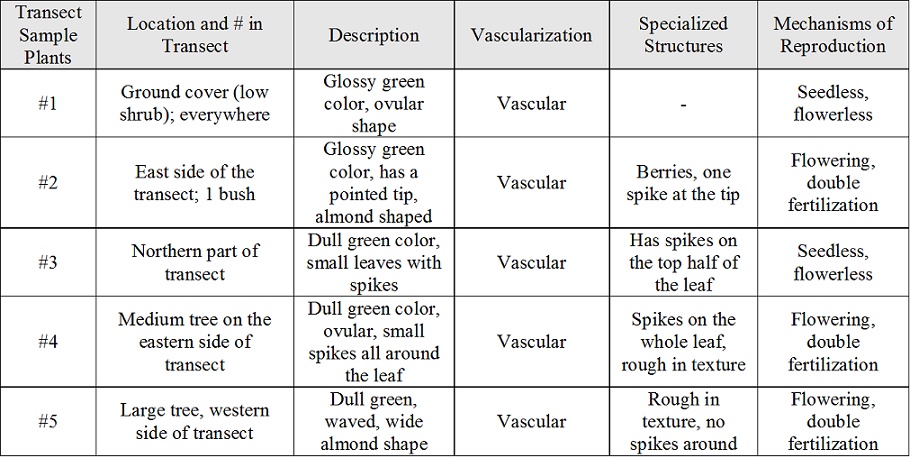
The first part of this lab was to collect leaf litter samples (just plant matter, no dirt) and leaf samples from the transect. The leaf samples were than observed as they were regularly and the observations in regard to its vascularization, color, location in transect, mechanisms of reproduction, and other descriptors were recorded in Table 1. Pictures of the transect and leaves were also taken for further documentation. Cross sections were than taken from the leaves to observe them under a microscope by cutting a small portion of the leaf off and preparing a wet mount slide with the sample. Three types of fungi was observed at different stations. These samples were already out for observation under the dissection microscope by the TA, and photos and observations about the fungi was recorded.
A Berlese Funnel was then constructed to collect invertebrates for the next lab. To construct a Berlese Funnel, 25 mL of a 50:50 ethanol and water solution was added to a conical tube. A piece of screening material was then cut and fitted to the bottom of the funnel to stop the leaf litter from falling through to the ethanol solution. The leaf litter was then added to the funnel and the funnel was fixed onto the tube of ethanol by adding parafilm. The funnel was then labeled with the transect number and attached to a ring stand with other group's funnels. A light was then placed above the ring stands with all of the Berlese funnels then the entire apparatus was then covered with tin foil. These were left for one week to collect invertebrate samples.
Data:
PCR of our bacteria cultures
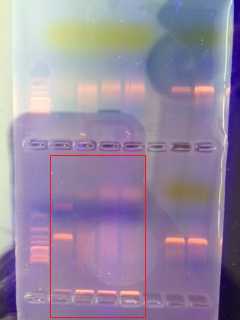
OUr bacteria cultures from the previous lab that were tested with PCR via gel electrophoresis can be seen in this gel. Our samples for the Tall Bushes Transect are outlined by the red square. The first and third samples were sent away for identification since they showed the brightest bands.
Fungi 1: Mushroom
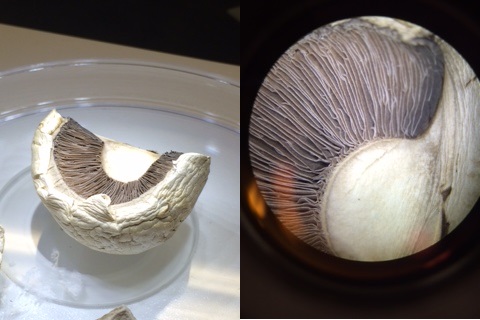
This mushroom falls into the basidiomycota category, which is composed of terrestrial fungi (Bentley et al. 42).
Bryophyte 1: Moss (polytrichum)
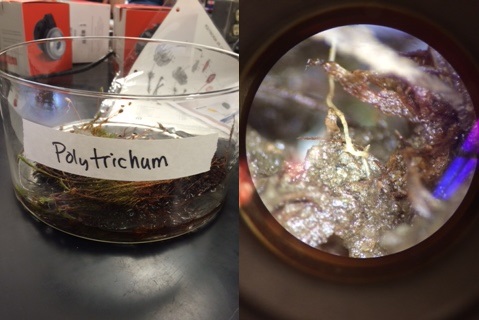
This moss belongs to the bryophyte division of plants, which includes terrestrial organisms that evolved from green algae (Bentley et al. 34).
Fungi 2: Bread Mold (rhizopus stolonifer zygospore)
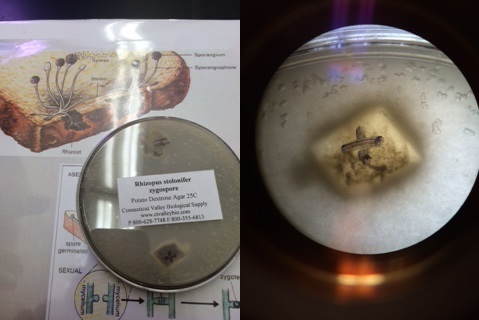
This bread mold belongs to the ascomycota category, which is the largest division of fungi that also includes yeast, mildew, and truffles (Bentley et al. 42).
Tall Bushes Transect
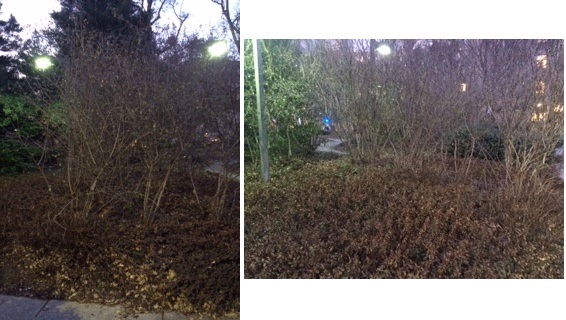
Leaves collected from the Tall Bushes transect.

Table 1: Leaf Characteristics
Microscopic Image of Leaf 5
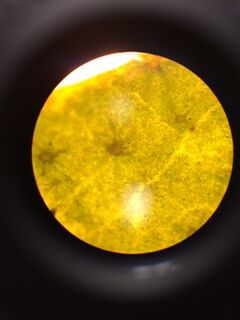
Small spikes can be seen coming off the surface of leaf 5. These spikes give the leaf it's rough surface texture.
Conclusion:
Of the plant's observed, it was difficult to identify the plant's method of reproduction based on just our small leaf sample taken. A few of the leaves had small little flower-esque parts on the top, but from the bitter cold most of the leaves were dried up and dead. If I had to repeat this procedure again, I would probably collect my plant samples and leaf little during the fall, since most of what was left at our transect was dead plants matter and very few organisms in the dirt. However, our fungi classification was successful in ordering the fungi species into their specific categories.
References:
Bentley, M., Laslo, M., Walters-Conte, K., & Zeller, N. (2015). In A Laboratory Manual to Accompany General Biology 2 (pp. 33-43). Department of Biology, American University.
Identifying and Observing Bacteria Species
02/04/2015 J.N.
Introduction:
This lab was preformed to quantify, observe, and gain an overall understanding of bacterial growth and antibiotic resistance. Bacteria growth for the purposes of analyzing their species in a laboratory setting is preformed on agar plates. Agar is a substance that contains nutrients that enables bacteria to grow and thrive. However, when exposed to antibiotics, such a tetracycline, the bacteria dies out due to the antibiotic. When a bacteria species is exposed to antibiotics but continues to grow and thrive, this bacteria species is said to be antibiotic resistant, and can then reproduce and form colonies of this antibiotic resistant properties.
In this lab, the prokaryotes in the domain bacteria was studied. The domain Archaea also contains prokaryotic species, however, they could not have been able to be grown on agar plates since Archaea species only grow in extreme conditions, and our agar plates were an ideal condition for growth (Bentley et al. 26).
The domain bacteria has been classified into three basic shapes for identification: bacillus (rod-shaped), coccus (spherical), and spirillum (twisted spiral)(Bentley et al. 26). Bacteria can also be identified based on staining characteristics with procedures such as the Gram stain (Bentley et al. 27). Gram staining allows you to see if bacteria cells contain peptidoglycan in their cell walls. If a bacteria cell after the Gram staining has a crystal violet cell wall, they are said to be "gram-positive" and contain peptidoglycan. Bacteria cells that have a red color for their cells have lower amounts of peptidoglycan and are said to be "gram-negative" (Bentley et al. 27).
Materials and Methods:
This lab was performed by first observing our Hay Infusion for the final time. After those observations have been recorded, our plates from our serial dilution from the prior lab were collected. A gram staining was also performed on certain plates. The plates selected for this gram staining were the Nutrient plates 10^-3 and 10^-7, and Nutrient+tet plates 10^-5 and 10^-3. To perform the gram staining, an inoculated loop was first sterilized over a flame and a tiny amount of the bacteria from each agar plate was collected and mixed with water on a clean slide. The slides were then heat fixed by passing it through a flame, bacteria side up, until the water/bacteria mixture has dried. The slides were then placed on a rack above a staining tray and the bacterial smears were then covered with a drop of crystal violet solution. After 30 seconds, the crystal violet was washed off using a transfer pipette and water. The smears were then covered with Gram's iodine, then after 30 seconds was once again washed off with water. The smears were then decolorized by flushing them with a 95% alcohol solution for 20-30 seconds. Safranin stain was then put on the smears, and after 30 seconds was washed off with water. The excess water was blotted off with a kimwipe and the slides were put under a microscope for observation.
Data:
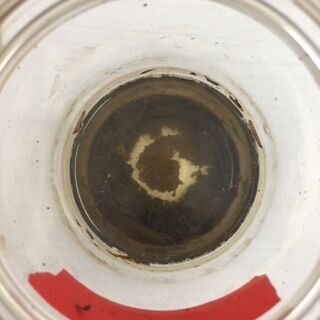
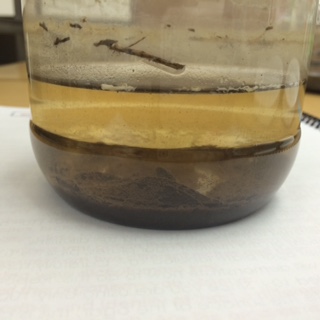
When the observing the Hay Infusion culture for the final time, it seemed to have less vegetation on the top and bottom layers, looked more like dirt resting on the bottom of the jar, and smelled less pungent. A hypothesis that could pose as an explanation for this is that the microorganisms that were protists, which can not produce their own food, ate some of the vegetation and mold that was on the top and bottom layers, both of which were causing the odor. Without this mold and vegetation left fermenting in the water, the smell got a little more tolerable. Photos of the Hay Infusion in this stage can be seen below:
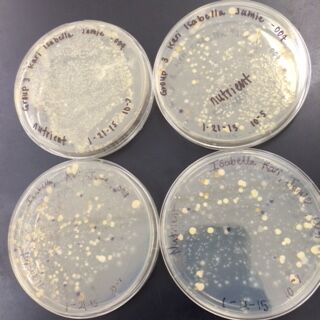
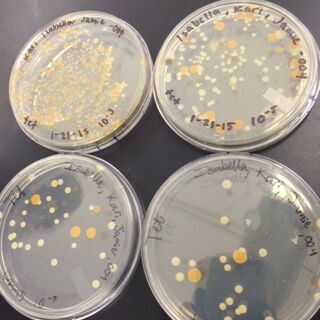
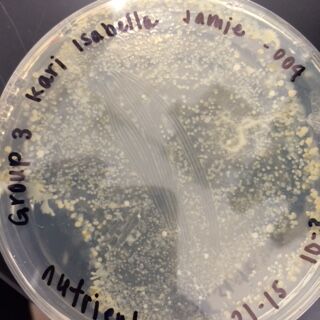
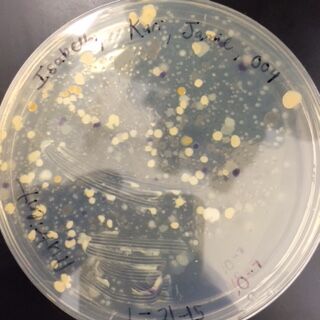
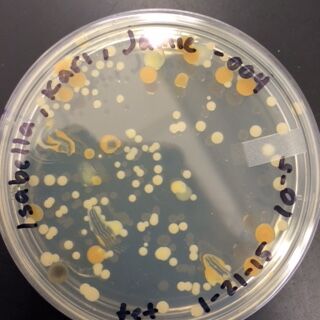
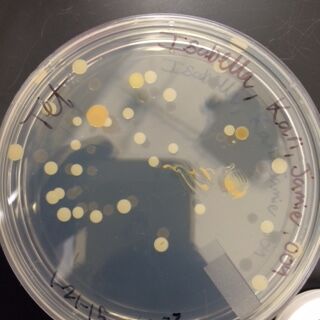
The next observations were done of the agar plates. Below are pictures of both the Nutrient and the Nutrient+Tetracycline Plates, respectively.
When comparing the two categories of plates, you can conclude that a majority of bacteria was killed off by our tetracycline antibiotic since those places have far less colonies than in the regular nutrient plates. However, there were 2 or 3 different colony types that were still able to grow on the nutrient+tetracycline plates and were unaffected by the antibiotic. These colonies appeared in circles that were larger than those on the nutrient plates. Counts of the bacteria on each plate along with the serial dilution results can be found in the table below: 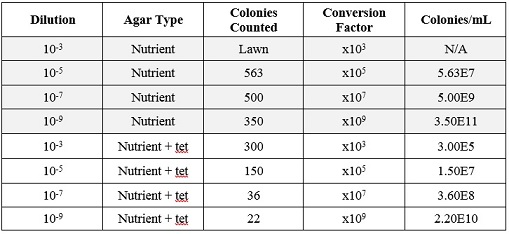
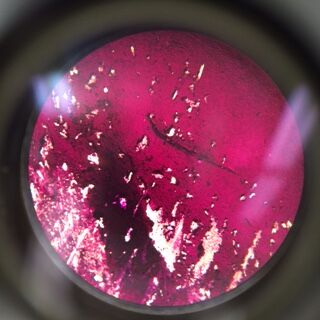
Gram Staining gave the following results: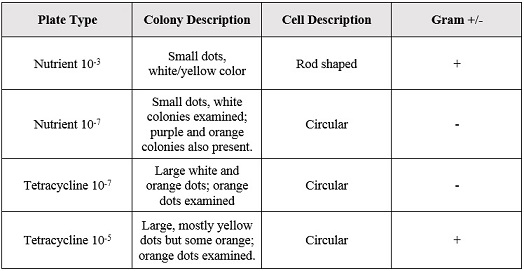
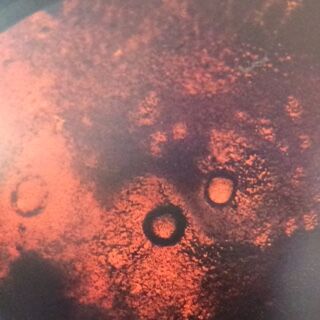
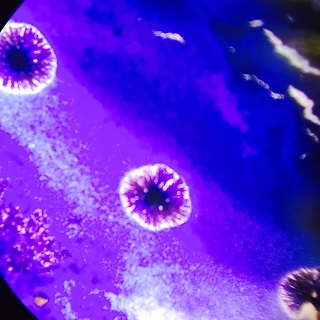
When Observed under a microscope, the following was found for each of the gram staining slides.
Nutrient 10^-3 under 10x objective
Nutrient 10^-7 under 10x objective
Nutrient+Tetracycline 10^-5 under 10x objective
Nutrient+Tetracycline 10^-7 under 10x objective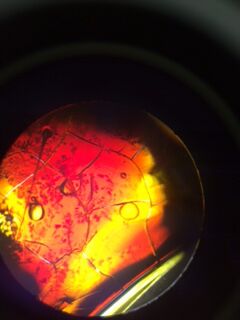
Conclusion:
Of the samples observed above, our data was difficult to tell if the gram staining truly worked or if what we were seeing on the slide was simple unwashed dye. The cells in our gram staining slides were also extremely difficult to find, leading me to the conclusion that most is not all of the bacteria cells were burned off with attempting to fix in place the bacteria smears. Overall, it was apparent that the antibiotic tetracycline was effective due to the significant decrease in cell colonies from the nutrient to the nutrient+tetracycline plates, with only few colonies being antibiotic resistant. The purple colonies that were present on the just nutrient plates were the only colonies to be completely killed off by the tetracycline, which showing that the genetic capabilities of that particular bacteria species did not include any type of variation that could overcome the antibiotic.
References:
Bentley, M., Laslo, M., Walters-Conte, K., & Zeller, N. (2015). In A Laboratory Manual to Accompany General Biology 2 (pp. 25-32). Department of Biology, American University.
Observing and Identifying Protists in a Hay Infusion Culture
01/28/2015 J.N.
Introduction:
This lab was performed to observe and identify various protists that may be living in our transects. Protists are unicellular eukaryotes that do not perform photosynthesis but instead absorb their own nutrients(Bentley et a., 19). The second group of unicellular eukaryote is algae, which, unlike protists, algae is photosynthetic (Bentley et al. 19). These organisms can also have many different unique characteristics passed on by their particular lineage. These unique characteristics are crucial observations when it comes to identification. One method of organism identification is by using what is called a Dichotomous Key. Dichotomous Keys offer choices on the physical characteristics that may be present in your organisms, such as the organism's shape or color. Those choices may lead you to other choices about your observations, and by the end of it you would have narrowed it down to the species you are observing (Bentley et al. 21). This lab used a Dichotomous Key in order to identify the unicellular eukaryotes we saw in the wet mount slides made from our Hay Infusion culture. To observe any bacteria that may have been present in our culture, agar plates were prepared for observation in our next lab. The purpose of this experiment was to develop techniques for identifying organisms by using a Dichotomous Key and to observe the different protists that may be present in our transect.
Materials and Methods:
To prepare the Hay Infusion culture, our dirt sample collected from our transect was first put into a large jar. 500 mLs of distilled water and 0.1 gram of dried milk was added to the jar with our sample. The mixture was shaken for about 10 seconds and placed into the back of the class, top off, for observation after 1 week of leaving the jar undisturbed. After that week passed, the jar was then collected again and observations were made of the undisturbed environment. Then, the Hay Infusion culture was shaken until it became a homogenous mixture again. Samples were drawn from the culture using a transfer pipette from the top and bottom of the culture and placed on wet mount slides for observation.
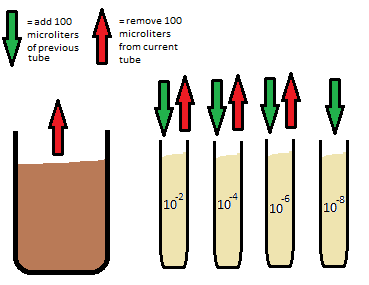
In preparation for next lab, we prepared a serial dilution for bacteria plating. To due this, 4 tubes of broth were obtained and labeled 10^-2, 10^-4, 10^-6, or 10^-8. Using a micropippetor, 100 microliters of the hay infusion culture was transferred to the tube labeled 10^-2. The tube was shaken to mix the broth, and 100 microliters was then transferred from the 10^-2 broth to the broth labeled 10^-4 and shaken. 100 microliters was then taken from that broth and transferred to 10^-6, shaken, and then 100 microliters of broth was taken from the 10^-6 tube to the 10^-8. This final tube, 10^-8, is a 1:100000000 dilution. This process is illustrated below:
Agar plates were then made using these tubes of the different dilutions. To prepare these plates, 4 plates of nutrient agar and four plates with the tetracycline added nutrient agar were obtain and labeled, one of each type, 10^-3, 10^-5, 10^-7, and 10^-9. A sample of the broths were spread on the plate by using a glass rod as our inoculating loop. The rod was dipped into ethanol and lit on fire by briefly holding it over a Bunsen burner to sterilize. After the glass cooled, the rod was then dipped into the 10^-2 broth and spread onto the agar plate label 10^-3 for both tetracycline and non-tetracycline. This process was repeated with the rest of the broth, plating the 10^-4 broth onto the 10^-5 plates, the 10^-6 broth onto the 10^-7 plates, and the 10^-8 both onto the 10^-9 plates, making sure to re-sterilize the rod between each plating.
Data:
When first brought back to the station, the Hay Infusion culture had a large amount of dusty sediment on the bottom layer and a large amount of moldy and muddy looking sediment on the top layer. The only apparent sign of life when first looking at the culture was the mold spores growing on the top layer of the jar. There was also a few dead bugs floating at the top and a few dead leaves as well. The culture also smelled of rotten, moldy, and stagnant water. Pictures of the culture can be seen below: 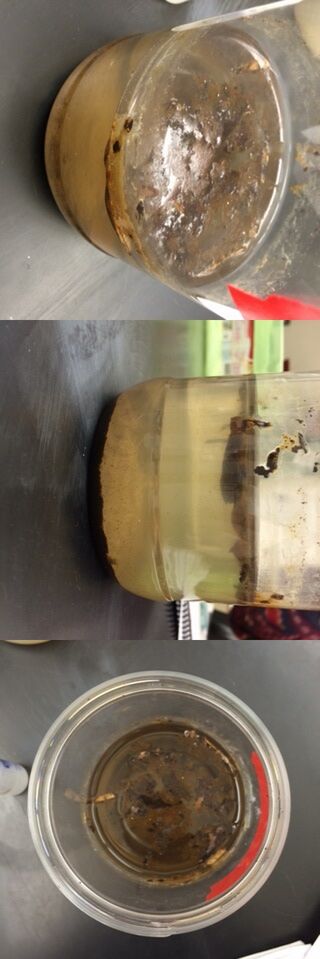
When observing our wet mount slides, we were able to identify the following organisms from the top and bottom layers of the culture:
Top Niche
Bottom Niche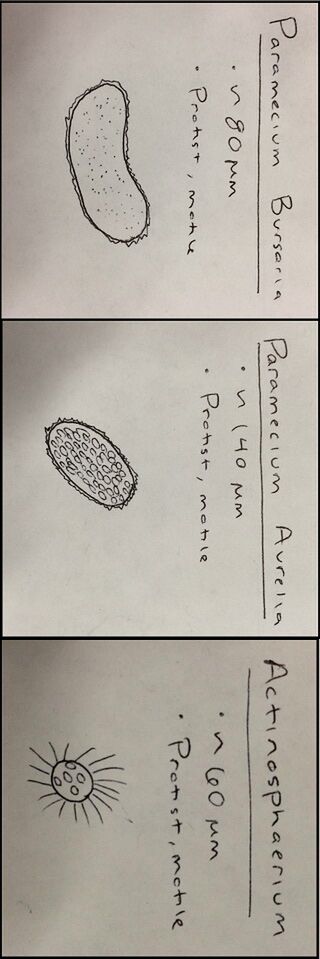
Conclusion:
Although there is some overlap, for the most part the organisms living at the bottom of our Hay Infusion culture, as identified with a wet mount slide and a Dichotomous Key, differ from those living on the top layer of our culture. One likely explanation for this could also explain why mud and mold was left floating at the top, and sediment from the dirt and plants lied on the bottom. Our algae species, Pandorina, was found at the top as well. This is because in order for photosynthetic organisms to thrive, such as algae, it needs a light source in order to perform photosynthesis. However, organisms which need to consume their own food, such as the protists identified, would thrive on the bottom of the Hay Infusion where they are able to feed off of any nutrients from the sunken dirt or plant matter. These organisms found in our Hay Infusion would in fact meet all the needs of life according to Freeman. Pandorina, for example, takes in energy though the process of photosynthesis, is capable of replication and transferring the genes of the organism down to other organisms, is comprised of cells, and is capable of evolution.If this Hay Infusion culture were to sit for another two months, one would imagine that most of the organisms left in the culture would be algae species, because eventually the protists will run out of nutrients to consume but the algae can make it's own nutrients with sunlight and CO2 form the open air. However, if the jar was left capped and in the dark, then neither the algae nor the protists would survive an extended period of time.
References:
Bentley, M., Laslo, M., Walters-Conte, K., & Zeller, N. (2015). In A Laboratory Manual to Accompany General Biology 2 (pp. 18-24). Department of Biology, American University.
Freeman, S. (2010). Biology and the Tree of Life. In Biological science (Fourth ed., pp. 2-4).
Observing a Niche at AU
01/26/2015 J.N.
Introduction:
This lab was performed to serve an introduction to ecology, the branch of biology that studies the different relationships between organisms, species, and the environment (Bentley et al., 2015). In this lab, a transect, or a small section of an ecosystem, was observed to identify any biotic and abiotic factors. Biotic factors are living things, such as moss, and abiotic factors are nonliving things, such as a stop sign. Samples of dirt the various transects were also taken to perform a Hay Infusion Culture that will be observed in the following lab. The purpose of this experiment was to gain a better understanding of the abiotic and biotic factors of different ecosystem by observing specific and unique transects across American University's campus.
Materials and Methods:
The class was first split into groups and assigned different 20 by 20 meter areas of campus to use as their transect. Once each group got their assignment, they went to their assigned area and received a tube from the instructor to take dirt samples from their transect to perform a Hay Infusion Culture in their next lab. The groups then comprised a list of abiotic and biotic factors in their transect along with recording the transect's overall location and topography. Each group member then, independently, sketched their transect to include an overall biological setup of biotic and abiotic factors, along with a having labelled north, south, east and west.
Data:
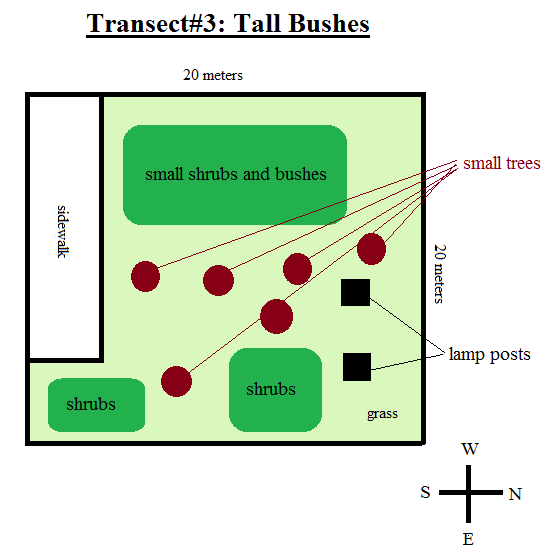
The transect that was used for this analysis was the Tall Bushes Transect and was located in the middle of an arboretum in between the amphitheater and bender arena. This transect included lamp posts, dirt, and sidewalk cement as its abiotic factors. As far as the biotic factors, this transect contained many different types of ground shrubs and bushes, some small trees, grass, small bugs and microorganisms in the dirt, and some fallen leaves. The overall topography of the transect was that it was flat and higher up in altitude than it's surroundings, and the transect was fairly dry when digging past the top layer of snow. A sketch of the transect can be seen below:
Conclusion:
This lab was aimed toward making observations about a specific ecosystem by analyzing a small sample, or transect, of that ecosystem. The results of this experiment were that most of the biotic factors in our transect were small trees and bushes on the ground, which is an outcome of the fact that our transect was in a dry and high up location. This location was also in an area where their is no immediate water source, also contributing to the observation that the only plants able to sustain life in our transect were ones which could survive in dry areas.
References:
Bentley, M., Laslo, M., Walters-Conte, K., & Zeller, N. (2015). In A Laboratory Manual to Accompany General Biology 2 (pp. 16-17). Department of Biology, American University.
