User:Chun19/Notebook/HRV project 22/23/Entry Base:ECG
What is an ECG?
An electrocardiogram (ECG) is a simple test that can be used to check the electrical activity of your heart. An ECG is useful in identifying pathologies in many systems not just the cardiovascular system.
There are 2 main types of ECGs that are used a 12 lead and a 3 lead. In clinical practice, in case of emergencies a 3 lead is used, inpatient and outpatient uses 12 lead. Moreover, 3 lead ECGs are used most often for recording a 24-hour reading.
ECG lead placement
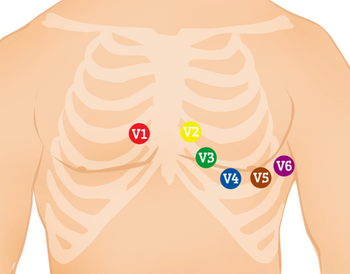
In a 3 lead, 3 leads are used as suggested by the name. The three active peripheral leads are AVr, AVL, and AVf. Whereas in a 12 lead, 12 leads are utilised which comsists of limb and chest leads.
1. V1: 4th intercostal space (ICS), RIGHT margin of the sternum.
2. V2: 4th ICS along the LEFT margin of the sternum.
3. V4: 5th ICS, mid-clavicular line.
4. V3: midway between V2 and V4.
5. V5: 5th ICS, anterior axillary line (same level as V4)
6. V6: 5th ICS, mid-axillary line (same level as V4)
7. RL: Anywhere above the ankle and below the torso
8. RA: Anywhere between the shoulder and the elbow
9. LL: Anywhere above the ankle and below the torso
10. LA: Anywhere between the shoulder and the elbow
Figure 1
What can an ECG show?
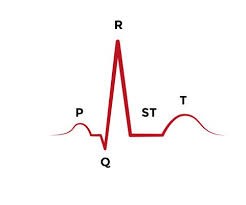
A single heart beat consists of the waves PQRST (figure 2). Each segment identifies a particular rhythm of the heart beat.
For example, P wave represents atrial depolarisation, the QRS complex represents ventricular depolarisation and atrial repolarisation, T wave represents ventricular repolarisation. There are many segments within an ECG such as PR interval. Depending on the morphology U waves may be present.
Figure 2
How is an ECG recording relevant to HRV?
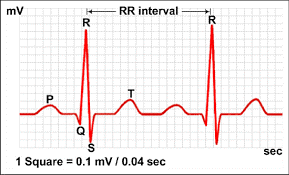
In our project we are observing the Heart rate Variability, Heart rate is the simply the number of heart beats per minute which can be identified on an ECG using the R-R interval which is the time interval between 2 consecutive R waves as shown below in figure 3.
Heart rate is normally calculated by dividing 300 by the number of large squares between 2 consecutive R waves. E.g if there are 2 large squares between 2 consecutive R waves the heart rate is 150 bpm. It is to be noted that figure 3 shows small squares, thus 5 small squares will equate to 1 large square.
Figure 3
How do wearable devices detect heart rate?
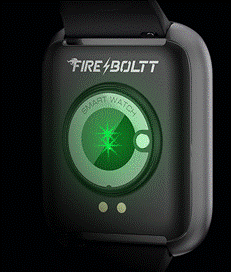
Modern wearable devices utilise photoplethysmography, which measures heart rate using a green light (shown in figure 4) . Spectroscopy informs us that the green light is absorbed by the blood as red and green are opposite each other on the colour wheel.
When blood vessels contract and expand this device measures the change in concentration of red blood cells. Expanded blood vessels absorb more green light thus less green light is reflected and contracted blood vessels absorb less green light. The optical sensor on the rear of the smart watches detects and measures the reflected light. A software algorithm then converts the changes in light intensity into your pulse rate.
However, variations in heart rate can be caused by different skin pigmentation thus the reliability and accuracy of this algorithm is still under investigation.
Photoplethysmography is a simple and low cost optical technique utilised to detect heart rate thus it is widely used.
The photoplethysmography waveform comprises a physiological pulsatile ('AC') waveform which occurs due to the cardiac synchronous changes in the blood volume with each heart beat, and is superimposed on a slowly varying ('DC') baseline with various lower frequency components attributed to respiration, sympathetic nervous system activity and thermoregulation.
The photoplethysmography technology has been widely used in a range of commercial medical devices which measure oxygen saturation, blood pressure and cardiac output, assessing autonomic function and also detecting peripheral vascular disease. Since HRV measures the balance of the autonomic system, photoplethysmography may aid in this evaluation.
However, it has been stated that the gold standard of investigating heart rate is ECG.
Figure 4
References
[1]https://edu.rsc.org/feature/the-science-of-smartwatches/4013008.article
[2]https://iopscience.iop.org/article/10.1088/0967-3334/28/3/R01


