User:Cassidy Pont/Notebook/Biology 210 at AU
3/8/14
Zebrafish Embryology Experiment
Introduction:
This lab was to examine the effects of caffeine on zebrafish when in their embryonic stage and then into adulthood. This experiment was based off a scientific article titled, “Movement disorder and neuromuscular change in zebrafish embryos after exposure to caffeine” (Chen et al., 2008). It is important to study the effects of caffeine since it is not studied often, but can have significant effects to an animal’s growth and development; additionally it is also important to study since “little is known about the teratogenic effects of caffeine during early embryonic development” (Chen et al., 2008). Zebrafish serve as a good model organism to study the embryonic development since they have transparent eggs, making observation easy to observe when they are in their embryonic stage(s). Based off of this article and previous knowledge of the effects of caffeine, it is hypothesized that the zebra fish exposed to caffeine will result in stunted growth, increase in motility, and shorter life span.
Materials and Methods:
After the embryos were initially gathered and properly set up, they were observed over a two week time period, specifically on days: 1, 3, 6, 7, 9, and 13, and then fixed slides on day 14.
Day 1: Forty zebra fish embryos were randomly selected and 20 were placed into either the control and test group. In control groups were inhabited by 25 mL of Deerpark water, while the test group were placed in 25 mL of a caffeine solution. The dependent variables that were observed were as follows: hatching, viability, movement, timing and amount of yolk absorption, development of eye pigmentation, eye movement, development of body/tail pigmentation (melanophores), and if there were any tails/fins/bladder present. A random sample of 10 embryos was staged to serve as a representative population for each the control and test group.
Day 3: Both the water from the control group’s petri dish and the caffeine solution from the test group were both cleaned out with the use of a dropper and each replaced with 10 mL of their respective liquids. A random sample of 10 embryos was staged to serve as a representative population for each the control and test group. Then the following dependent variables were observed from each groups of zebrafish: hatching, viability, movement, timing and amount of yolk absorption, development of eye pigmentation, eye movement, development of body/tail pigmentation (melanophores), and if there were any tails/fins/bladder present. The tail length and eye diameter were estimated in millimeters if possible to see. If any zebrafish had died, they were removed and placed in a vile to later be fixed in a paraformaldehyde to be able to get better measurements of the tail, body, and eye diameter.
Day 6: Both the water from the control group’s petri dish and the caffeine solution from the test group were both cleaned out with the use of a dropper and each replaced with 10 mL of their respective liquids. A random sample of 10 embryos was staged to serve as a representative population for each the control and test group. Then the following dependent variables were observed from each groups of zebrafish: hatching, viability, movement, timing and amount of yolk absorption, development of eye pigmentation, eye movement, development of body/tail pigmentation (melanophores), and if there were any tails/fins/bladder present. The tail length, total body length, and eye diameter were estimated in millimeters, if possible to see. If any zebrafish had died, they were removed and placed in a vile to later be fixed in a paraformaldehyde to be able to get better measurements of the tail, body, and eye diameter.
Day 7: Both the water from the control group’s petri dish and the caffeine solution from the test group were both cleaned out with the use of a dropper and each replaced with 10 mL of their respective liquids. A random sample of 10 embryos was staged to serve as a representative population for each the control and test group. Then the following dependent variables were observed from each groups of zebrafish: hatching, viability, movement, timing and amount of yolk absorption, development of eye pigmentation, eye movement, development of body/tail pigmentation (melanophores), and if there were any tails/fins/bladder present. The tail length, total body length, and eye diameter were estimated in millimeters, if possible to see. The heart rate was also measured if able to see. If any zebrafish had died, they were removed and fixed in a paraformaldehyde to be able to get better measurements of the tail, body, and eye diameter.
Day 9: Both the water from the control group’s petri dish and the caffeine solution from the test group were both cleaned out with the use of a dropper and each replaced with 10 mL of their respective liquids. A random sample of 10 embryos was staged to serve as a representative population for each the control and test group. Then the following dependent variables were observed from each groups of zebrafish: hatching, viability, movement, timing and amount of yolk absorption, development of eye pigmentation, eye movement, development of body/tail pigmentation (melanophores), and if there were any tails/fins/bladder present. If any zebrafish had died, they were removed and fixed in a paraformaldehyde to be able to get better measurements of the tail, body, and eye diameter.
Day 13: All of the zebrafish had died. The dependent variables that were recorded were: hatched, viability, yolk absorption, amount of melanophores present, and an estimation of the tail length in millimeters. Four more zebrafish were fixed from the test group in order to observe later on in the experiment.
Day 14: The zebrafish were disposed of in the waste beaker and the patri dished were properly cleaned and put away. The fixed zebrafish were observed and the following dependent variables were able to be recorded: tail length, total length, and eye diameter. Then after all measurements were completed, an average of the measurements for each dependent variable were calculated for each observed group, such as: control group from day 7, test group from day 7, and test group from day 13.
Results:
Table 3: Fixed Slide Measurements

Table 1 shows how the zebrafish exposed to caffeine had a quicker growth, than the control group; additionally they showed more melanophore development and their yolks were absorbed faster. Table 2 describes the dependent variables observed for each day of observation, broken down by both control and test groups. Table 3 compares the length of tail, body, and eye diameter between the control and test group; the test group’s measurements were significantly shorter than the control groups.
Discussion:
The hypothesis proved valid as seen via the results. With the results discussed above, table one concludes that caffeine can speed the development of zebrafish embryos. The zebrafish in the test group that were exposed to caffeine had a quicker development as seen in the embryology staging. Table 2 describes how the test group’s fish showed more motility than the control group; this increase in movement refers to their fins, mouth, eyes and tail. The test group’s tails were more frantic moving and spastic. In addition to these observations, the fish exposed to caffeine seemed skinnier, which relates to their tails, body length, and eyes all being short/smaller than the control group’s as seen via Table 3. However, in Table 2 not all of the dependent variables could be collected each day, like heart rate, tail length, total body length, and/or eye diameter. The zebrafish were very active and hard to measure, therefore the measurements, if taken, were done by the eye and only roughly estimated if the zebrafish were still enough to obtain the rough measurement. The heart rate was only able to be measured one since all of the other zebrafishs’ hearts were not able to be clearly seen. Regarding the viability of the fish, it is hard to draw conclusions since all of the fish in both groups died before day 13. Therefore, it cannot be concluded if the caffeine caused a shorter life span since more fish from the control group died before the test group.
It can be hypothesized that human embryos would also be affected by caffeine if exposed to it as an embryo. Since the zebrafish were a model organism for the effects of caffeine on embryonic development, the conclusions drawn from this experiment can be reflected on human embryos. Therefore, if human embryos are exposed to caffeine via their mother’s placenta providing them with nutrients, perhaps they will age quicker while in the embryo. It is predicted this may make that human beings die quicker since they aged faster in the embryo, which could affect their adult lifespan. Or, perhaps the human, once born, will have stunted growth like the zebrafish exposed to caffeine displayed once they hatched. However, it should be noted that this study collected empirical data, which is based off of observations. Observation may vary depending on who is studying the organism, therefore many predictions and/or hypothesis could be drawn from this experiment depending on the different observations each individual observes.
If this study were to be conducted again in the future, the temperature of the room needs to be kept at a cool enough temperature to ensure the room does not get too hot, overheating the zebrafish possibly leading to early death. Perhaps the room became to heated and caused the zebrafish to die, since there was a mass death before day 13 seen via Table 2. Something else that could be improved is measuring the heart-rate of the zebrafish. It was extremely difficult to be able to clearly see the beating heart in almost all of the zebrafish observed. Maybe a better microscope could have been used to obtain a clearer picture of the zebrafish in order to measure their heart-rates.
CP
2/26/14
Mini Lab Report
Introduction:
This lab was to examine our PCR reactions done earlier in lab 3. Since our PCR sequencing did not work, we used other groups’ PCR sequences from our same transect, Transect 4, which was the AU Community Garden.
Materials and Methods:
Refer to the second part of Lab 3.
Results:
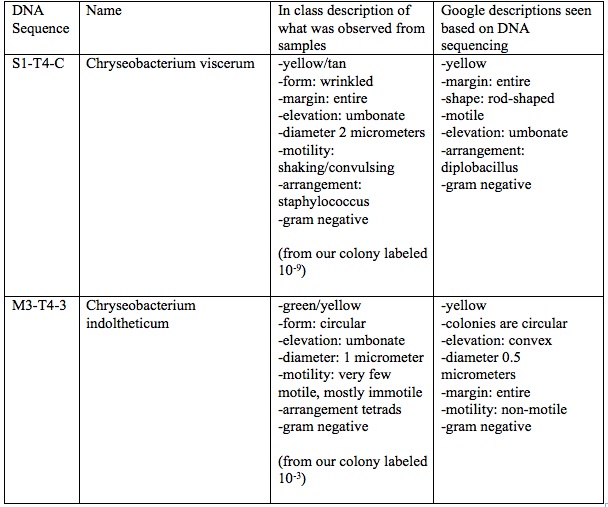
Table 1: Comparing Observed Bacterium with Identified Bacterium via “Blasting” Sequenced DNA in Transect 4
References:
http://blast.ncbi.nlm.nih.gov/Blast.cgi?PROGRAM=blastn&PAGE_TYPE=BlastSearch&LINK_LOC=blasthome
http://aem.asm.org/content/66/8/3337.figures-only
http://www.bacteriainphotos.com/Chryseobacterium.html
http://microbewiki.kenyon.edu/index.php/Chryseobacterium_indologenes (Cunniff)
http://www.ncbi.nlm.nih.gov/pubmed/22268076
Discussion:
Most of the bacteria observed in Transect 4–the AU Community Garden–seems to be from the chryseobacterium genus. For one of the samples from our transect observed, the bacteria was wrinkled, umbonate, yellow and of a staphylococcus arrangement. This sample was very similar to the Chryseobacterium viscerum that was identified via “blasting” the DNA sequence from another group who had our same transect. Their sample labeled S1-T4-C was also umbonate, yellow, motile, had entire margins, and was gram negative; however, this bacterium was diplobacillus, being rod shaped, rather than circular shaped. The other sample observed from our transect was also yellow, umbonate, and gram negative like our previous sample, but this bacterium was also a little green, circular, mostly immotile, and was arranged in tetrads. This bacterium was similar to the second sequened DNA from the other groups DNA from our same transect. The bacterium identified was Chryseobacterium indoltheticum, which is yellow, circular colonies, non-motile, and gram negative. In conclusion, mst of the bacteria is Transect 4 seems to be from the chryseobacterium family, which is commonly found in soil and also known as flavobacterium (Cunniff).
If this were to be done in the future, perhaps the DNA being sent out to be sequenced needs to be ensured to be in abundance to be able to obtain a clear sequencing reading from the lab. The DNA that was sent out to be sequenced was not able to be sequenced, therefore another groups sequence was used to compare the lab identified bacteria with the bacteria observed from the transect earlier in lab. Therefore, the DNA needs to be assured that it will work when sent to the lab in order for it to be sequenced correctly.
CP
2/12/14 and 2/13/14
Lab 5:
The objectives of this lab are to understand the importance of Invertebrates and to learn how simple systems have evolved into more complex systems. In the lab we will address these objectives by observing different invertebrates from our transects and invertebrates of prepared slides provided for us in lab.
Procedure I: Observing Invertebrates
Steps:
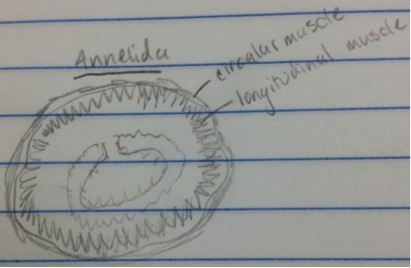
1. Observe the Annelida prepared slide and make note of the different types of muscles seen.
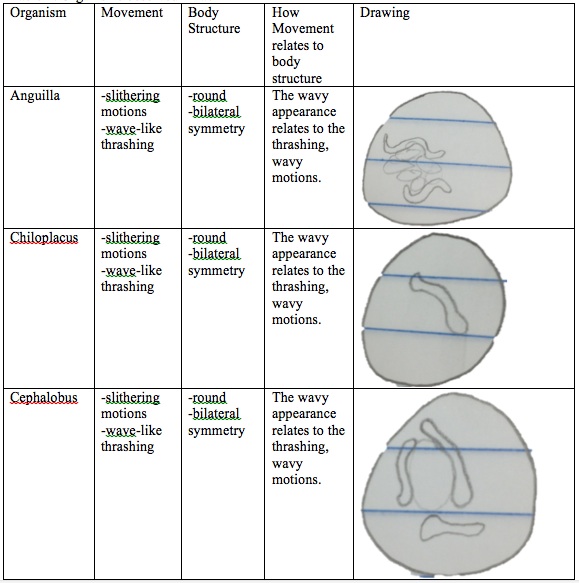
2. Make a slide of the three different organisms: Anguilla, Chiloplacus, and Cephalobus.
3. Record the movements of each organism
4. Compare and contrast the movements of these worms and how the movement relates to their body structures.
Raw Data:
Figure 1: Annelida
Table 1: Organisms observed in lab
Procedure II: Analyzing InVertebrates Collected with the Berlese Funnel
Steps:
1. Collect the test tube in which the Berlese Funnel was on top of and pour the top half of the contents in one petri dish labeled “top,” and pour the bottom half of its contents in a second petri dish labeled “bottom.”
2. Observe the two petri dishes.
3. Find at least five organisms from your leaf little samples from your transect. Use a pencil or probe and poke around to see the organisms better.
4. If no invertebrates can be found from the contents from your leaf litter sample, view the petri dishes provided for us in lab, which were taken from West Virginia.
5. Use the dichotomous keys provided in lab to identify the organisms.
6. When finished observing the organisms, take down the Berlese setup.
Raw data:
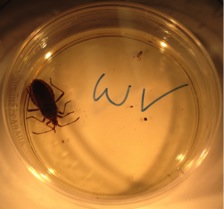
Figure 2: Petri Dish from West Virginia
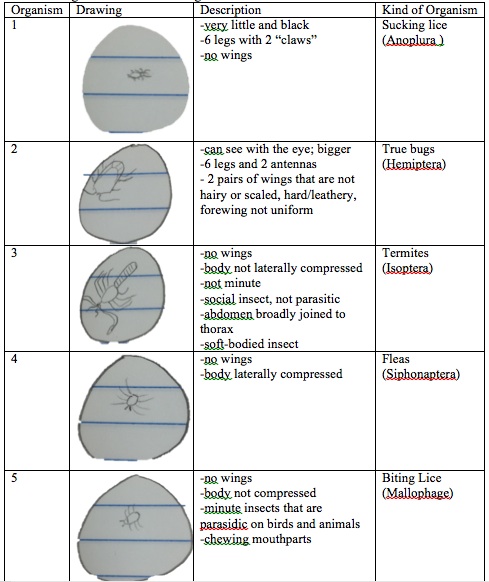
Table 2: Organisms from West Virginia
The largest organism was the true bugs, while the smallest was the flea. Lice were seen the most from the petri dish observed from West Virginia.
Procedure III: Unidentified Arthropods
Steps:
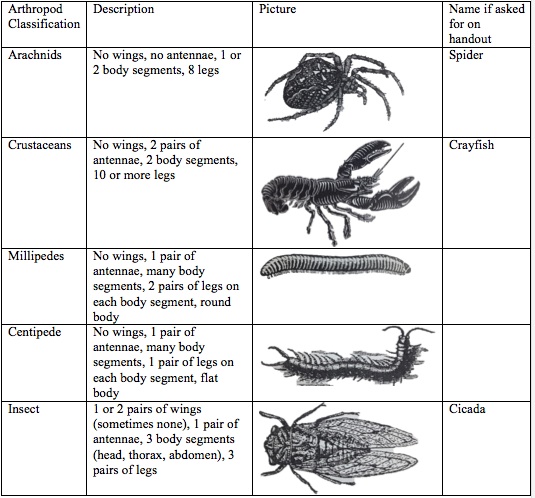
1. Use the handout and identify the different arthropods provided in lab.
2. Complete the handout given.
Raw data:
Table 3: Arthropods Worksheet
Table 4: Identifying Arthropods Provided in Lab
Procedure IV: Invertebrates and Niches
Steps:
1. Look at the organized groups of vertebrate in the textbook.
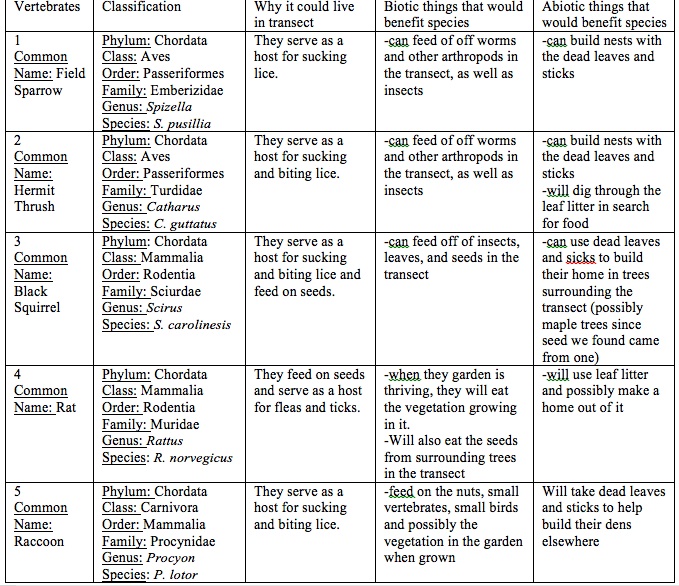
2. Identify 5 who might inhabit your transect. At least 2 must be bird species.
3. Determine the Classification of each, starting with the phylum through species.
4. Describe what biotic and abiotic characteristics of the transect would benefit each species.
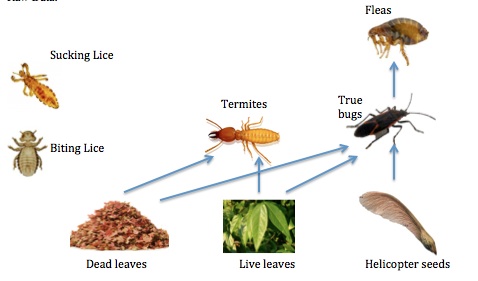
5. Then, construct a food web based on the organisms you have observed in your transect.
Table 5: Possible Vertebrates in our Transect
References Cited:
(2008). Raccoon. Retrieved from http://www.theanimalspot.com/raccoon.htm
(2013). Hermit Thrush. Retrieved from http://www.allaboutbirds.org/guide/hermit_thrush/id
Black squirrel. Retrieved from http://www.deertrail.us/minnesotawildlife/minnesotawildlife/blacksquirrel.html
Field Sparrow. In The Illustrated Encyclopedia Of North American Birds: An Essential Guide to Common Birds of North America (Google eBooks). Retrieved from http://books.google.com/books?id=borUJD5amQAC&pg=PT3374&lpg=PT3374&dq=field+sparrow+phylum&source=bl&ots=JXUhdGy4Hh&sig=9zOE9_Pywk6bvW_uRN5yagh1gns&hl=en&sa=X&ei=rOT8UoeVC6ejsQSTzYHQDg&ved=0CFYQ6AEwBQ#v=onepage&q=field%20sparrow%20phylum&f=false
Rat Dissection Introduction. Retrieved from http://www.biologycorner.com/worksheets/rat_intro.html#.UvzrXBbNrww
Steps:
1. Refer back to the organisms in which you identified in your transect.
2. Make a food web based on the organisms observed.
Raw data:
Figure 3: Food Web of Organisms in Transect
Conclusion and future plans: I now understand the importance of invertebrates by observing different organisms in lab. Invertebrates help our ecosystems and many ways and also serve as food sources for other organisms, such as birds and mammals. By observing Nematodes, I saw how simple structures have evolved into more complex systems. Perhaps we could have looked at more complex systems in lab of different organisms so we could really see how far evolution has taken primal invertebrates, and evolved into more complex systems.
CP
2/8/14
Lab 4:
The objectives of this lab are to understand the characteristics and diversity of plants, and to appreciate the function and important of fungi. In the lab we will address these objectives by observing plants from our transects and fungi provided to us in lab.
Procedure I: Collecting 5 Plant Samples from the Transect
Steps: 1. Bring three zipbloc bags with you as you proceed to assigned transect.
2. First obtain a leaf litter samples by finding an area with soft soil and dead leaves or ground cover over it. Dig into the crumbly top layer of the soil and all the plant matter. Place about 500 grams of litter into one bag.
3. Then, take a representative sample from 5 different plants in a way that is minimally damaging. Represent as many different plants as possible. Take photos of each sample and record on a drawn map of the transect where each was obtained from.
4. Also look out for any seeds, pine cones, flowers, etc. from the plants and bring them back to lab as well.
5. Describe the plants and where they were found in your notebook. Record the data in table 1.
6. Observe the moss and lily stem in the lab to determine what the xylem and phloem look like.
7. Observe your own plant samples and describe the vascularization in each plant and record information on Table 1. (Procedure II: Plant Vascularization)
8. Describe the cluster arrangement, shape, and size of the leaves from the transect sample plants and record in Table 1. (Procedure III: Plant Specialization)
9. Identify the seeds brought back from transect as either monocot or dicot. Record this information in Table 1. (Procedure IV: Plant Reproduction)
Raw data:
Table 1: Plant Samples and Descriptions
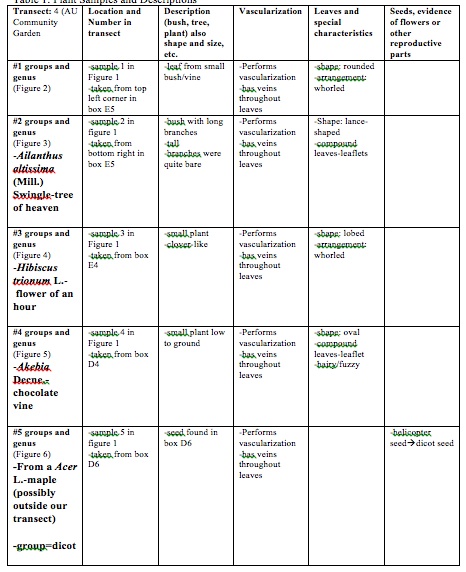
Figure One: Map drawing of transect
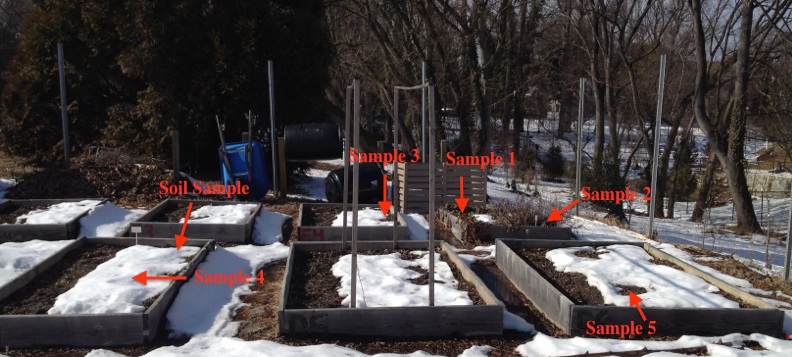
Figure Seven: All of the plant samples collected

Figure Eight: Drawing of sample 1
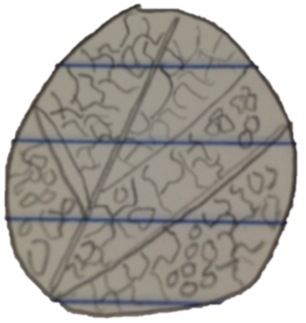
Figure 10: Drawing of Sample 3
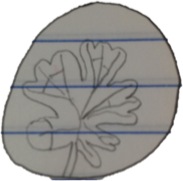
Figure 11: Drawing of Sample 4
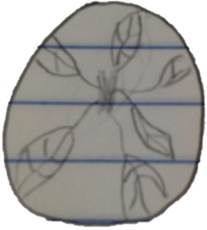
Figure 12: Drawing of Sample 5
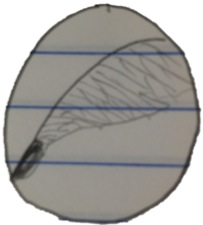
Procedure V: Observing Fungi
Steps: 1. Observe the fungi presented in lab. 2. Decide if they are fungi.
Raw data:
This is a drawing of fungi observed in lab. It is fungi due to the visible spores. Fungi sporangia are fruiting bodies that are involved in asexual reproduction of spores. They are important for they allow the fungi to reproduce asexually. (2002).
(2002). Fungi. Retrieved from http://biology.unm.edu/ccouncil/Biology_203/Summaries/Fungi.htm
In order to study invertebrates from our transect, a Berlese Funnel needed to be setup in order to collect invertebrates from the soil sample of our transect.
Procedure VI: Setting up the Berlese Funnel to Collect Invertebrates
Steps: 1. Pour about 25 ml of the 50:50 ethanol/water solution into the flask.
2. Fit a piece of the screening material into the bottom of the funnel. Tae the sides of the screen if need be so the leaf little does not fall into the preservation.
3. Place the funnel into the neck of the square-sided bottle.
4. Carefully place the leaf little sample in the top of the funnel. Then put a lighted 40 watt lamp above the funnel with the incandescent bulb about 1-2 inches from the top of the leaf litter. Cover everything with foil.
5. Leave the lighted setup on the lab bench for a week.
Conclusions and Future plans:
By observing, characterizing, and describing the 5 plant samples from our transects I was able to understand the characteristics and diversity of plants, since most of our samples were of different kinds of plants. Then, by examining the fungi, I was able to appreciate the function and importance of fungi and how important it is for them to have spores to they are able to reproduce. Next week we will be able to examine invertebrates from our soil sample from the transect. Due to the cold weather, I hope the invertebrates were able to survive the cold; however, the soil was wet when we collected it, which should have helped the invertebrates be alive and well due to it having rained.
CP
2/6/14; lab 1 notes
Great job, Cassidy! Make sure you bold each entry date. Also, work on creating a map of your transect that details the land and where your samples are collected from. We will talk more about this on Wednesday. Beautiful pics!
AP
1/29/14 Lab 3
The objectives of this lab are to understand the characteristics of bacteria, observe bacteria resistance, and to understand how DNA sequences are used to identify species. We will accomplish these goals by observing bacteria from our nutrient and tet agar plates, and observing if the tet plates have less bacteria on them indicating how some bacteria will be killed by antibiotics, while some colonies may still form on the tet plates and resist the antibiotic. Then we will perform a PCR procedure and make many copies of DNA from our bacteria.
Since Archaea tend to grow in extreme environments, I do not think any Archaea species will have grown on the agar plates. The agar plates were just sitting on the counter in the biology lab room, in standard conditions of the room, being not at an extreme temperature or in any other extreme conditions. There were also lids on the agar plates, which kept them from being contaminated or affected by things in the environment; this isolation kept the plates from any “extreme” conditions had there been any floating in the environment.
Procedure I: Quantifying and Observing Microorganisms
First we observed our Hay Infusion Culture and noted the changes from when we had previously observed it in Lab 2. There have been some changes in our Hay Infusion Culture. The growth that had formed in our niche seemed to have shrunk and basically disappeared. There is still a faint putrid smell and less dirt/sand on the bottom of the jar. The water was clearer and the water level had gone down since the lid was left off of the jar. The film that was present at the surface of the liquid was now gone along with the dead fly that was floating on it before. The appearance or smell might change week to week when observing our Hay Infusion Culture since the organisms in this particular niche are constantly using up the supplies of food, which could affect the amount of organisms alive if the food supply is not being replenished. If there is a shortage of food, more organisms will die due to not being able to survive. This could cause the smell of our culture to become worse since there may be decomposing organisms in it. As more weeks go by, perhaps the food supply will decrease every week, more organisms may die, and the smell will be come more putrid. Organisms that are decomposing may even disappear as time goes on since they decomposed so much, they are now nothing, which would explain the water looking clearer. Next we observed our agar plates that we had prepared in Lab 2 and recorded the following information about them:
Raw data:
Table 1: 100-fold Serial Dilutions Results

Procedure II: Antibiotic Resistance
The colony types on the nutrient agar plates seem to be bigger and more varied than the colonies on the tetracycline agar plates. This indicates that the bacteria (tetracycline) did in fact work and killed the bacteria it encountered. Tetracycline seems to have killed most of the bacteria colonies, but did allow some fungi growth, which may have been misinterpreted as bacterial colonies. Some bacteria have formed to resist tetracycline’s antibiotic inhibiting effects, and they do this via efflux pumps or ribosomal protection proteins (Roberts 2006).
Tetracycline is a type of antibiotic that works by interfering with the ability of bacteria to produce proteins that they need to survive (2013). Specifically, it binds to the 30S ribosomes of the bacteria and prevents the aminoacyl tRNA from binding to the RNA-ribosome complex ("Tetracycline-Antimicrobial properties"). Without such proteins the bacteria cannot grow; therefore, tetracycline stops the spread of infection and the bacteria that remains in the body will eventually be killed by the immune system of die on its own. Tetracycline is used to treat infections caused by chlamydia and/or mycoplasma organisms, such as pneumonia, but it can also be used to treat chronic bronchitis and other rare infections like rickettsia and Brucella bacteria. Acne vulgaris, syphilis, gonorrhea, tetanus, cholera, gas gangrene, and bacterial infections of the urinary tract are also all treated with tetracycline (2013).
(2013). Tetracycline Tablets. Retrieved from: http://www.netdoctor.co.uk/sex-and-relationships/medicines/tetracycline-tablets.html
Roberts, M. C. Tetracycline resistance determinants: mechanisms of action, regulation of expression, genetic mobility, and distribution. Wiley Online Library. Retrieved from: http://onlinelibrary.wiley.com/doi/10.1111/j.1574-6976.1996.tb00251.x/abstract;jsessionid=B97E4BD66F12AD837C5735FB2AB6ED38.f03t01
Tetracycline-Antimicrobial properties. Retrieved from: http://www.chm.bris.ac.uk/motm/tetracycline/antimicr.htm
Procedure III: Bacteria Cell Morphology Observations
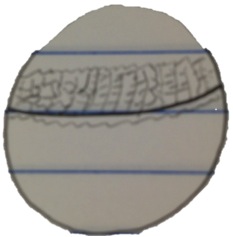
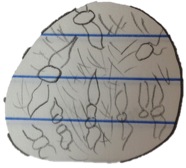
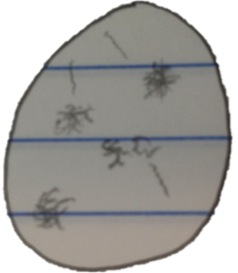
First we observed three different types of bacteria: bacilli, cocci, and spiriluim on prepared slides provided to us in lab. This allowed us to become familiar with the different types of bacteria and what they looked like to help us identify the bacteria growing on our nutrient and tet agar plates. Below are drawings of the different types of bacteria:
Raw data:
Figure one: Bacilli bacteria at 40 x
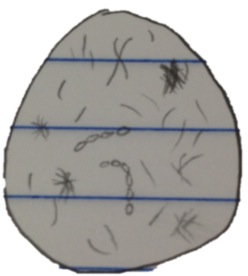
Figure two: Cocci bacteria at 40 x
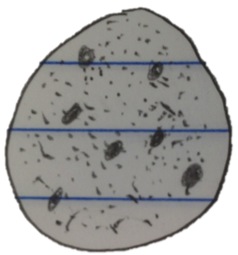
Figure three: Spirilium bacteria at 40 x:
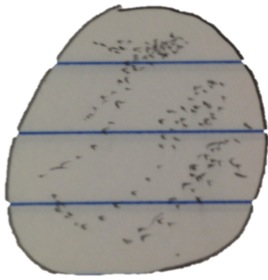
Then we made wet mound slides of different bacteria colonies from three different plates that bacteria had grown on. We followed the same procedure for each colony we chose, which was a colony from nutrient plate labeled 10-9, nutrient agar plate labeled 10-5, and a colony from the plates with tetracycline labeled 10-3.
Steps:
1. Obtain a clean loop and use it to scrape up a tiny amount of growth from the agar.
2. Mix the contents on the slide with a drop of water and place a cover slip over it.
3. Observe the wet mound slide with the 10x and 40x objective.
4. If bacteria cannot be seen, stain the sample with the stain provided in lab. Then re-look under the microscope.
Raw data:
The following was observed for each growth.
Table 2: Observations of Colonies
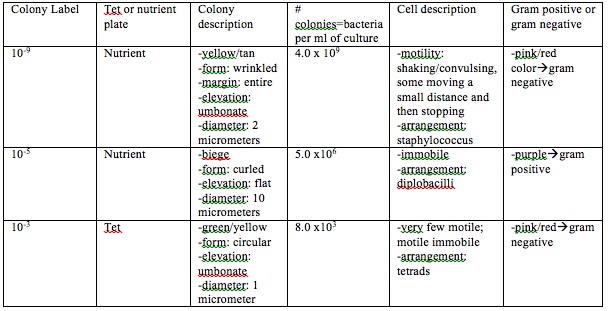
Figure 4: sample from nutrient plate 10-9 at 40 x
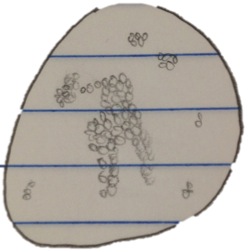
Figure 5: sample from nutrient plate 10-5 at 40 x
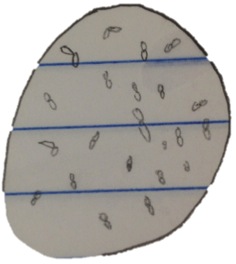
Figure 6: sample from tet plate labeled 10-3 at 40 x
In order to determine if the bacteria was gram positive or gram negative we performed a gram staining by doing the following procedure.
Steps:
1. Label the slides with the plate the sample came from the your initials.
2. Obtain a clean loop and get a sample of one of the colonies you have selected. Place the sample on a clean slide.
3. Obtain a Bunsen burner and light it.
4. Heat fix the air dried slide by passing it through a Bunsen burner flame seven times with the bacterial smear side up.
5. Work in a staining tray and cover the smear with crystal violet for 1 minute. Rinse gently.
6. Decolorize by flooding the smear with 95% alcohol for 10-20 seconds. Rinse gently. Decolorization has occurred when the solvent flows colorlessly from the slide.
7. Cover the smear with safranin stain for 20-30 seconds. Rinse gently.
8. Blot excess water with a paper towel and air dry.
9. Observe the stained samples under a microscope and record what you observe.
10. Determine if the sample is gram negative or positive. Gram positive samples will look purple, while gram negative samples will appear pinkish/redish. Record your determinations in Table 2.
Procedure IV: Start PCR Preparation for DNA Sequence Identification
Prior to leaving lab we started a PCR reaction by doing the following procedure:
Steps: 1. Obtain a clean loop and transfer some of the selected bacteria colony to 100 microliters of water in a sterile tube.
2. Incubate this for 10 minutes at 100°C.
3. Centrifuge the tube.
4. Place 5 microliters of the supernatant in the PCR reaction tube.
Conclusions and future plans:
I learned how to characterize bacteria via this lab. By looking at different bacterias in the beginning of the lab, we were able to compare the known bacteria to our samples of bacteria in order to characterize them. We did observe some antibiotic resistant on the 10-3 tet agar plate, which shows how not all bacteria are killed by all antibiotics. In two weeks we will use our PCR preparation and run it’s products on an agarose gel. This will allow us to see how DNA sequences can be used to identify species.
CP
1/22/14
Lab 2
The objectives in this lab are to understand how to use a dichotomous key and to understand the characteristics of Algae and Protists. We will do this by gaining experience and practice with a dichotomous key and by observing different species from two different areas of our jarred hay infusion culture.
First, we were instructed how to use a dichotomous key by starting with the first two choices on the key, and determining where to go from there in order to identify the species being observed. Then we observed different organisms that were known and practiced using the dichotomous key. The key described different Protozoan and allowed us to become experts on using these kinds of keys to determine a species.
Next, we observed our hay infusion cultures and noted the following observations:
Raw data:
Hay Infusion Culture Observations: light brown, murky; sand/dirt at the bottom of the jar; film at the top of the liquid; fuzzy, brown large growth near the side of the jar with a stem growing out of it; small dead fly floating at the top of the liquid; smells badly
After we observed our hay infusion culture, we took a sample from the top and bottom of the culture. A small sample from each area was taken and placed on a clean microscope slide with a cover slip on top of the sample. Then the slide was placed in a microscope and observed. Three different organisms were observed from each sample and recorded below.
Raw data:
Organisms from bottom of the niche:
Organism 1 at 10x:
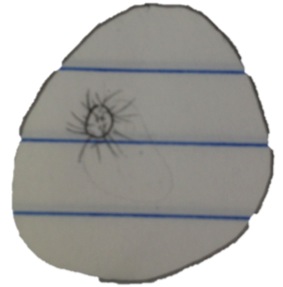
- colorless, floats without apparent motion, spherical shaped with radiating “spine”
-70 micrometers
This organism is an Actinosphaerium.
Organism 2 at 40x:
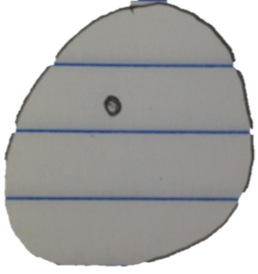
-colorless, spastic movements, has cilia in groups/specific areas, cell not on stalk, cell swims with spiral motion
-80 micrometers
This organism is a Didinuium.
Organism 3 at 40x:
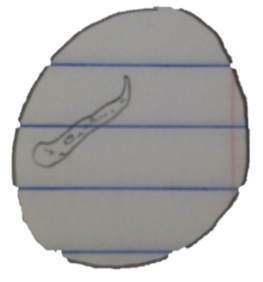
-colorless, slug-like/creeping, no spine, changes shape, many small nucleus
-30 micrometers/3mm
This organism is a Pelomyxa.
This species meets all of the needs of life. The needs of life are: to have energy, cells, be able to transfer information, replication, and evolution. Pelomyxa are complex organisms that use energy to perform specific functions and is made up of cells. This organism is able to transfer information to other organisms via reproduction, which is a form of replicating itself. Pelomyxa are a product of evolution as seen in a phylogeny of protozoan.
Organisms from the top of the niche:
Organism 4 at 10x:
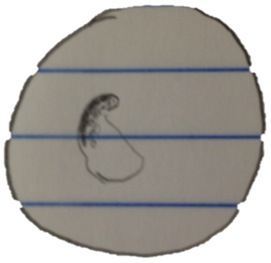
-pinkish in color, immobile
-110 micrometers
This organism is a Blepharisma sp. (even though small for it’s normal size; could be a mutation in this specific organism)
Organism 5 at 40x:
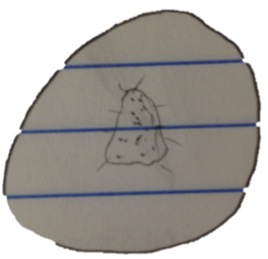
-green, immobile
-25 micrometers
This organism is a Eudorina.
Organism 6 at 40x:
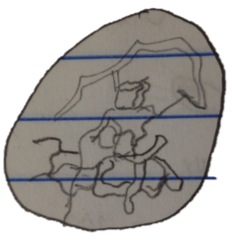
-clear, colony of many cells, chain-like structure
-87.5 micrometers
This organism is a Gonium.
If the hay infusion culture was observed for another two months, I would predict a lot more organisms to have formed, or bred with each other to make more organisms. I think that the more time the hay infusion culture had to sit the more organisms would have been able to thrive in that environment. However, with that being said, I think the more fit organisms would be revealed after two months due to natural selection in this particular environment. So, the organisms that were better adapted to this environment would have survived better than those that did not adapt as well.
One selective pressure that could have affected the amount of organisms in our sample could have been the food supply. If there were more food sources available in the jar, perhaps more organisms would have been able to survive, or the organisms that were originally present could have thrived off of that food supply and reproduced more organisms. Another selective pressure that could have affected the composition of our sample could have been the presence of predators. Perhaps one of the biotic organisms was a predator to other organisms in our sample, which would have decreased the amount of prey the predators fed on.
Prior to leaving lab we prepared and plated serial dilutions for Lab 3.
Steps:
1. Obtain four test tubes of 10 mL sterile broth and labeling them 2, 4, 6, 8.
2. Obtain four nutrient agar plates and three tetracycline plates that were labeled with a “T.” The nutrient agar plates were labeled 10-3, 10-5, 10-7, 10-9, and the tetracycline plates were labeled 10-3, 10-5, 10-7, along with our groups initials.
3. Mix/lightly shake hay infusion culture.
4. 100 microliters were taken from the culture and added to 10 mL of broth in the tube labeled 2 for 10-2 dilution; the inoculated tube was swirled after doing so.
5. 100 microliters from tube 2 was now taken to inoculate test tube 4, for the 10-4 dilution; this tube was swirled to mix.
6. This process was repeated to make 10-6 and 10-8 dilutions with the remaining labeled test tubes.
7. After inoculating all of the test tubes, 100 microliters from the 10-8 tube was taken and places on the surface of the nutrient agar plate labeled 10-9. Immediately put the lid on the plate after spreading.
8. Spread sample with spreader provided in lab. Since we were using the same spreader for all of the plates, we had to start with the most diluted solution so it would not contaminate the other solutions with a higher concentration.
9. Next we took 100 microliters from the 10-6 tube and placed it on the surface of the nutrient agar plate labeled 10-7, then spread the sample around. The same process was performed for the tetracycline (tet) plate.
10. Repeat this process with the remaining test tubes and agar plates, using a new tip on the micropipette each time, and placing the 10-4 solution on the plates labeled 10-5, and the solution labeled 10-2 on the plates labeled 10-3.
11. Once all the agar plates have been spread with it’s respective solution and lids had been placed, the agar plates will be moved to an area in the lab and incubate at room temperature over the week.
Raw data:
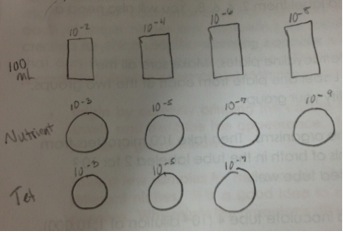
A drawing of the serial dilution process was drawn below:
Diagram of Serial Dilutions:
Figure One:

These figures depict the serial dilutions that were performed during this lab in preparation for Lab 3.
Conclusions and future plans:
After completing this lab I feel more comfortable using a dichotomous key by first practicing with known organisms, and then identifying organisms from our own hay infusion cultures. I also understand how to characterize different Algea and Protists after completing this lab. I think that in the next lab when looking at our serial dilutions on the nutrient and tet plates, I think the tet plates will have less bacteria on them due to the tet being an antibiotic and killing bacteria.
CP
Transect Observations
Day 1: 1/15/14
Introduction:
The objective is to understand natural selection and the biotic and abiotic characteristics of a niche by observing our assigned transects.
Materials and Methods:
We were assigned a particular niche that was marked off for us with 4 Popsicle sticks, which was 20 by 20 feet. Then we observed our transect as follows:
Raw Data:
Location: AU Community Garden
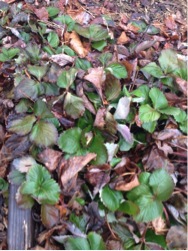
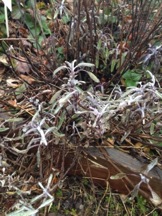
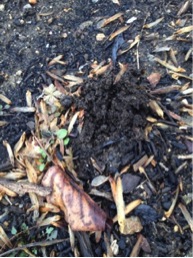
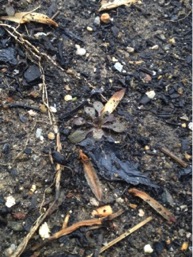
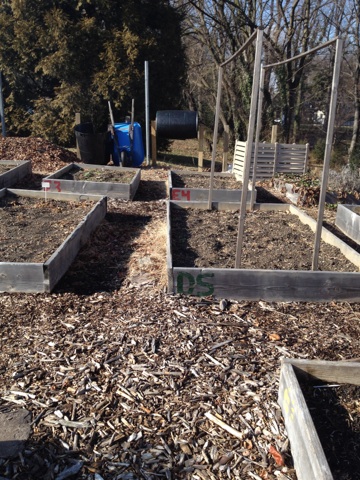
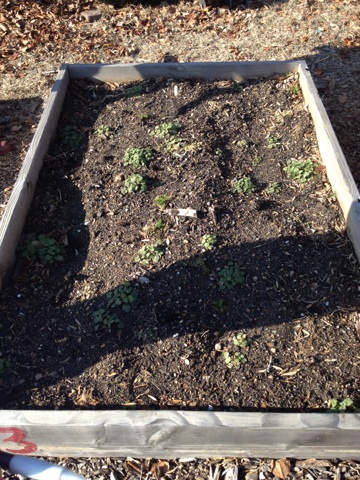
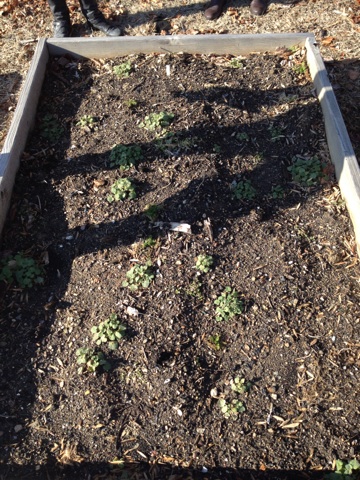
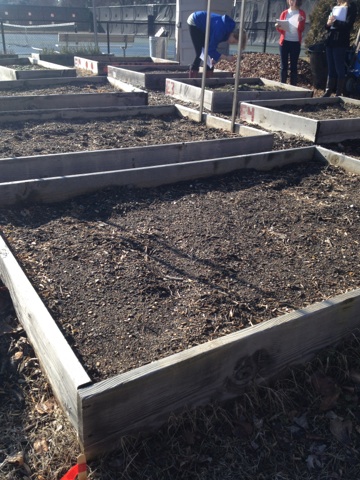
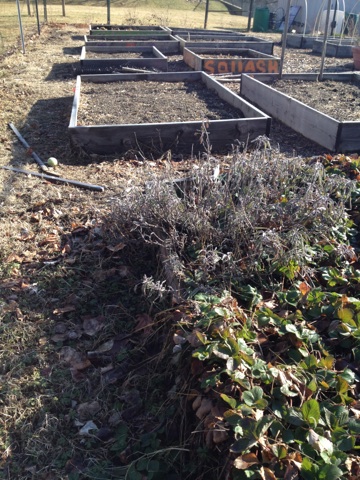
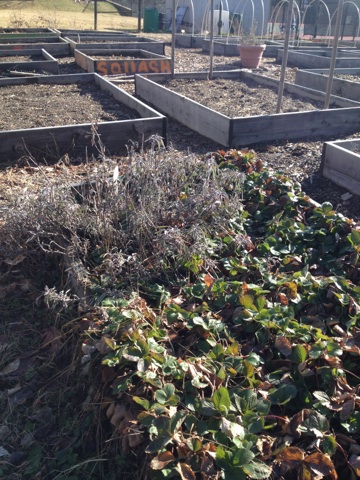
Topography: relatively flat land with 6 built up “boxes” made with wood boards and filled with soil/dirt, and possibly filled with various vegetation that is unidentifiable at the moment
Abiotic components: straw, dead grass/leaves, rocks, mulch, soil, dead bush in box labeled E5; good air quality due to trees surrounding area to purify air; windy/breezy with little blockage by building and other obstructions; gets water well from rain with no obstructions above it
Biotic components: weeds, grass, clovers; vegetation in boxes, such as D4; green leaves in E5; flies/gnats; some animals may be around since Alyssa said deer droppings were found the day before there
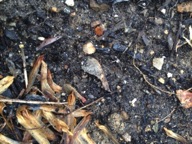
These are photos of our niche taken on January 15th, 2014. As you can see there is not much vegetation going on in the AU Community Garden due to the cold weather this winter season.
After observing the transect, we needed to take a sample of the soil back with us to the lab and did this by doing the following:
Materials and Methods:
Steps:
1. Obtain 50 mL conical tube to take a soil and ground vegetation sample from our niche.
2. When returned to the lab, we weighed 11.705 grams of our soil sample and placed it in a plastic jar with 500 mLs of deerpark water; the jar was labeled with our initials on it and “Group 2.”
3. Next, 0.1 gram of dried milk was added to the jarred sample and mixed for about 10 seconds.
4. The top of the jar was removed and placed in a safe place in the lab.
Conclusion and Future Plans:
Next week we will observe our hay infusion culture and look for protists that are inhabited in our niche. Our niche did not have much vegetation growing in the soil due to the cold weather, so I do not intend to see much growth in our jarred niche next week. I understand what the biotic and abiotic components of a niche are and we observed the transects we were assigned. However, we did not observe natural selection yet, so I am hoping to see organisms alive and some dead in our jarred niche due to natural selection next week.
CP
1/22/14 Cassidy Pont entered text and assigned lab notebook username successfully CP


