User:Andy Maloney/Notebook/Lab Notebook of Andy Maloney/2010/04/13
From OpenWetWare
Jump to navigationJump to search
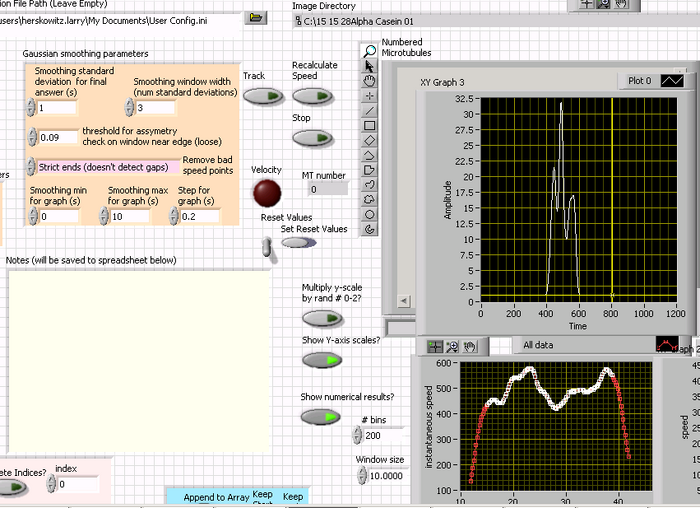
Today we looked at tracked MTs using histograms. Some interesting things we saw were:
- Bimodal behavior in the non osmolyte solutions.
- Smoothing doesn't shift the peak frequency very much.
- Trimodal behavior in the osmolyte solutions.
- The peak frequency in the osmolyte solutions was always less than the peak frequency in the non-osmolyte solutions.
- A "slower" MT had a higher frequecy peak at a lower speed.
- We see similar modal behaviors with the different caseins.
Some things to try and look into include:
- Are there height differences in the bimodal behavior for early observation times and latter observation times?
- Steve Koch 01:20, 14 April 2010 (EDT): I too was convinced on the distinct speed switching, which was seen in both looking at smoothed instantaneous speed and sliding window histogram of smoothed instantaneous speeds. Very interesting! For the future, we need a better way of capturing those data analysis sessions. One thing that may help is we could just save screen shots to a public directory -- either automatically or on demand. Then we could link to those at least when we're in a hurry.
