User:Alyssa Lillian/Notebook/Biology 210 at AU
March 30, 2016
Purpose: The purpose of this lab was to determine the effect that antibiotics (e.g. Amoxicillin) and beta-blockers (e.g Metoprolol) have on the development of zebrafish and to use this information to make predictions about the effects of these drugs on the development of mammalian embryos.
Materials & Methods: Day 0: The first treatment was made by crushing up 1 tablet of 825 mg Amoxicillin and dissolving it in water to create a 140 mg/mL solution. The second treatment was made by crushing up 1 tablet of 25 mg Metoprolol and dissolving it in water to create a 50 mg/mL solution. The control consisted of Deerpark water treated with methylene blue. A well plate with 24 wells was obtained and 2 mL of the control was placed into the first 2 rows of wells (A1-A8), 2 mL of the Amoxicillin solution was placed into the second 2 rows (B1-B8), and 2 mL of the Metoprolol solution was placed into the last 2 rows (C1-C8). One unhatched zebrafish embryo was then placed into each of the wells.
Days 1-3, 5, 6, 8-10, 12-14: The zebrafish were placed under a dissecting microscope for observation of developmental stage, motility, and physical characteristics (e.g. size, shape, pigmentation, deformities). Once all fish hatched, the embryos were removed from the wells. Water levels were maintained and fish, once hatched, were fed 15 μL of brine shrimp once daily. If any fish had died, the date was noted and the fish was removed from the well plate. Any fish whose development appeared to have merit for this experiment were fixed. They were first anesthetized in a 0.02% tricaine solution and then transferred to a vial of 4% formaldehyde for preservation.
Days 4, 7, 11: On these days, the zebrafish were placed in a depression slide and viewed under a compound microscope at 4x, where more detailed observations could be made. Specific attention was given to the developmental stage of the fish, any physical abnormalities present (e.g. lack of movement, startle response, protruding jaw, underdeveloped swim bladder, absence of or delayed fin development, and abnormal body curvature, size, and/or pigment), development and movement of eyes, and heart rate. Where applicable, the ocular micrometer was used in taking measurements. After observation were made, the fish were returned to the well plate. Maintenance of water levels continued and fish were fed 15 μL of brine shrimp.
After day 14, the remaining live fish were fixed and the dead fish, along with the well plate, were disposed of.
Data & Observations: Both Amoxicillin and Metoprolol caused physical abnormalities in developing zebrafish. These included: curvature of the body, swim bladder disease, hyperpigmentation, wide-set eyes, and underdeveloped find which caused swimming difficulties. Changes in heart rate, specifically bradycardia, was noticed in the zebrafish. The development of these characteristics in fish was measured using a rating scale that was created to determine exactly how much each treatment affected individual factors.
Developmental Stages Seen in Zebrafish
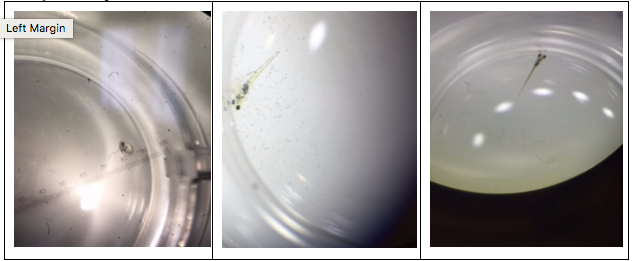 Figure 38-40. Different developmental stages of the zebrafish seen under a dissecting microscope. Fig. 38 shows the 13 somite stage, fig. 39 shows the 48 hour stage, and fig. 40 shows a fully developed zebrafish.
Abnormalities: Shape
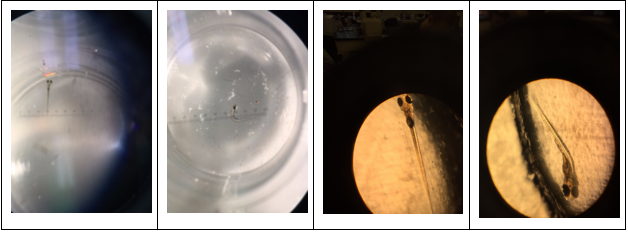 Figure 41-44. Abnormalities in zebrafish shape, specifically with respect to curvature of body seen under dissecting scope (fig. 41,42) and under compound microscope at 4x (fig. 43,44). Fig. 41 and 43 have no abnormalities and serve as comparisons for fig. 42 and 44, where body is deformed.
Abnormalities: Development of Swim Bladder
 Figure 45-46. Abnormality seen in development of swim bladder seen under a compound microscope at 4x. Fig. 45 shows a normally developed swim bladder and fig. 46 shows an underdeveloped swim bladder.
Abnormalities: Pigmentation
 Figure 47-48. Abnormality seen in the pigmentation of the fish under a dissecting microscope. Fig. 47 shows normal pigmentation and fig. 48 shows hyperpigmentation in the yellow-green color of the fish.
Abnormalities: Eye Development
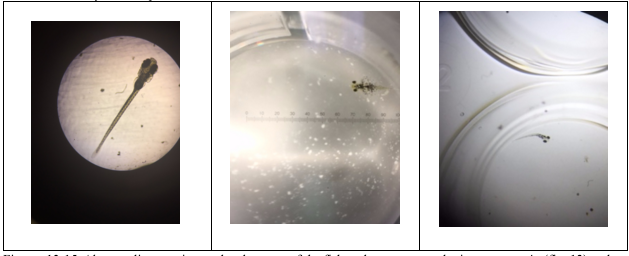 Figure 49-51. Abnormality seen in eye development of the fish under a compound microscope at 4x (fig. 49) and a dissecting microscope (fig. 50-51). Fig. 49 shows normal development of eyes and fig. 50-51 show abnormally developed wide-set eyes.
Abnormalities: Fin Development and Swimming Abilities
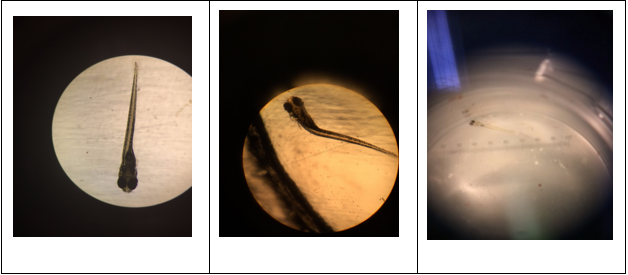 Figure 52-54. Abnormalities seen in fin development and swimming abilities of the fish under a compound microscope at 4x (fig. 52-53) and a dissecting microscope (fig. 54). Fig. 52 shows normal fin development and fig. 53-54 show abnormal fins leading to difficulty swimming and decreased motility. Fig. 53 shows a normal fin on the left side and an anomalous right fin that can not be seen due to its small size or lack thereof. Fig. 54 shows a fish that did not develop any fins and as a result, is seen floating on its right side, unable to swim.
Scale for Rating of Developmental Fish Characteristics
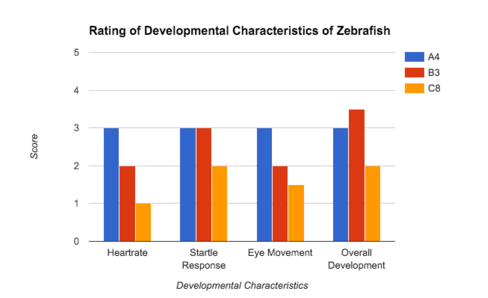 Figure 55. Graph explaining the scale used to rate specific developmental characteristics of the zebrafish.
Rating of Developmental Characteristics of Zebrafish
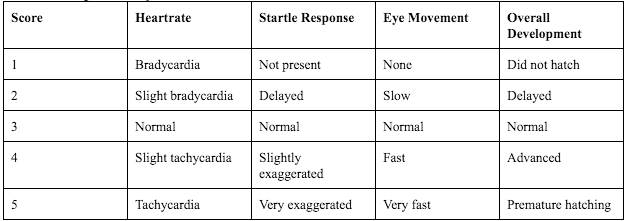 Figure 56. Graph of the scores given to zebrafish using the rating scale seen in table 2. The graph uses the data for one zebrafish from each group (control: A, treatment 1/Amoxicillin: B, treatment 2/Metoprolol: C) to represent the general findings for each of the different treatments.
Conclusions & Future Directions:
From this experiment, it is evident that both Amoxicillin and Metoprolol have an effect on the development of zebrafish. This is seen in the numerous abnormalities that resulted from treatment with these drugs. However, the significance of these findings with respect to development of humans is still unclear. If I were to conduct a similar experiment again, I would do so either with only one drug treatment or with drugs that are more similar than Amoxicillin and Metoprolol.
March 16, 2016
Purpose: The purpose of this lab was to observe the invertebrates from the Berlese funnel that had previously been constructed using matter from our transect and to identify the invertebrates through the use of a dichotomous key.
Materials & Methods: Analysis of Invertebrates procedure: Deconstruct the Berlese funnel and decant the top 10-15 mL of liquid, comprised of ethanol and organisms, into a petri dish. Pour the remaining liquid into a separate petri dish. Use a dissecting microscope to observe the invertebrates present in the different petri dishes and identify and characterize them using a dichotomous key.
Data & Observations: The organisms found in our transect (described in the entry on February 23rd) make up a community, which is all of the species that interact with each other in a certain area. Each organism has a specific trophic level, or feeding level based on its position in the community hierarchy. Additionally, the quantity of organisms present is representative of the carrying capacity of the community. The carrying capacity is the maximum population size of a certain species that a given habitat can support.
A Food Web Showing the Trophic Level of Organisms Present in the Transect
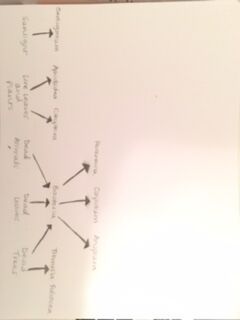 Fig 37. A food web that illustrates the hierarchy present within transect 1.
Conclusions & Future Directions: It is evident that the ecological concepts of community, trophic level, and carrying capacity are present regardless of the size or influence of ecological community.
-AL
March 2, 2016
Purpose: The purpose of this lab is to use PCR to amplify the 16s ribosomal subunit and then to run the PCR on a gel to see the protein as it relates to specific bacterial species.
Materials & Methods: Two PCR tubes were labeled with specific transect numbers, identification of specific bacterial colonies, and our group number. 20μL of a primer/water mixture was added to a labeled PCR tube and it was mixed until the PCR bead was dissolved. A sample of the bacterial colony in question was obtained using a toothpick, which was then submerged into the PCR tube containing the primer/water mixture. Once the bacteria had been fully dislodged from the toothpick, the PCR tube was closed and placed into the PCR machine. The same procedure was repeated again using a different bacterial colony. The next lab, the PCR was run onto an agarose gel.
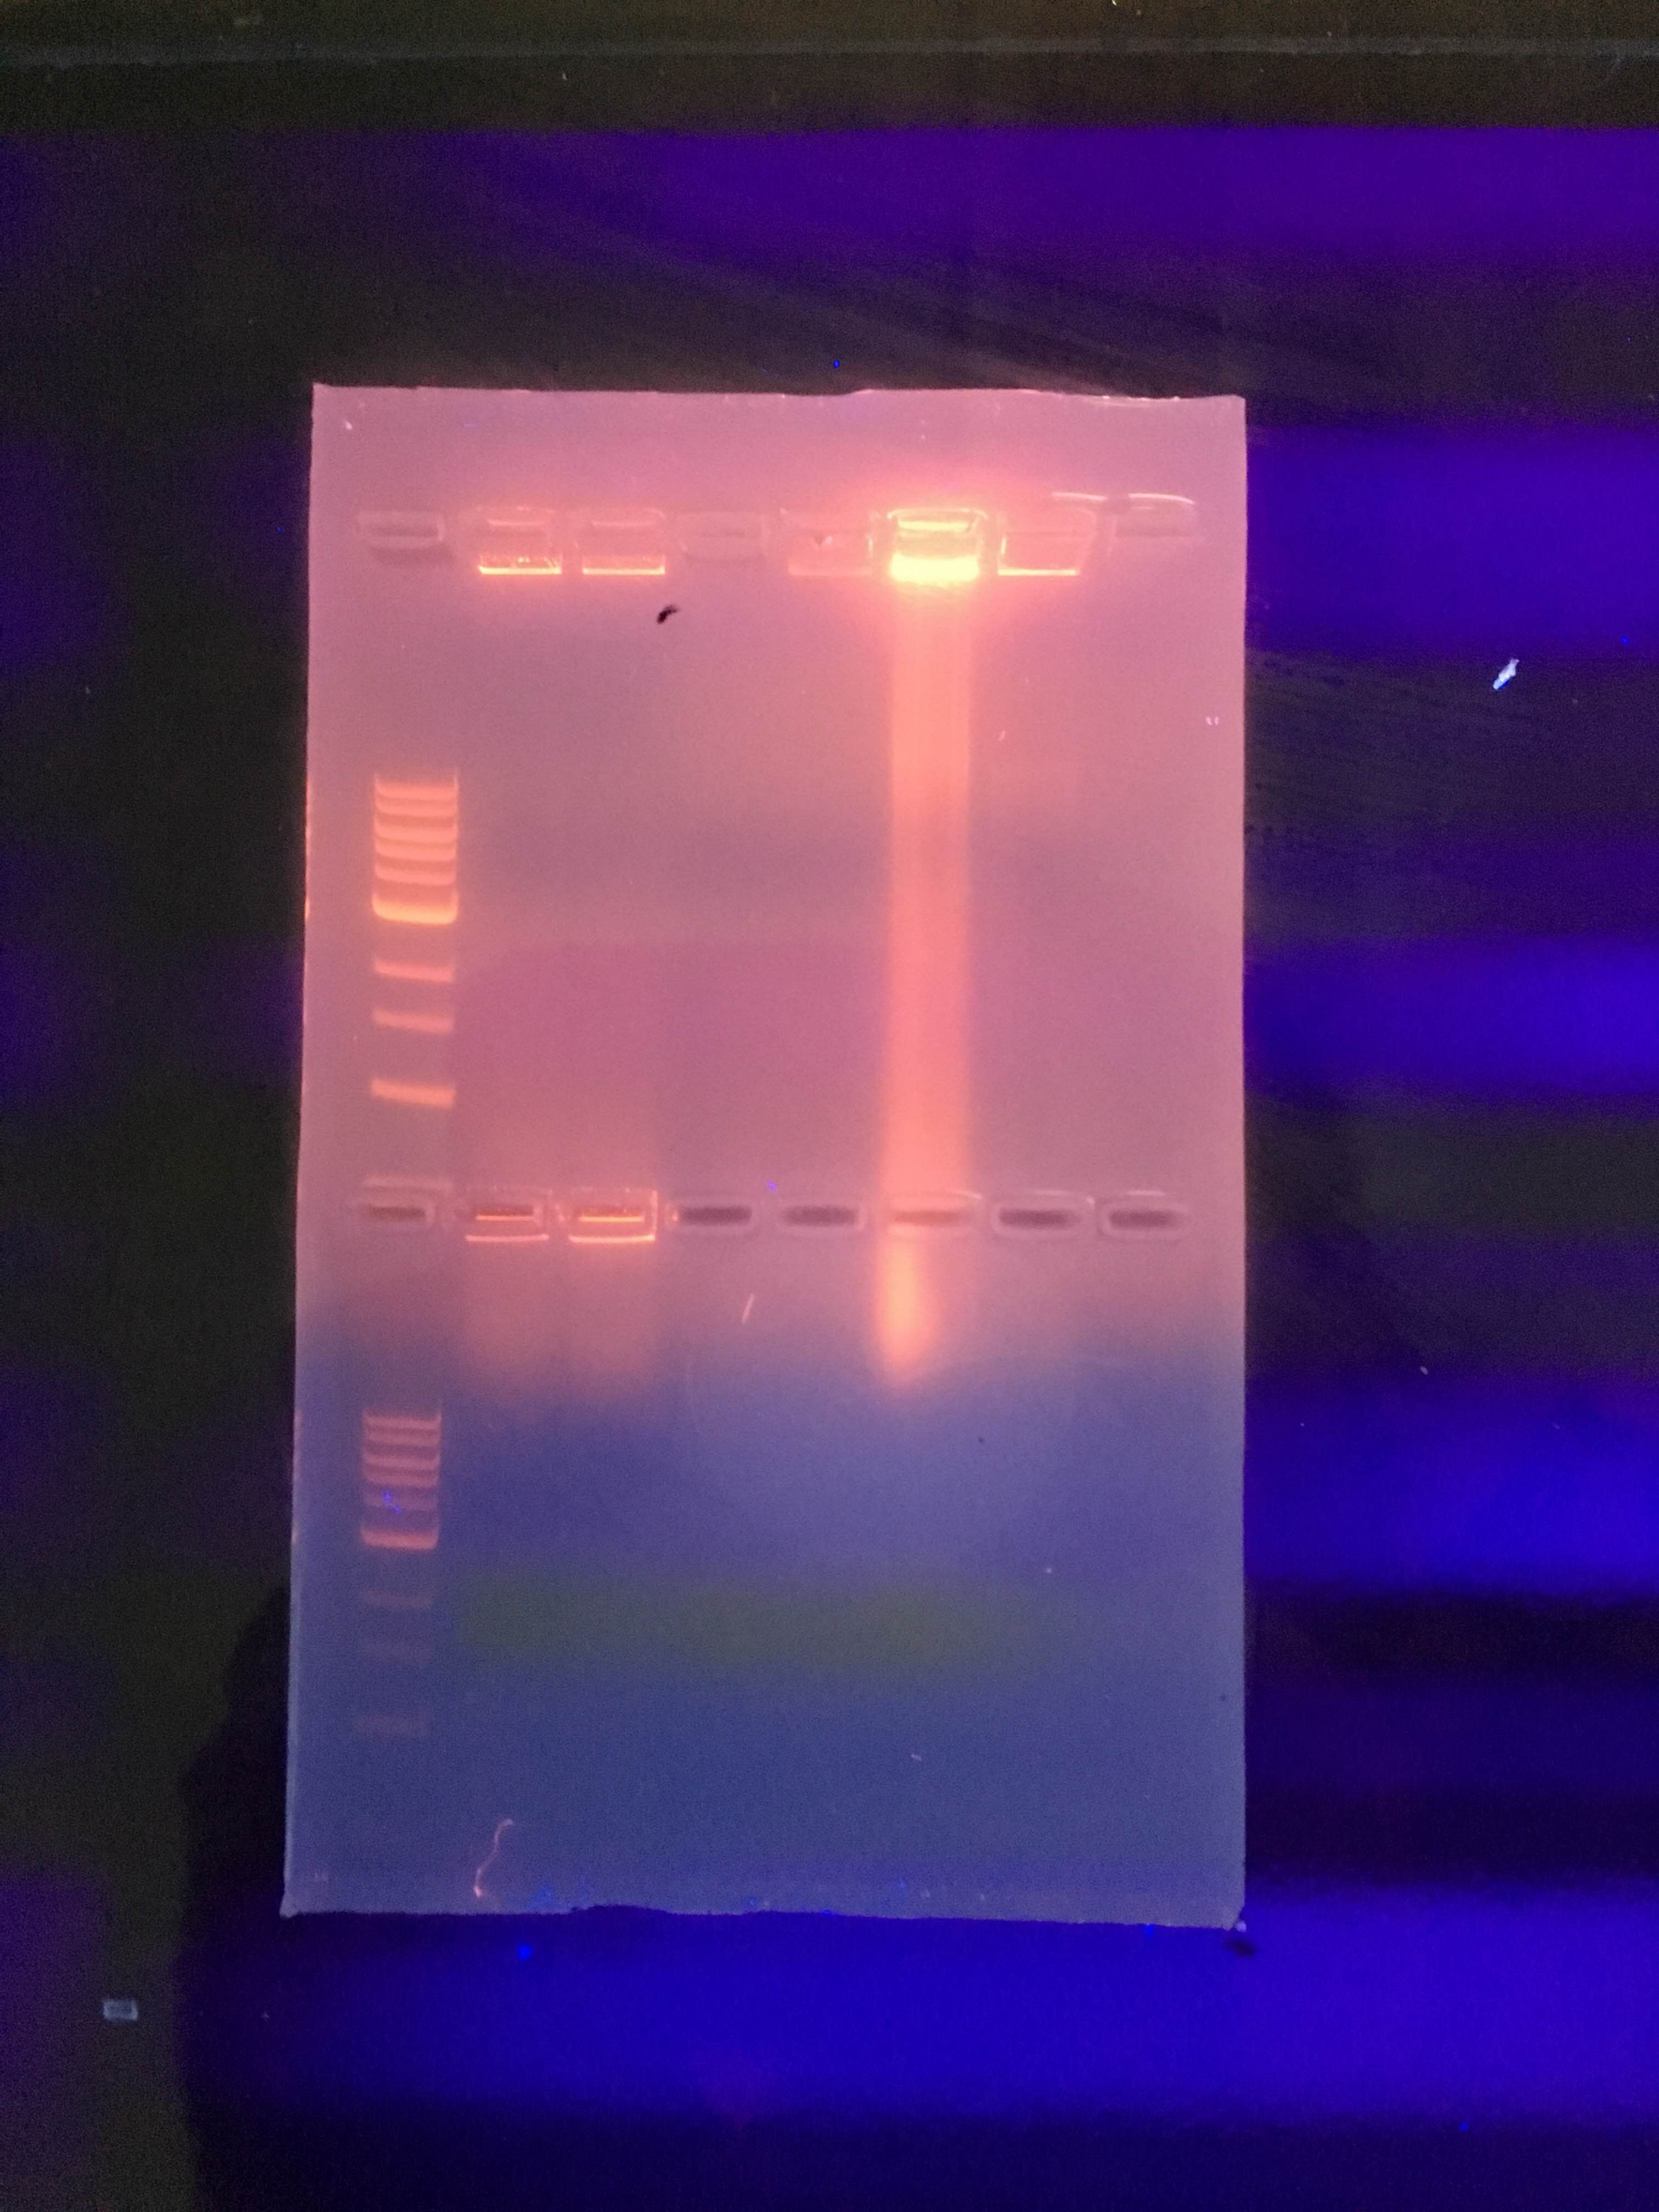
Data & Observations: Since the 16s ribosomal subunit is different for every species of bacteria, it can be used to identify which bacteria is present in a certain sample. However, the PCR run on the gel was unable to help us identify bacterial species because it did not run correctly. We hypothesized that there may have been too much of the sample present for the gel to run correctly or that there was an issue with the bacterial colonies themselves. Regardless, the gel was not able to provide any conclusive identification for the bacteria present in the colonies. If it had worked, the identities of the bacteria should have matched up with our descriptions of the colony morphology as well as the results of the gram stain and the motility studies to provide conclusive identifications. Nevertheless, photos of the agarose gel are provided (fig. 34 and 35). We were instructed to find another person's lab notebook that had the information from a successful PCR but I was unable (after a significant amount of searching) to find a notebook that had this information from our transect. However, I found PCR results from a transect that has many of the same characteristics of ours. The transect in the lab notebook I am consulting is transect 2 and the notebook belongs to CJ Woloshchuk. The following information and figure 36 is from her notebook:
MB43 (16s Sequence from Agar plate with Nutrient 10^-5): GGNNNNNNNNNNNNNNNNANNNTGCAGTCGTACAGGTAGCCGTAANTTGCTCTCGGGTGACGAGTGGCGGACGGGTGANT AATGTCTGGGAAACTGCCTGATGGAGGGGGATAACTACTGGAAACGGTAGCTAATACCGCATAACGTCGCAAGACCAAAG AGGGGGACCTTCGGGCCTCTTGCCATCAGATGTGCCCAGATGGGATTAGCTAGTAGGTGGGGTAATGGCTCACCTAGGCG ACGATCCCTAGCTGGTCTGAGAGGATGACCAGCCACACTGGAACTGAGACACGGTCCAGACTCCTACGGGAGGCAGCAGT GGGGAATATTGCACAATGGGCGCAAGCCTGATGCAGCCATGCCGCGTGTATGAAGAAGGCCTTCGGGTTGTAAAGTACTT TCAGCGGGGAGGAAGGTGTTGTGGTTAATAACCGCAGCAATTGACGTTACCCGCANAANAAGCACCGGCTAACTCCGTGC CAGCANCCGCGGTAATACGGANGGTGCAAGCGTTAATCGGNAATTACTGGGCGTAAAAGCGCACGCAGGCGGTCTGTCAA GTCGGATGTGAAANTCCCCCGGGCTCAACCTGGGAACTG
MB44 (16s Sequence from Agar Plate with Nutrient and Tetracycline 10^-3): NNNNNNNNNNNNNNNNCNNNNNNNNGACAGCCGAGCGGTAGAGATCTTTCGGGATCTTGAGAGCGNGCGNTACGGGTGCG GANCNNNTGTGCAACCTGCCTTTATCAGGGGGATAGCCTTTCGAAAGGAAGATTAATACCCCATAATATATTGAATGGCA TCATTTGATATTGAAAACTCCGGTGGATAGAGATGGGCACGCGCAAGATTAGATAGTTGGTAGGGTAACGGCCTACCAAG TCAGTGATCTTTAGGGGGCCTGAGAGGGTGATCCCCCACACTGGTACTGAGACACGGACCAGACTCCTACGGGAGGCAGC AGTGAGGAATATTGGACAATGGGTGAGAGCCTGATCCAGCCATCCCGCGTGAAGGACGACGGCCCTATGGGTTGTAAACT TCTTTTGTATAGGGATAAACCTTTCCACGTGTGGAAAGCTGAAGGTACTATACGAATAAGCACCGGCTAACTCCGTGCCA GCAGCCGCGGTAATACGGAGGGTGCAAGCGTTATCCGGATTTATTGGGTTTAAAGGGTCCGTAGGCGGATCTGTAAGTCA GTGGTGAAATCTCATAGCTTAACTATGAAACTGCCATTGATACTGCAGGTCTTGAGTAAANGTANAAGTGGCTGGAATAA GTANTGTANCGGTGAAATGCATAGATATTACTTANAACACCNATTGCGANNCAGGTCACTATGNTTTAACTGACGCTGAT GGACGAAAGCGTGGGGAGCGAACNGGATTANATACCCTGGGTAGTCCACGCCGTAAACNATGCTAACTCGTTTTTGGNCT TTAGGGTTCAGANACTAAACNAAAGTGATNAGTTAAGCCNCCTGGGGANTACGTTCGCAAGAATGAAACTCANAGGAATT GAACGGGGGCCCGCACACCGGGGGATTATGTGGTTTANTNNNATNANTCNCANGGAACCNTACCANGCTAAATGGGNATT GANGGGTNNNNANTAGACTTTCTTCNANNNTTTCAANGNNCTNCATGGGTGGNNGNGNGCTNNNGCNNNNAAGNNNNNNN N
MB43 Species ID: Enterobacteriaceae Bacterium S2A 16s ribosomal RNA gene, 97% match MB44 Species ID: uncultured bacterium clone, 95% match
PCR of 16S Sequence Run on Agarose Gel #1
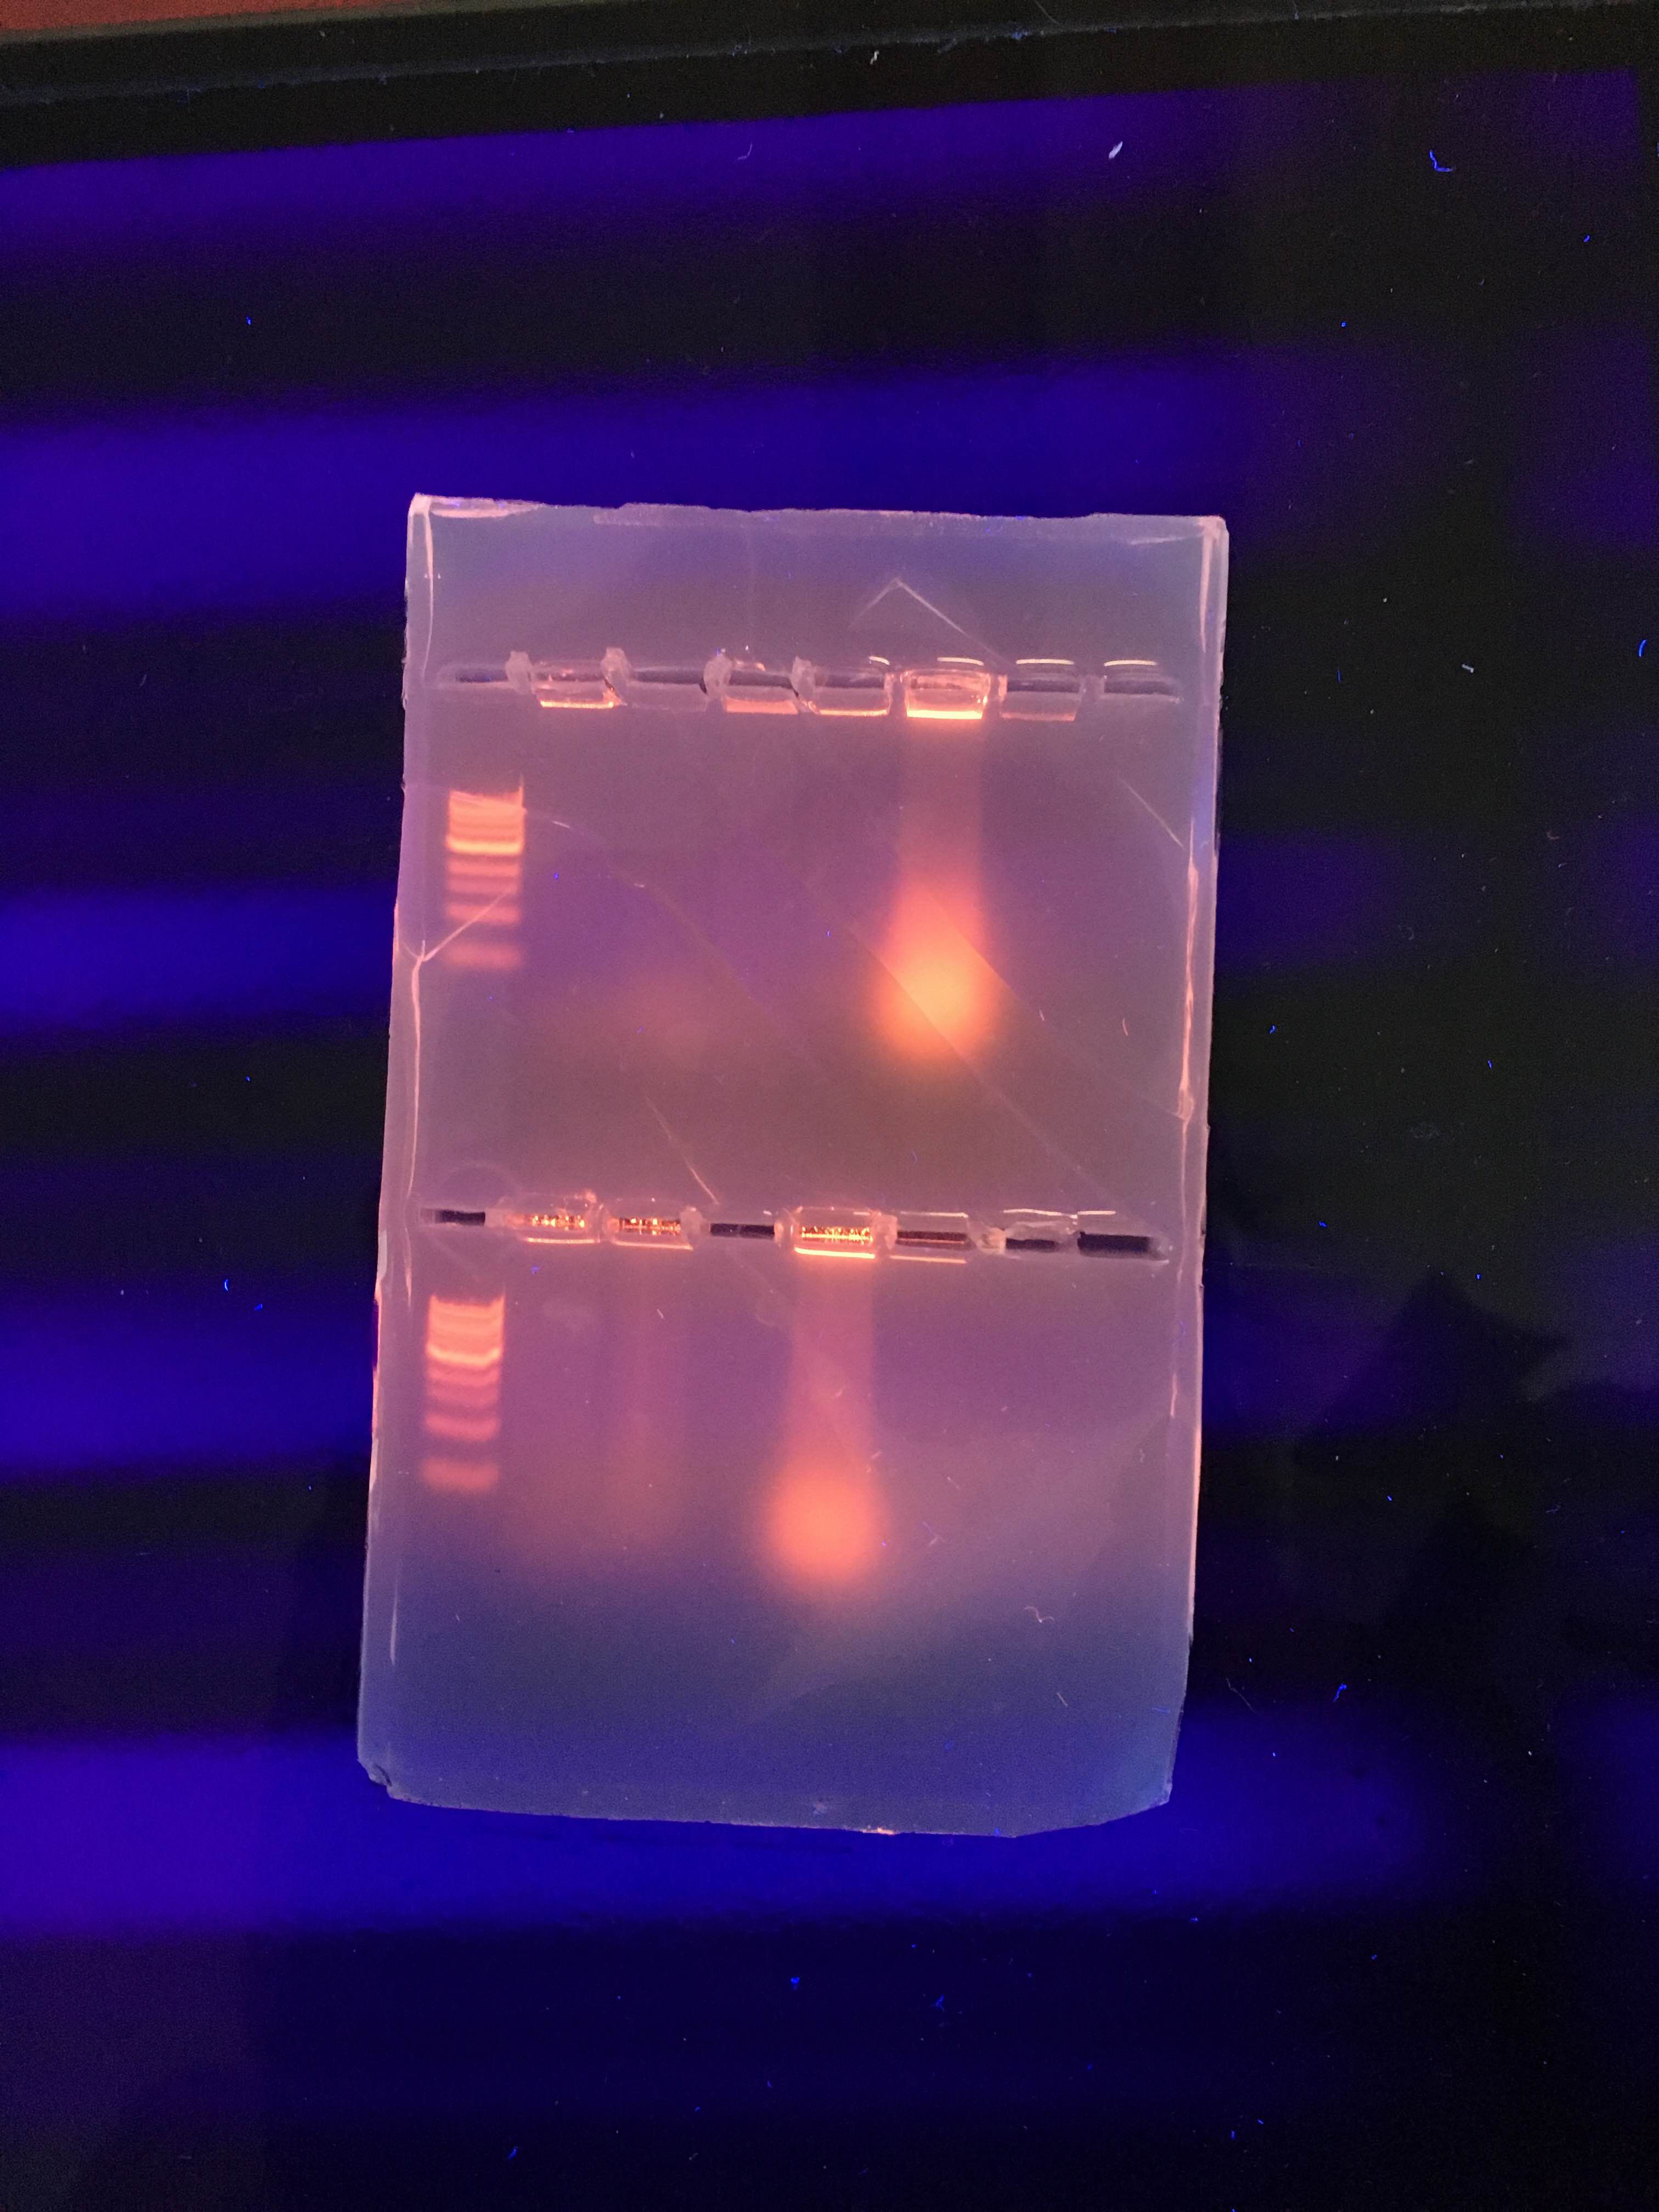
PCR of 16S Sequence Run of Agarose Gel #2
Gel with PCR Samples
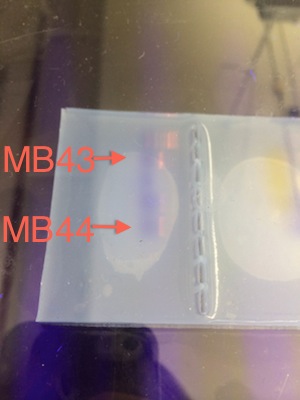 Fig. 36. Picture of agarose gel with the PCR samples taken from CJ's notebook.
Conclusions & Future Directions: Since the gel did not work for other lab sections, it is unlikely that our lack of results came from any mistakes that we personally made. In the future, we should look to determine exactly what happened that caused our gels to run incorrectly so this can be accounted for and fixed.
-AL
February 23, 2016
Purpose: The purpose of this lab was to observe the invertebrates from the Berlese funnel that had previously been constructed using matter from our transect and to identify the invertebrates through the use of a dichotomous key.
Materials & Methods: Analysis of Invertebrates procedure: Deconstruct the Berlese funnel and decant the top 10-15 mL of liquid, comprised of ethanol and organisms, into a petri dish. Pour the remaining liquid into a separate petri dish. Use a dissecting microscope to observe the invertebrates present in the different petri dishes and identify and characterize them using a dichotomous key.
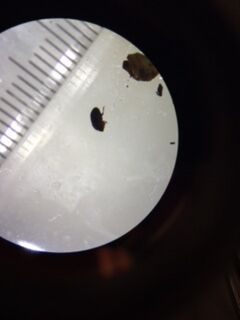
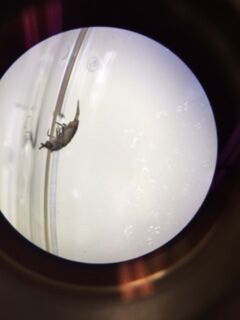
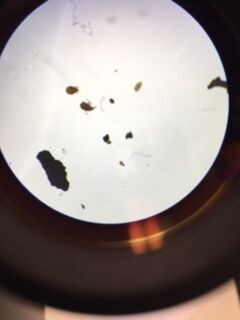
Data & Observations: We were able to find three different types of invertebrates from our transect. From the petri dish with the liquid from the bottom of the funnel (fig. 34) we found Coleoptera, commonly known as a beetle, (fig. 35) which belongs to the phylum Arthropoda and the class Insecta. Its size was approximately 5 units at 0.8 magnification and there were 2 present. Beetles are small and compact with hard shells and wings. We also found Anoplura, commonly known as a sucking louse (fig. 36), which belongs to the phylum Arthropoda and the class Insecta. The sucking louse have flat bodies, and oval heads with antennae. It's most notable feature is the sharp proboscis, an external appendage used for feeding or sucking. Its size was approximately 4 units at 0.8 magnification. From the petri dish with the liquid from the top of the funnel (fig. 37) we found 6 Anoplura and 7 Aphidoidea, commonly known as aphids. They belong to the phylum Arthropoda and the class Insecta. They are small, light green, and have antennae and measure about .5 units under 1.5 magnification. While there was some overlap in organisms, there does appear to be a difference in the organisms found in the top half versus the bottom half of the Berlese funnel, though the majority of the organisms that populate leaf litter appear to be from the phylum Arthropoda and the class Insecta. Some vertebrates that would possibly be inhabiting our transect are mammals (deer, raccoons, and squirrels), birds (Sparrows, Robins). Deers belong the phylum Chordae, the class Mammalia, the order Artiodactyla, the genus Cervidae, and the species Odocoileinae. Raccoons belong to the phylum Chordata, the class Mammalia, the order Carnivora, the family Procyonidea, the genus Procyon, and the species P. Iotor. Squirrels belong to the phylum Chordata, the class Mammalia, the order Rodentia, the suborder Sciuromorpha, and the family Sciuridae. Sparrows belong to the phylum Chordata, the class Aves, the order Passeriformes, the suborder Passeri, and the family Passeridae. Finally, robins belong to the phylum Chordata, the class Aves, the order Passeriformes, the family Turdidae, the genus Turdus, and the species T. Migratorius.
Petri Dish with Invertebrates from Bottom Layer
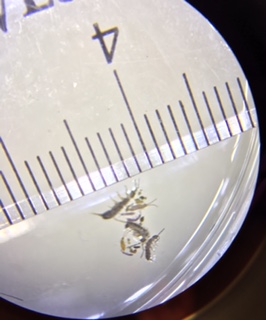 Fig. 34. A picture showing the invertebrates found in the bottom later of the Berlese funnel. Shown under a dissecting microscope at 0.8x.
Coleoptera -- Beetle
Anoplura -- Sucking Louse
Petri Dish with Invertebrates from the Top Layer
Conclusions & Future Directions: From this lab, it is evident that transect 1 is home to a variety of different organisms, many of which we have not been able to observe (for many different reasons).
-AL
February 17, 2016
Purpose: The purpose of this lab was to observe different plant types within our transects and to identify the different reproductive structures present within those samples through the use of a dissecting microscope.
Materials & Methods: Plant collection procedure: From the transect, obtain a minimum sample of 500 g of leaf litter and obtain (non-invasively) samples of five different plants.
Identification of structures procedure: Make cross sections of the 5 plants obtained from the transect and observe them under the microscope to identify the different reproductive structures as well as any other structures specific to the plant necessary for its survival.
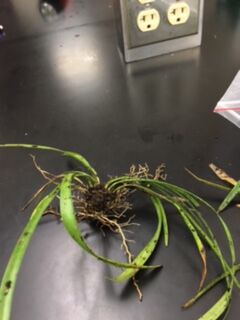
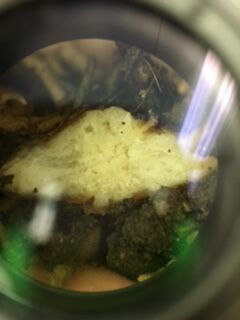
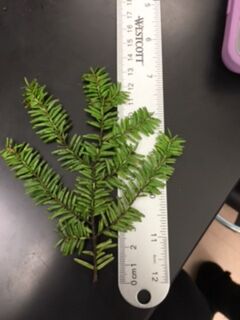
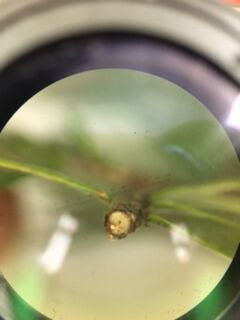
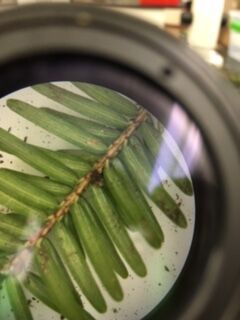
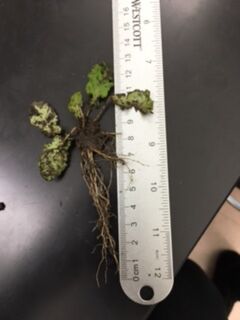
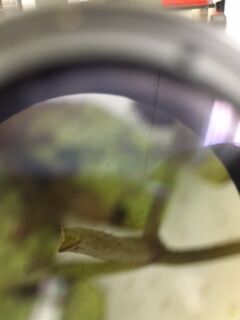
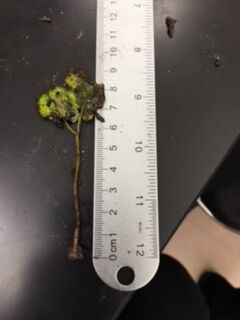
Data & Observations: The first plant we found in our transect (fig. 24) measures approximately 31 cm in length and has long, thin leaves. It has a fibrous root system and its vascular bundles, seen clearly in the cross section (fig. 25) appear to be complexly arranged. The second plant we found in our transect (fig. 26) measures approximately 13.3 cm in length and has branches with small leaves, which can be seen in detail in figure 28. The cross section (fig. 27) shows that it has vascular bundles arranged in a ring. The third plant we found in our transect (fig. 29) measures approximately 13 cm in length and has wide leaves with rigid edges and a taproot system. The fourth plant we found in our transect (fig. 30) measures approximately 9.6 cm in length and is a continuous leaf with pointed edges. A cross section of the bottom of the stem can be seen in figure 31. The fifth plant we found in our transect measures approximately 9.1 cm and has a long stem that eventually branches off into round leaves. A cross section of the stem (fig. 32) shows a triangular shape. No seeds were obtained from the transect. The fungi sporangia are small, black, globelike structures that hold spores which are released when the sporangia open. The only fungus that was obtained from the transect was identified as Tremella folicea, a gelatinous mass of leaf-like flattened lobes that are brown in color (http://www.mushroomexpert.com/tremella_foliacea.html).
Plant 1
Plant 1 Cross Section
Plant 2
Plant 2 Cross Section
Plant 2 Leaves
Plant 3
Plant 4

Plant 4 Cross Section
Plant 5
Plant 5 Cross Section

Conclusions & Future Directions: From the data obtained from the transect, it is reasonable to say that there are many different species of plants and fungi that inhabit transect 1. In the future, it may be helpful to take more precise measurements when using a microscope.
-AL
February 10, 2016
Purpose: The purpose of this lab was to quantify, observe, and identify the bacteria present in the Hay infusion through morphological characteristics, motility, and a gram stain.
Materials & Methods: Wet Mount Procedure: The Agar plates (both normal and Tet+) were inspected for the presence of bacterial colonies. Once a colony had been located, a small sample was removed using a sterilized loop and was placed on a microscope slide. A small drop of water was added to the slide and was mixed with the bacterial sample. The wet mount was then observed using a compound microscope to find and identify any bacteria present. This process was repeated until four microorganism samples (two from the normal Agar plates and two from the Tet+ plates) were observed.
Gram Stain Procedure: Another sample was taken from the same bacterial colonies used for identification of microorganisms using a sterilized loop. The bacterial sample was mixed with a drop of water on a microscope slide and the area underneath the sample was circled with a wax pencil. Once the slide had dried, it was passed, bacterial side facing upward, through a flame three times. The bacterial smear was then covered with crystal violet dye for one minute; the dye was washed off with water after a minute had passed. The bacterial smear was then covered with Gram's iodine solution for one minute and the solution was washed off with water after the minute. The bacterial smear was then decolorized by flooding it with a solution of 95% alcohol for approximately 10-20 seconds. A safranin stain was used to cover the smear for approximately 20-30 seconds and then the smear was rinsed with water. After the slide was given time to air dry, it was observed under a compound microscope to determine whether it was gram positive (retained the dye; blue color) or gram negative (did not retain the dye; pink color).
PCR Procedure: Of the two normal Agar plates and the two Tet+ Agar plates that bacteria was taken from, one of each type was selected. Two PCR tubes were obtained and each was filled with 20 μL of a primer/water mixture and then the tube was mixed until the PCR bead dissolved. A small sample of the same bacterial colony previously used was taken from the Agar plate and placed into the corresponding PCR tube -- this was done twice, once for each of the two samples being tested. The tubes were then placed into the PCR machine.
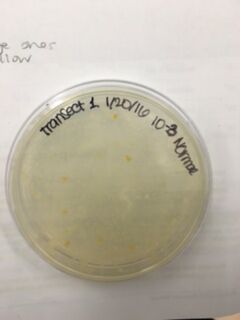
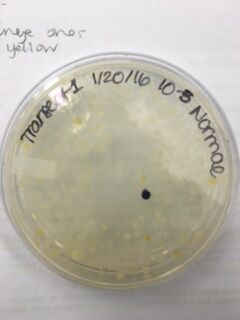
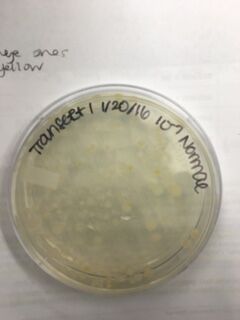
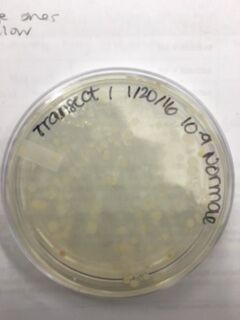
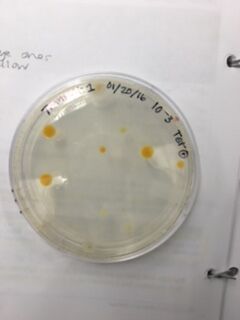
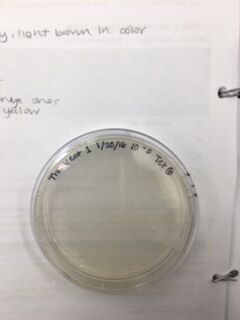
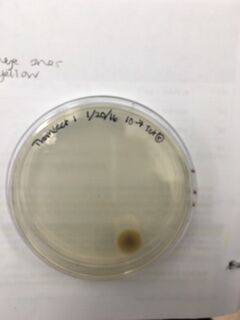
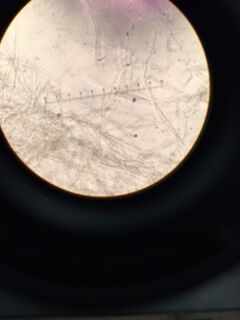
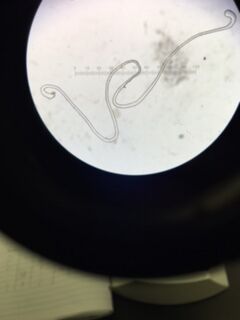
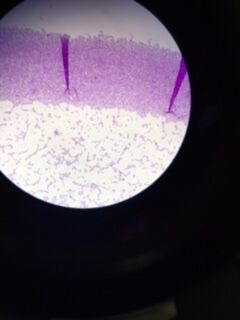
Data & Observations: It is evident from table 1 that there was a difference in number of colonies counted between the nutrient Agar plates and the nutrient and Tet+ plates: the nutrient plates showed significantly more colonies than the Tet+ plates. With the exception of the 10^-3 Tet+ plate, the other Tet+ plates contained only one colony. This indicates that Tetracycline is effective at neutralizing bacteria; in fact, only 21 different species were unaffected by the tetracycline and able to grow on the plates. Tetracycline works by inhibiting protein synthesis by "preventing the attachment of aminoacyl-tRNA to the ribosomal acceptor (A) site"(Chopra et al 232). Tetracycline is effective against both gram positive and gram negative bacteria as well as "atypical organisms such as chlamydiae, mycoplasmas, and rickettsiae, and protozoan parasites"(Chopra et al 232). My group had difficulty finding bacteria, so only two, rather than four, observations were made. One was from the Tet+ 10^-3 plate and the other was from the Tet+ 10^-7 plate. The colony observed from the Tet+ 10^-3 plate was circular with a curled edge, a smooth and glistening surface, and a convex elevation; it was approximately 1 cm in diameter and a mustard yellow color (see fig. 16). It's cells were non-motile, spirochete, and layered on top of one another with a few separated from the others (see fig. 20). The colony observed from the Tet+ 10^-7 plate was circular with an entire edge, a dry and powdery surface, and had a slightly raised elevation; it was approximately 3 cm in diameter and a tan/brown color (see fig. 18). There was a single organism which was non-motile, filamentous, and curled slightly around itself (fig. 21). The gram staining procedure did not yield conclusive results for our bacterial samples; however, pictures of gram positive and gram negative stains were taken from another group (see fig. 22 and 23, respectively).
Conclusions & Future Directions: Since we had so much trouble finding bacteria from our samples, I think it's important to ensure that when we go back to the transect we try and obtain a wide variety of samples so that any lack of microorganisms cannot be attributed to error on our part. Nevertheless, it appears that Transect 1 does not have many microorganisms currently living in it (though that could be a result of the recent weather).
100-fold Serial Dilution Results
 Table 1. Chart showing the type of Agar plate used and how many bacterial colonies were identified on those specific plates, and the conversion used to determine the number of colonies/mL
Normal 10^-3 Plate
Normal 10^5 Plate
Normal 10^-7 Plate
Normal 10^-9 Plate
Tet+ 10^-3 Plate
Tet+ 10^-5 Plate
Tet+ 10^-7 Plate
Tet+ 10^-9 Plate

Tet+ 10^-3 Bacterial Cells
Tet+ 10^-7 Bacterial Cells
Gram Positive Stain
Gram Negative Stain
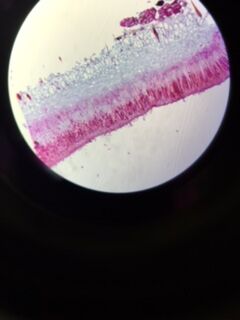
Works Cited: Chopra, I., & Roberts, M. (2001). Tetracycline antibiotics: mode of action, applications, molecular biology, and epidemiology of bacterial resistance. Microbiology and molecular biology reviews, 65(2), 232-260.
-AL
January 20, 2016
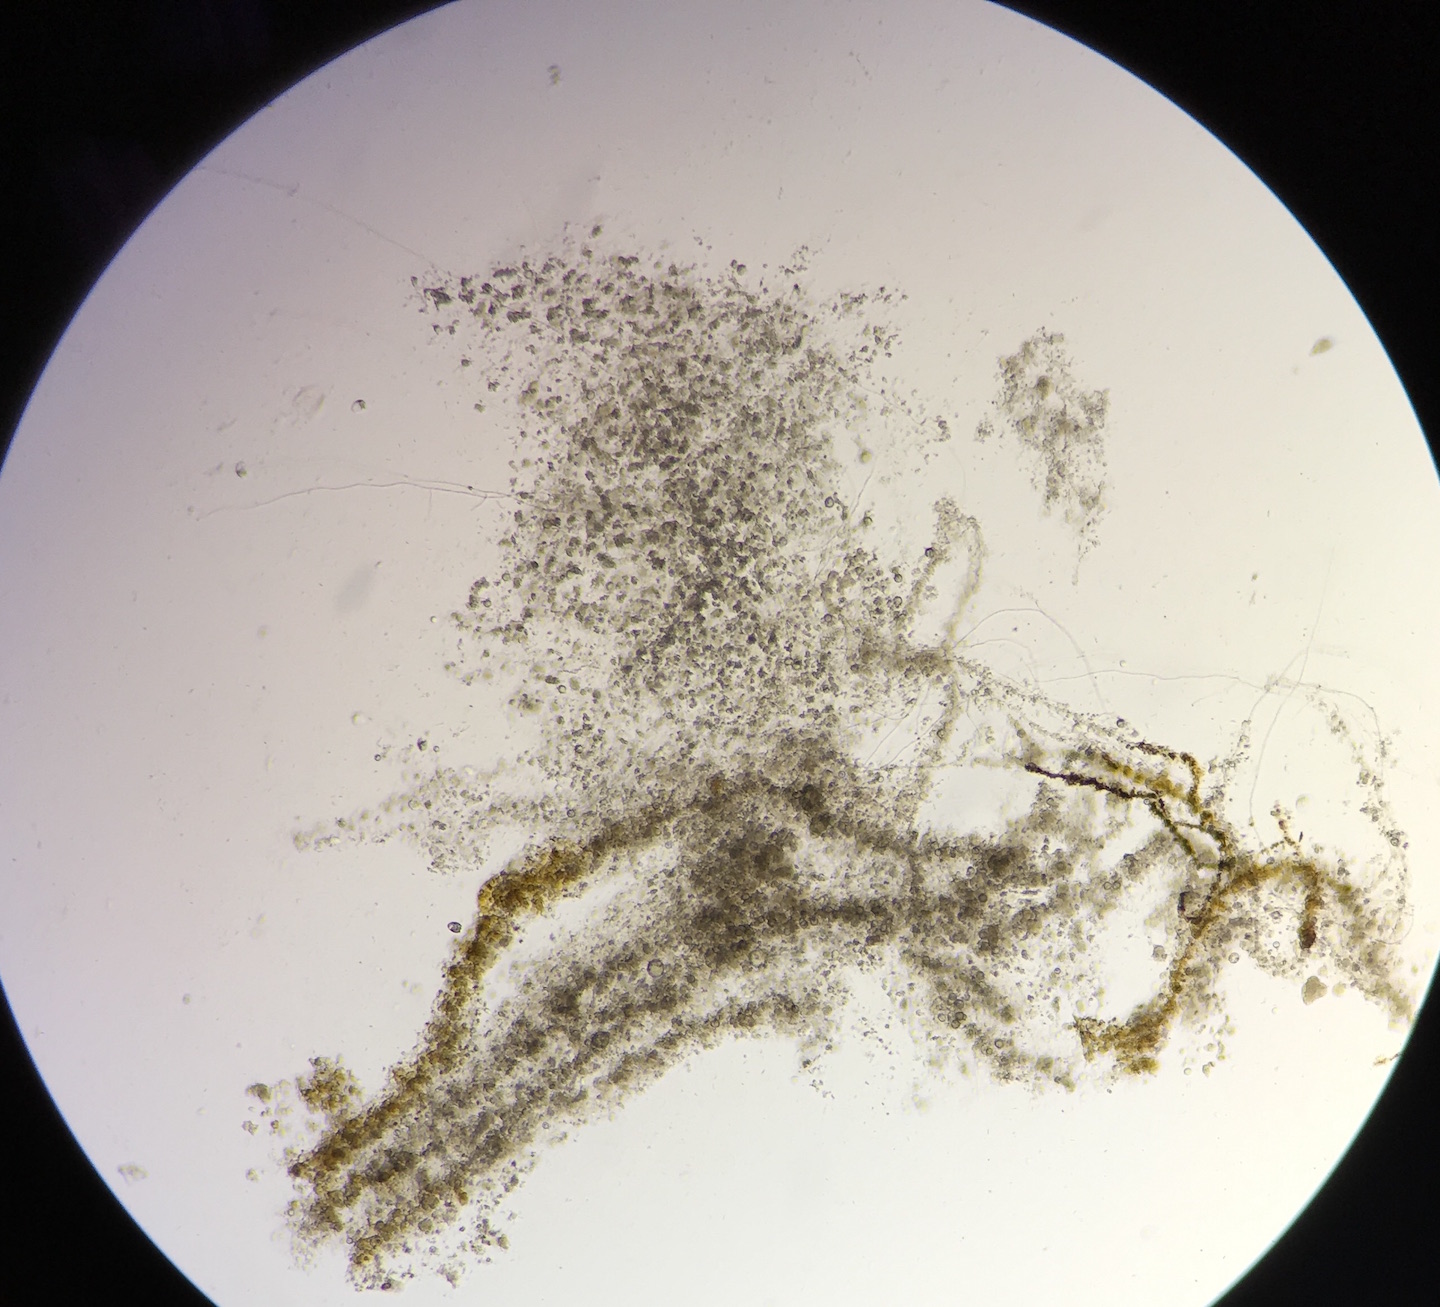
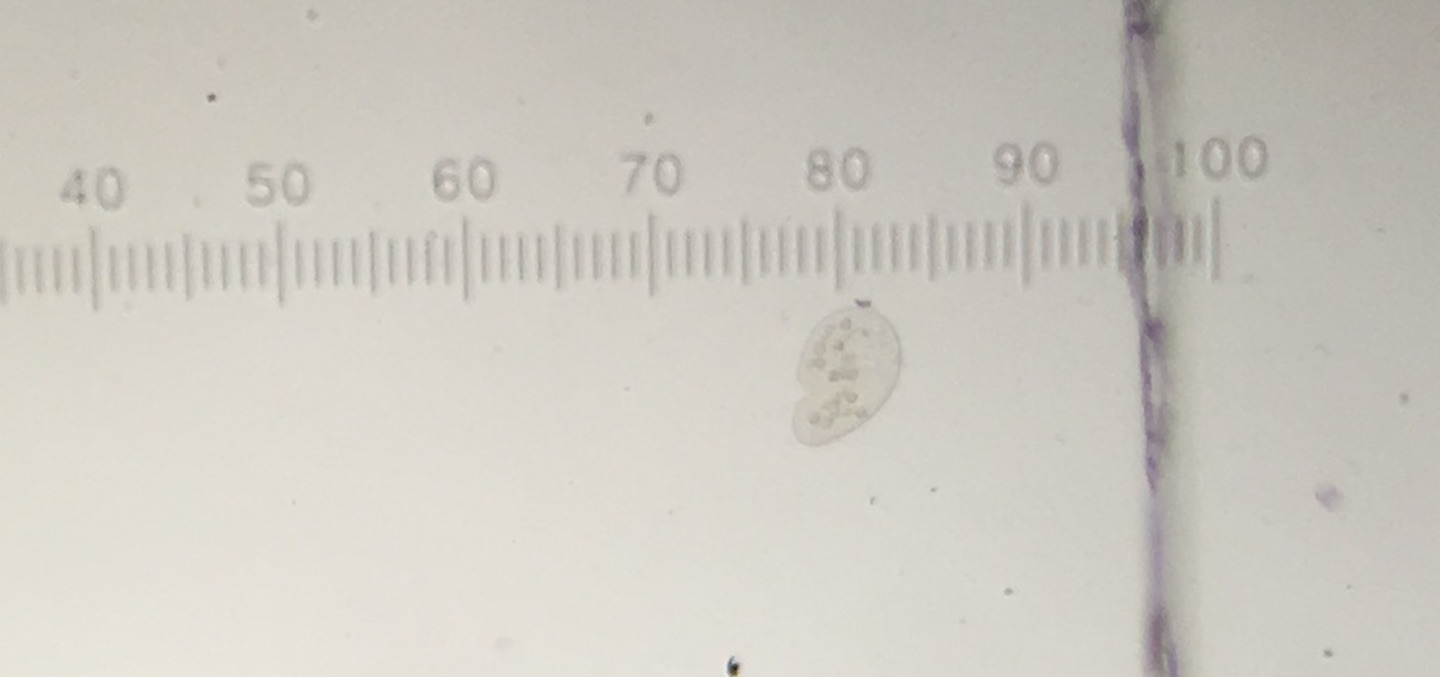
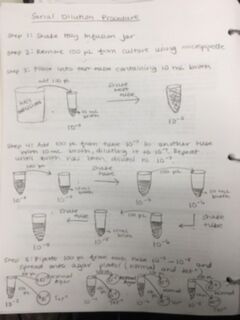
The Hay Infusion was made by placing approximately 12 grams of the transect sample (made up of 50% soil and 50% plant matter) in a plastic jar along with 500 mLs of Deerpark water and 0.1 g of dried milk. The lid was placed on the jar and it was shaken to mix the contents. After mixing, the lid was removed from the jar and it was set aside for seven days. A week later, the hay infusion was examined for the presence of protists. Initially, the foul smell was the first thing noticed. While there was no mold or green shoots seen on top of the liquid, there was a a clear film on the top of the mixture (see fig. 5). The lid was placed on the jar and it was thoroughly mixed and then samples were taken from the top, middle, and bottom of the jar (see fig. 6 and 7, respectively). From the top layer of the hay infusion we found algae that we identified as Oedogonium (see fig. 8). The Oedogonium was identified through being autotrophic, non-motile, having a grass-green color with the pigment contained in its chloroplasts, and having chloroplasts that form a network that extends from both ends of each cell. It's approximate size is 160 μM. From the middle layer, we found protozoa that we identified as Colpidium (see fig. 9). It was identified as such through its characteristics of being heterotrophic, colorless, motion by means other than sliding or floating, having cilia that covered the entirety of its body, and having a small (approximately 15 μM) oval shaped body with a small mouth. We were unable to locate any protists in the bottom layer of our hay infusion so we looked at an organism found by a different group from the top layer of their hay infusion. The protozoa found was identified as Peranema through its physical characteristics of being a heterotrophic, single colorless cell that moves by means other than sliding or floating through the use of a single flagella and appears to be vibrating while in motion yet appears to be plastic while stationary (see fig. 10). It is approximately 38 μM in size. All of the identifications of the protozoa were made using Ward's Free-Living Protozoa dichotomous key and the identification of algae was made using a dichotomous key from Connecticut Valley Biological Supply Company. The different protists found in each layer may be related to their location to plant matter (i.e. close to or far away from) depending on if they are autotrophs or heterotrophs. If the Hay Infusion culture was allowed to "grow" for another two months, I would expect to see many more organisms present assuming that all of the requirements necessary for the organisms to thrive were met. Some selective pressures that may decrease the survival ability of the organisms would be lack of space since the jar that was used for the Hay Infusion wasn't overly large, and access to sunlight (for the autotrophs) since the hay infusion is kept indoors. To determine the bacteria present in the Hay Infusion, a serial dilution of a sample taken from the infusion was performed and then the dilutions were placed onto agar plates for further investigation next week (see fig. 11 for diagram of this process).
Hay Infusion Top View
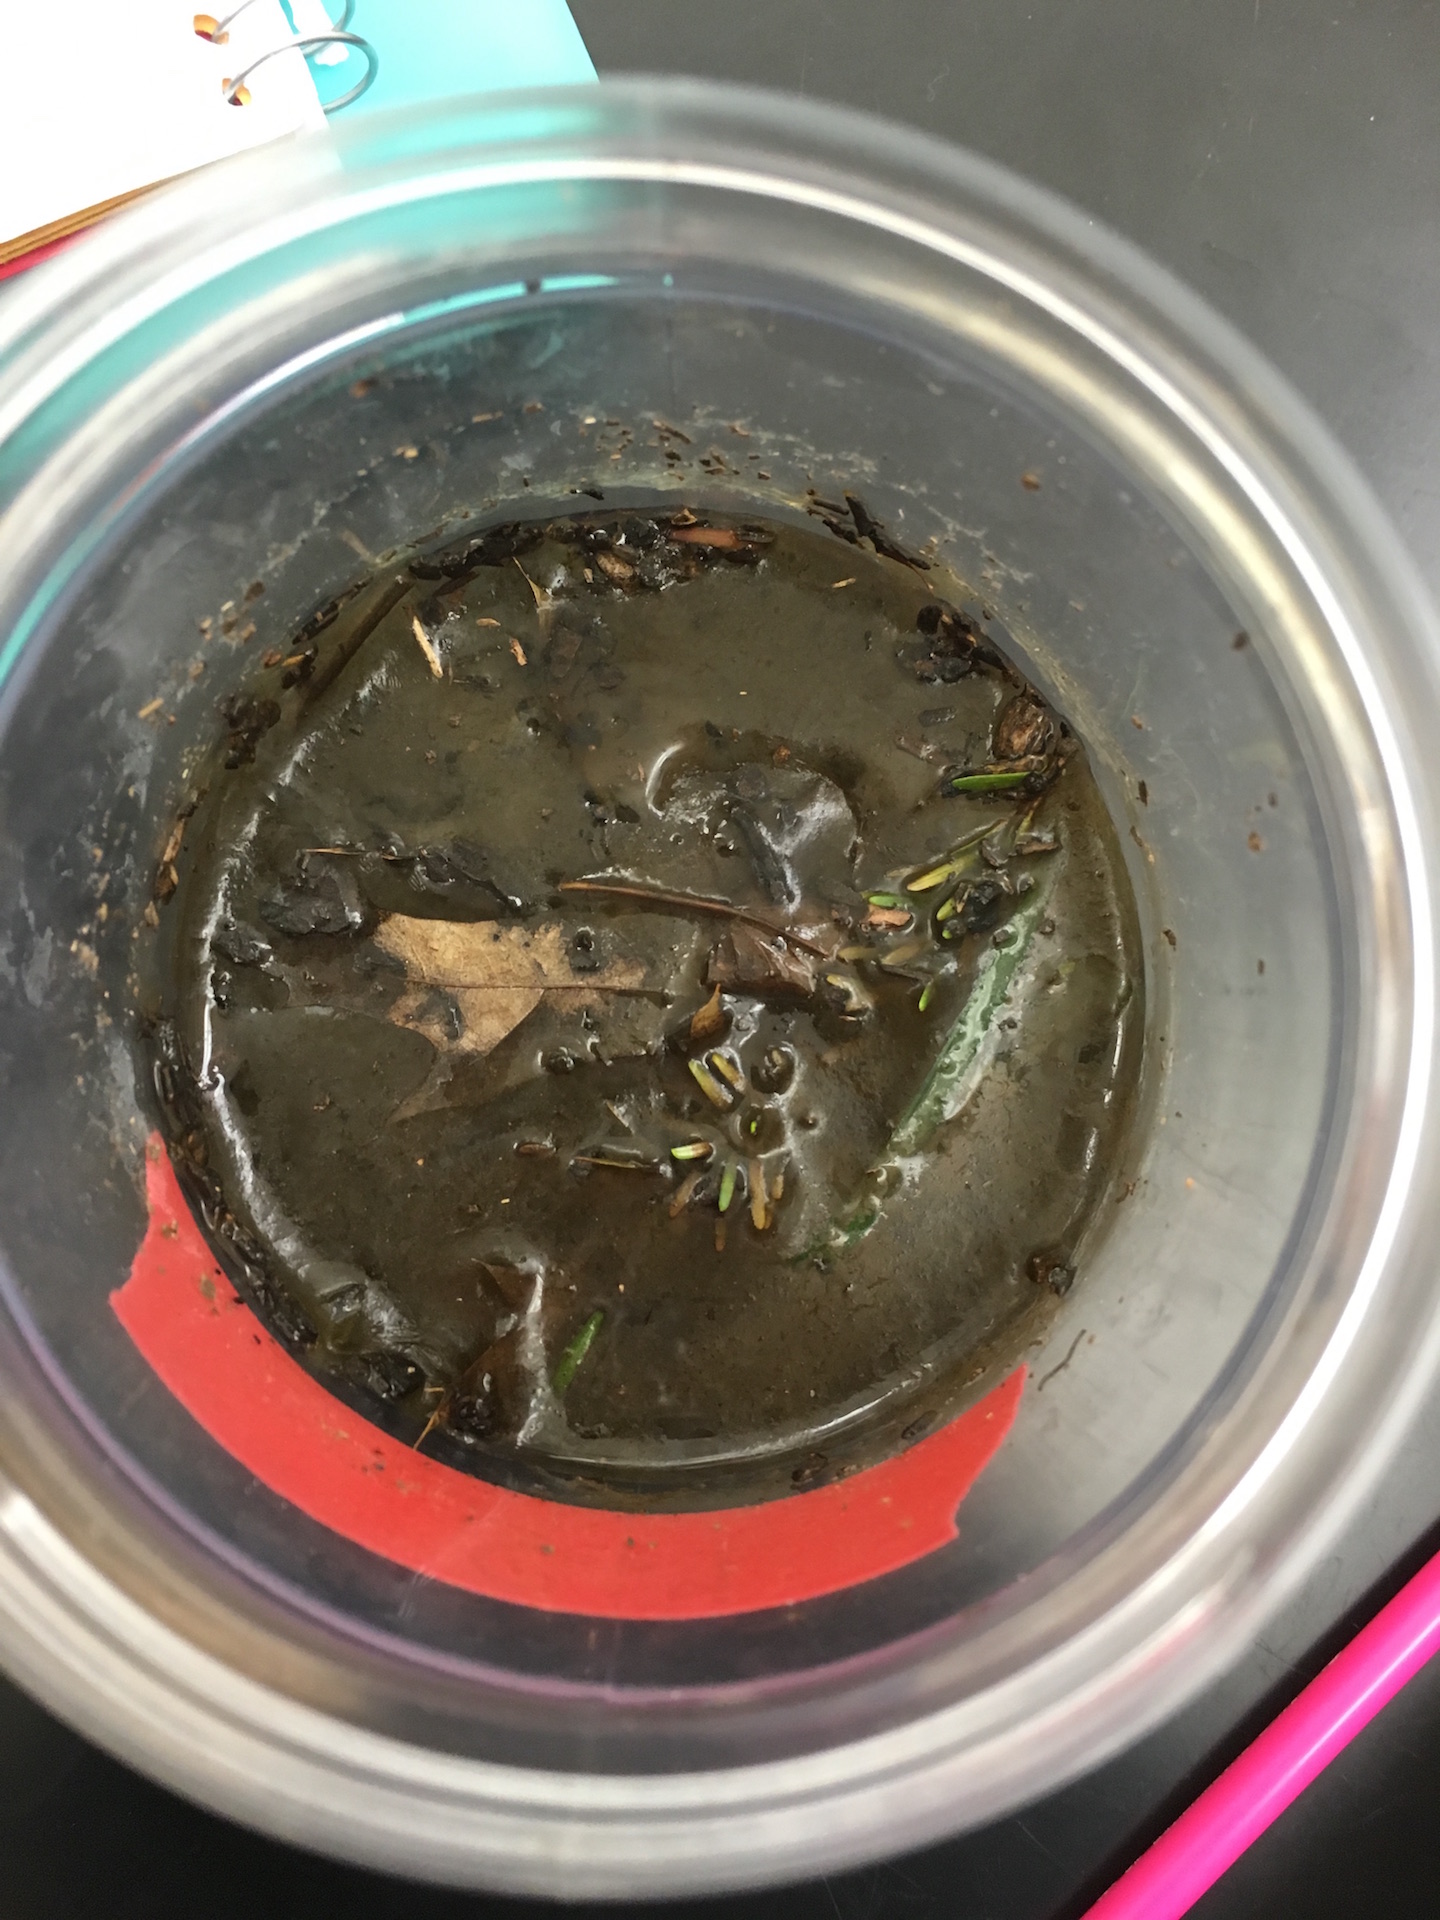
Hay Infusion Middle View
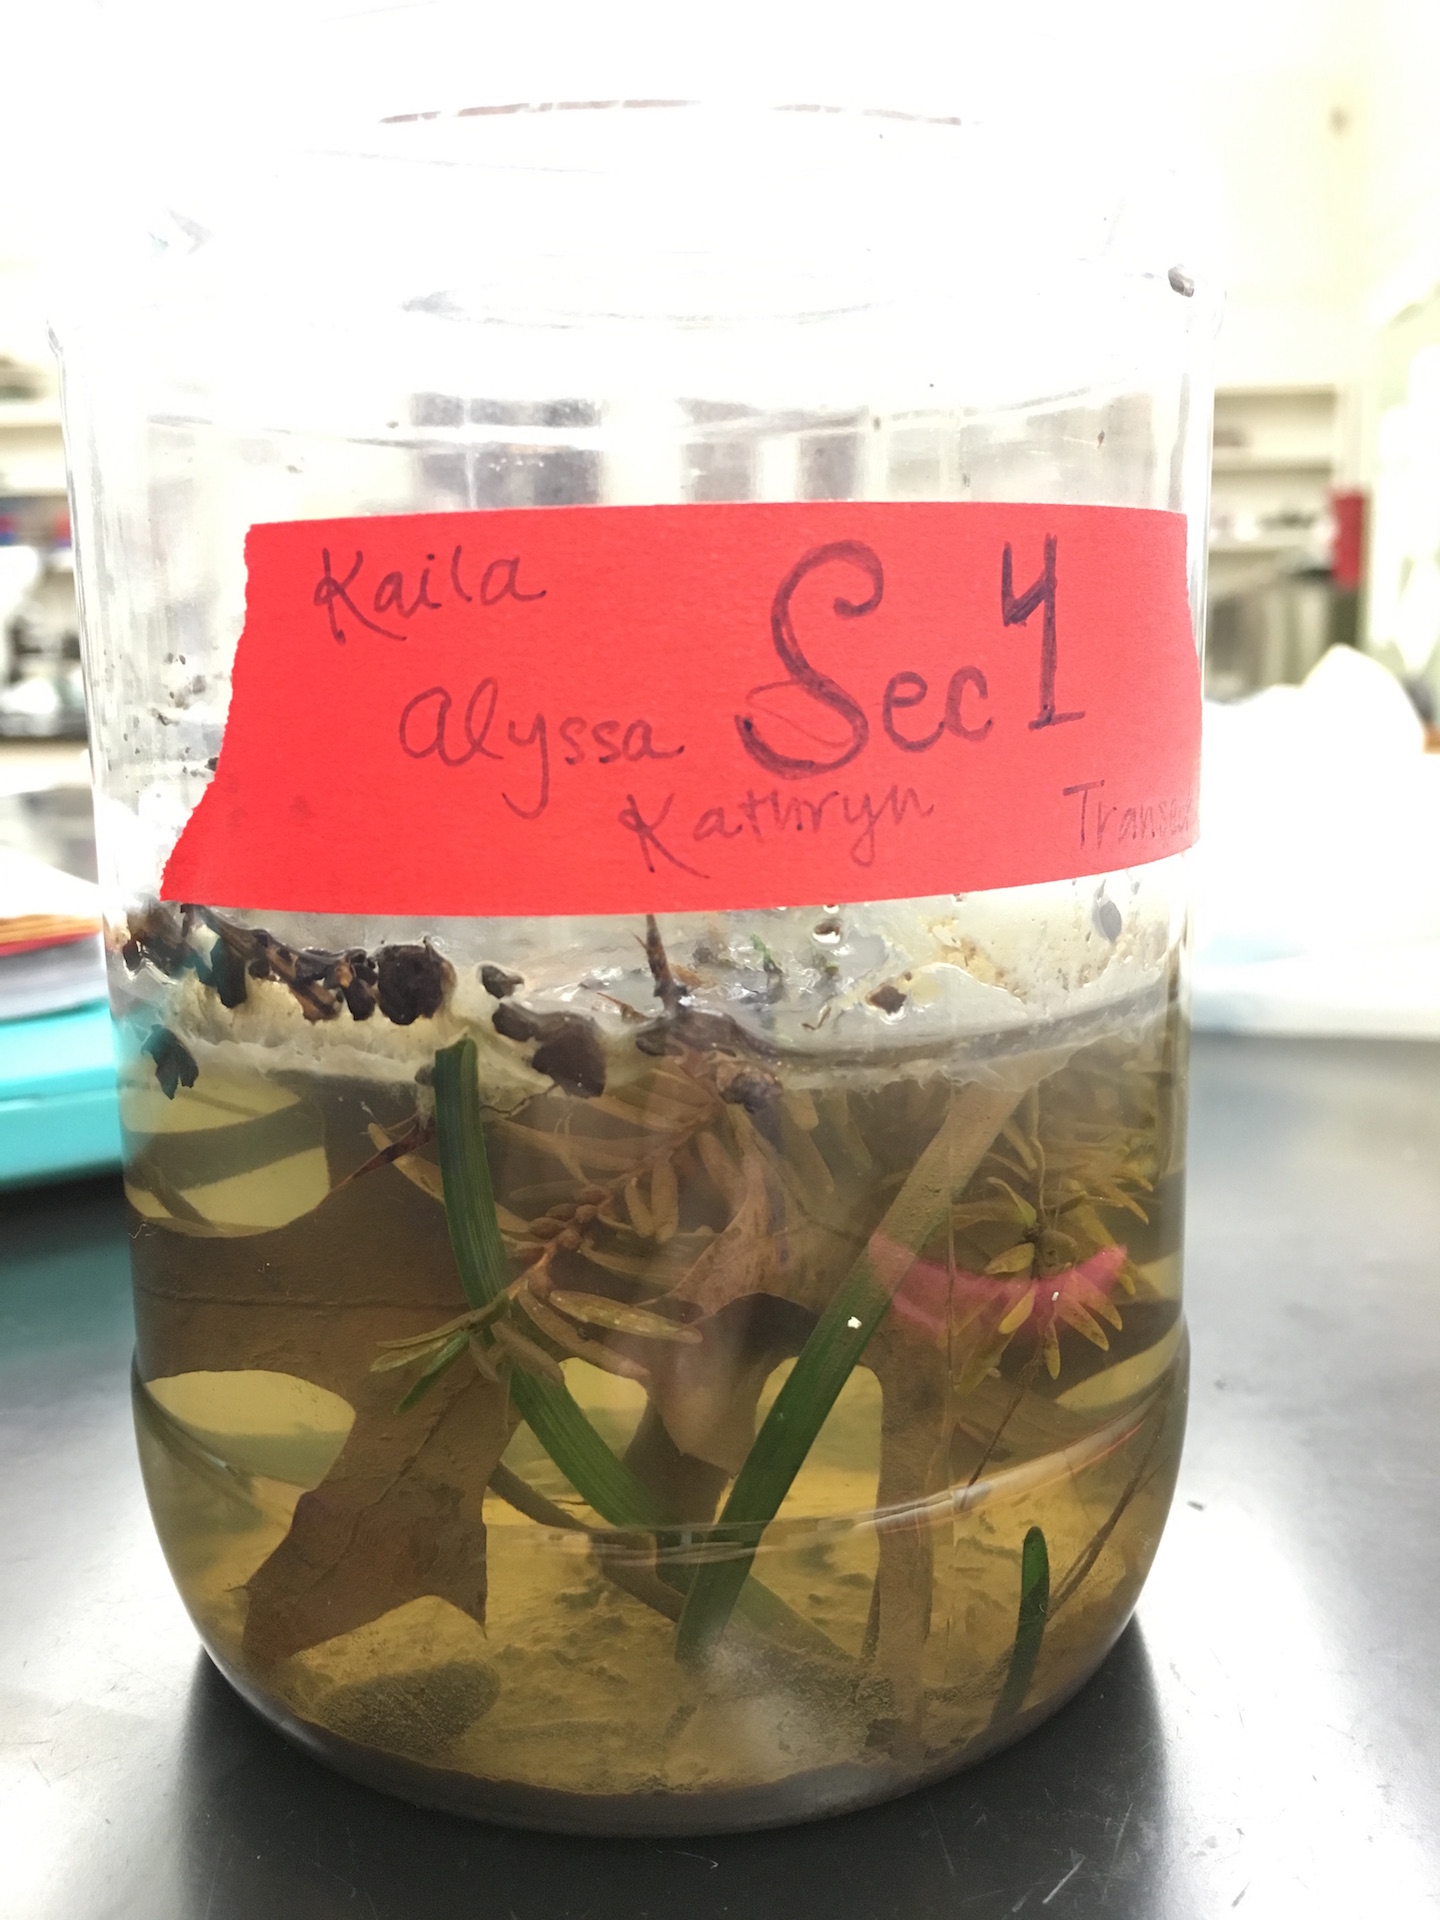
Hay Infusion Bottom View
Oedogonium Under Microscope
Colpidium Under Microscope
Peranema Under Microscope

Serial Dilution Process
-AL
January 13, 2016
Transect 1: Biotic Factors -- trees, plants, animals (squirrels and chipmunks); all seen on the ground/growing from the ground Abiotic Factors -- wind, sunlight, rocks, temperature, soil; the rocks and soil were found on the ground
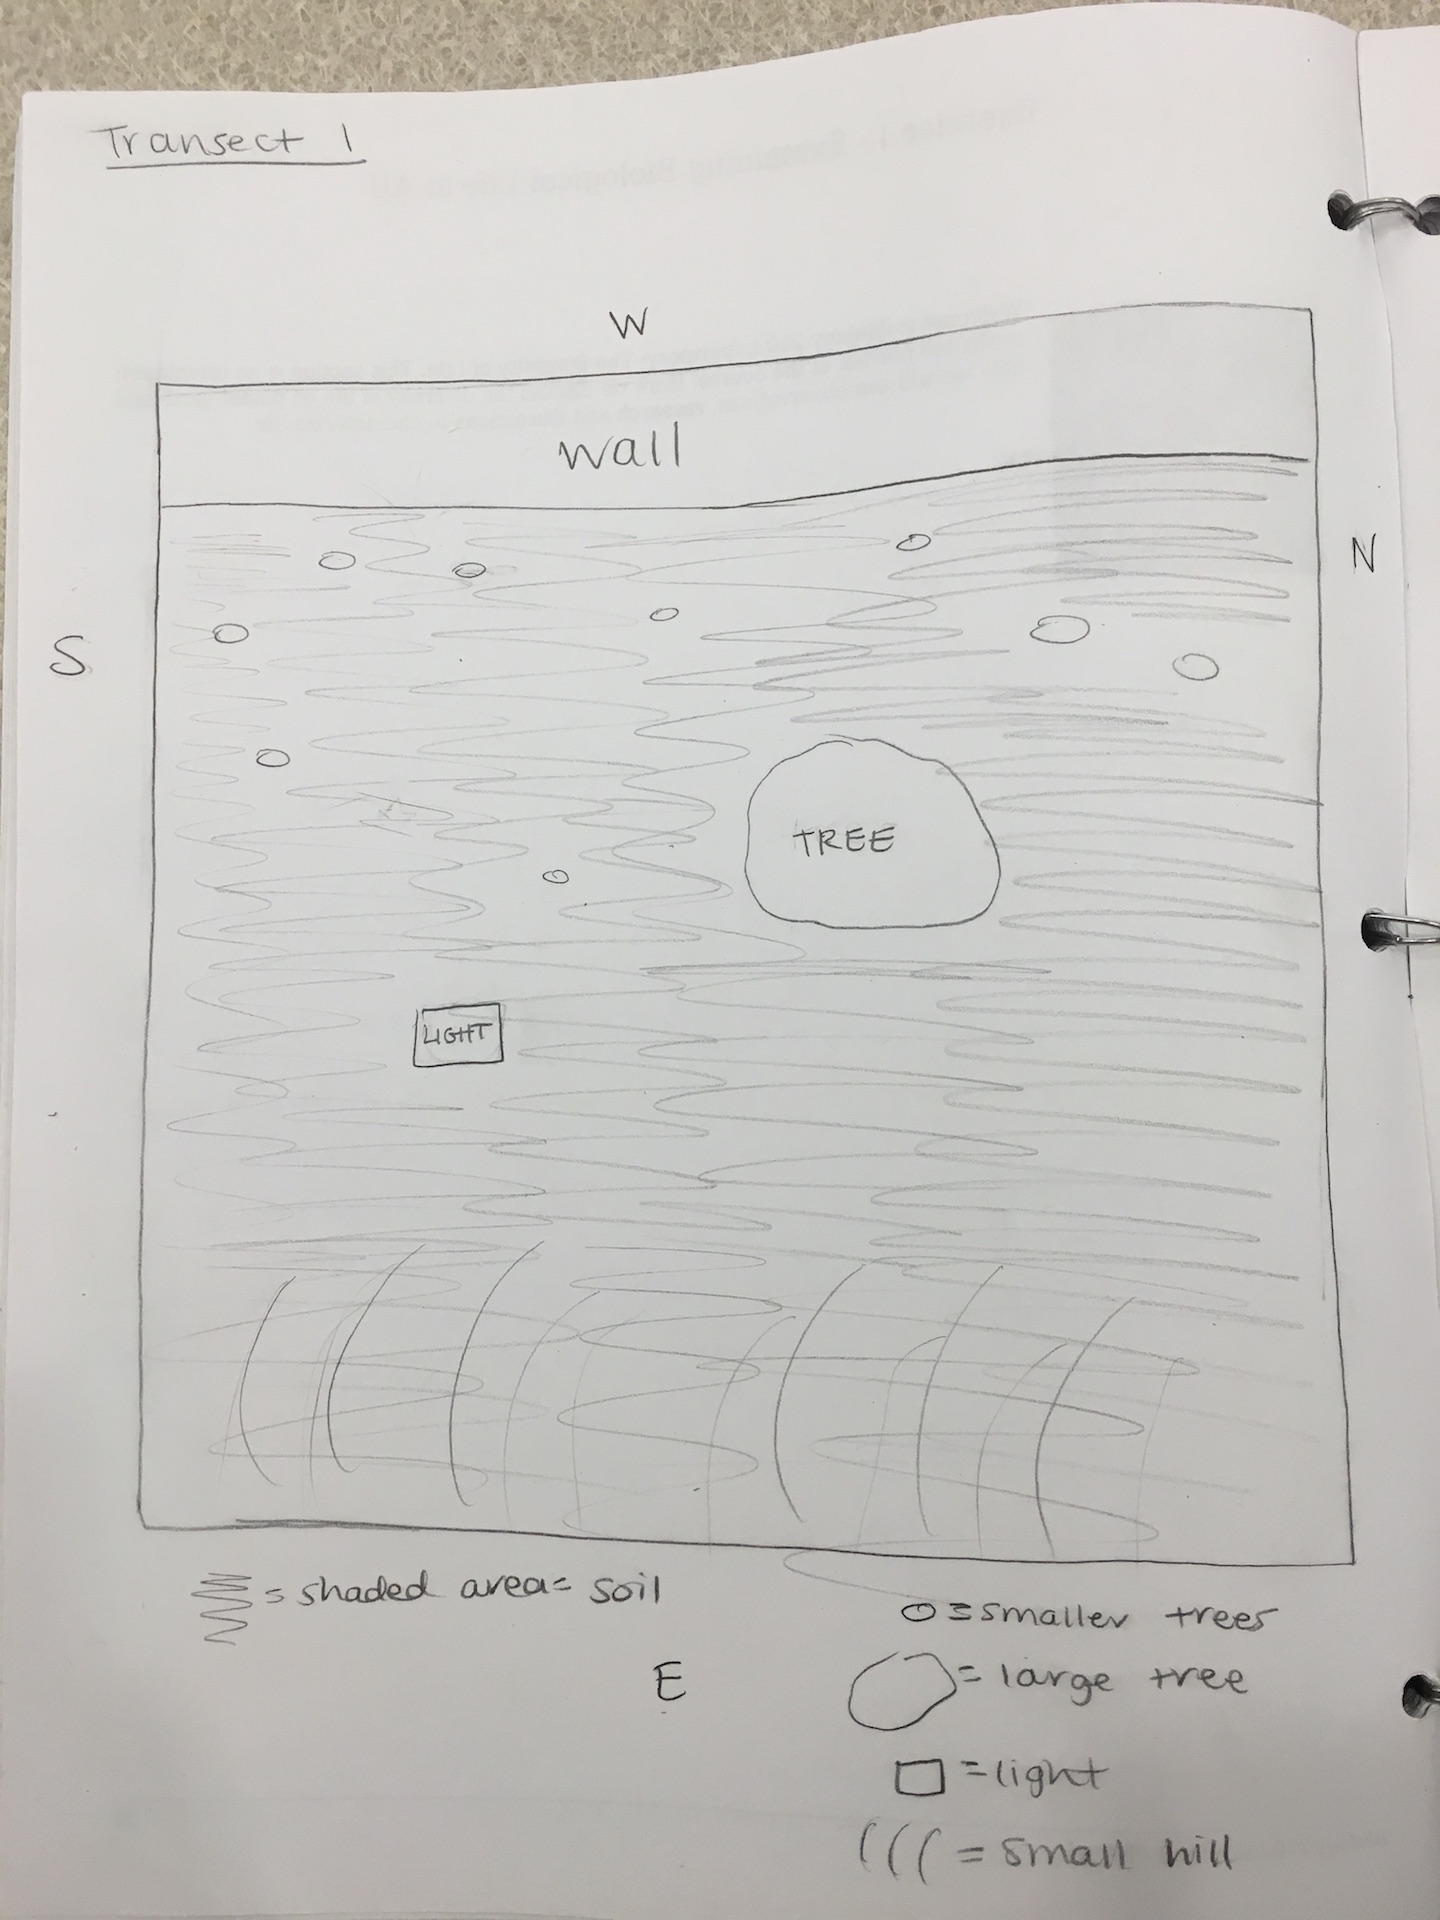
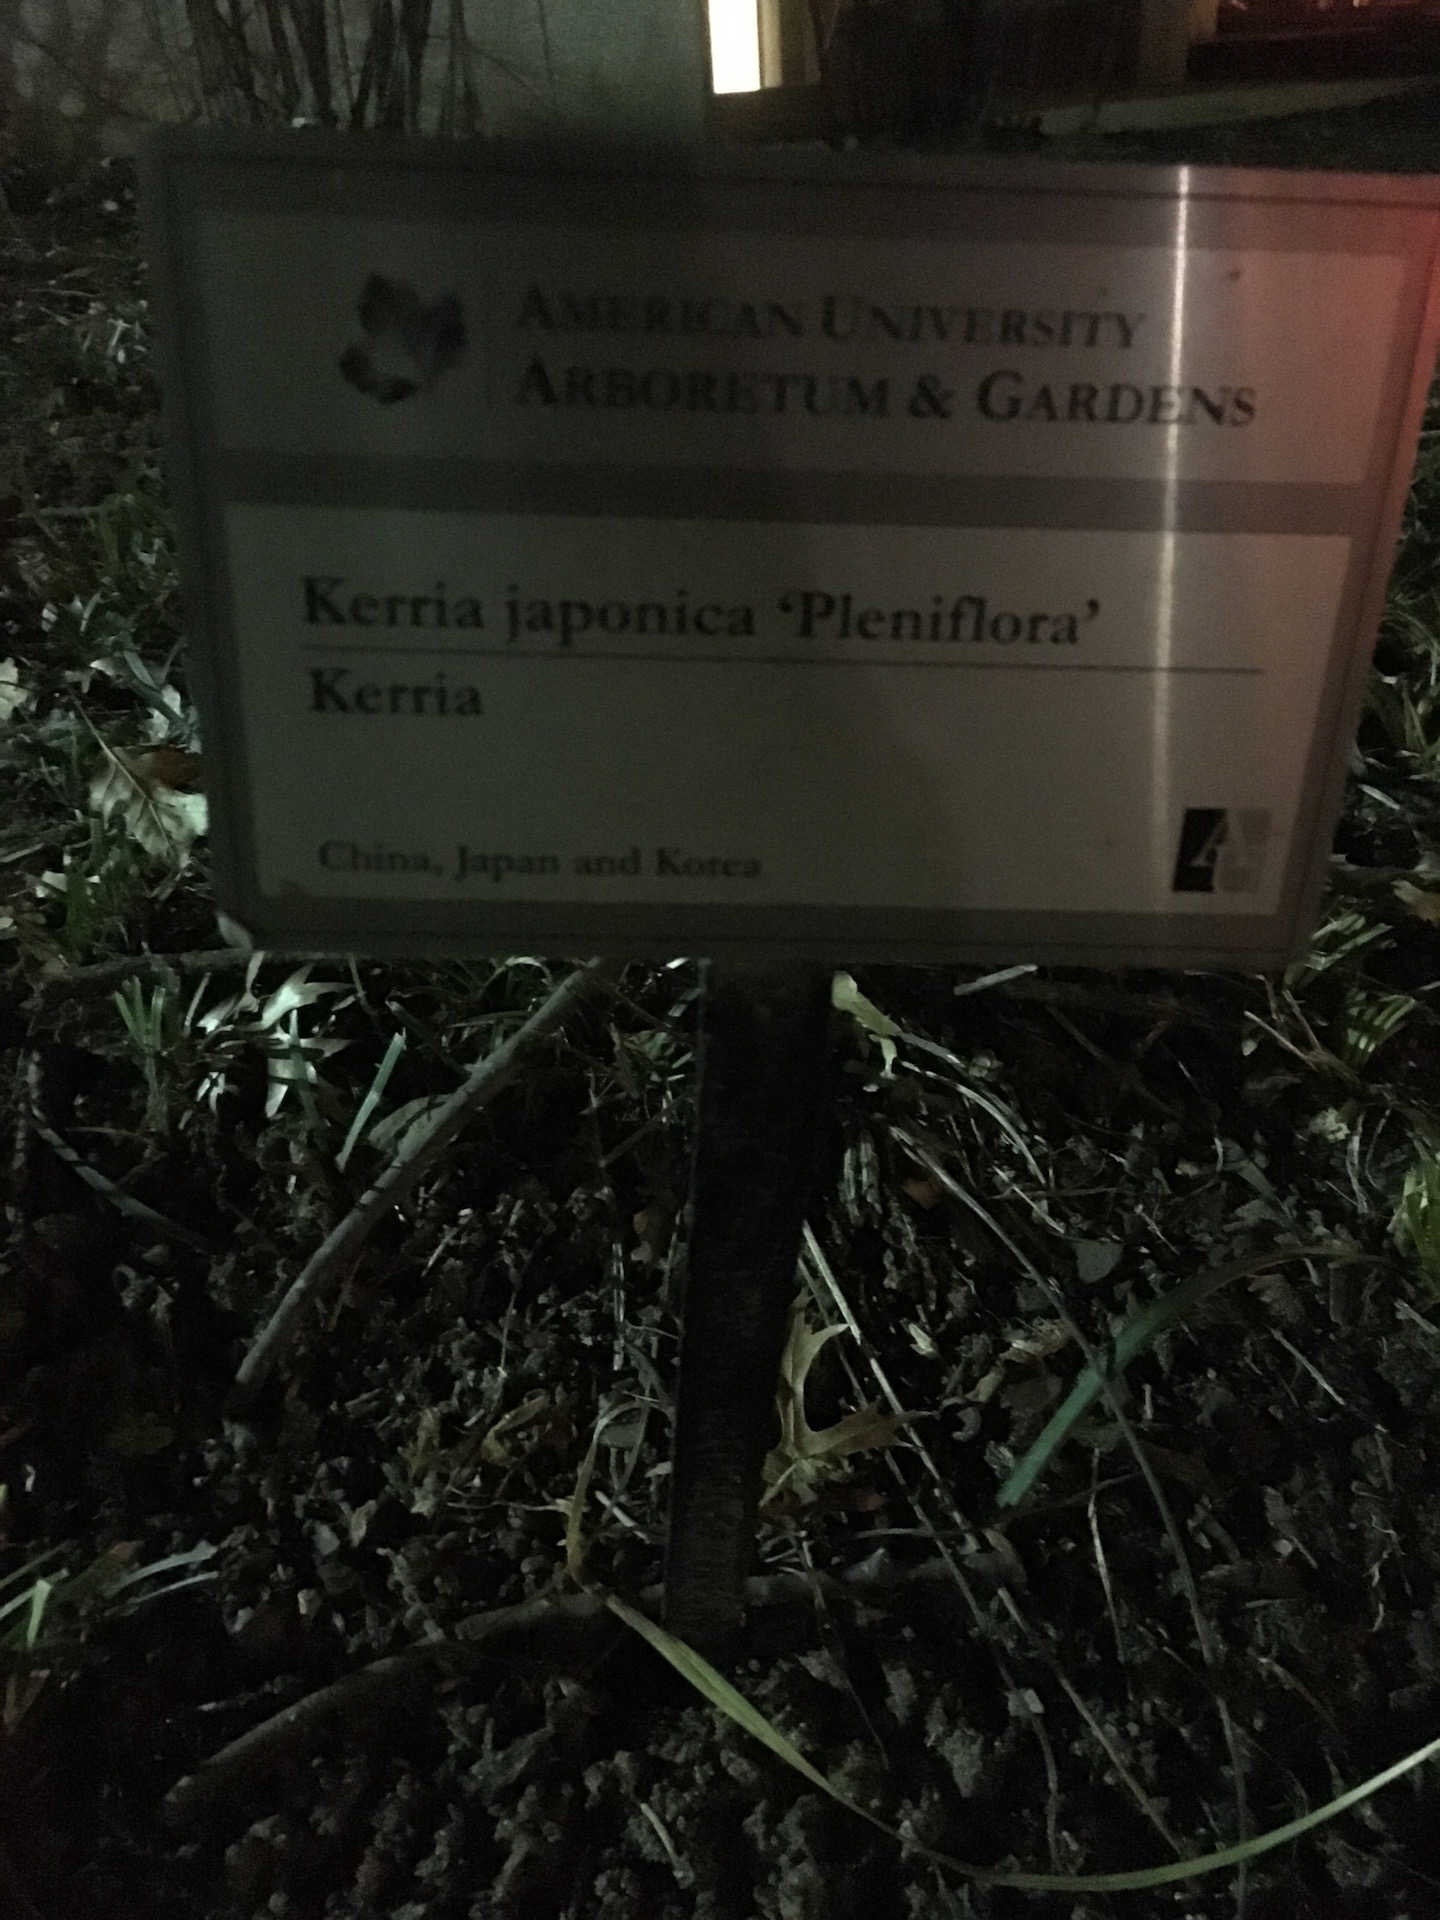
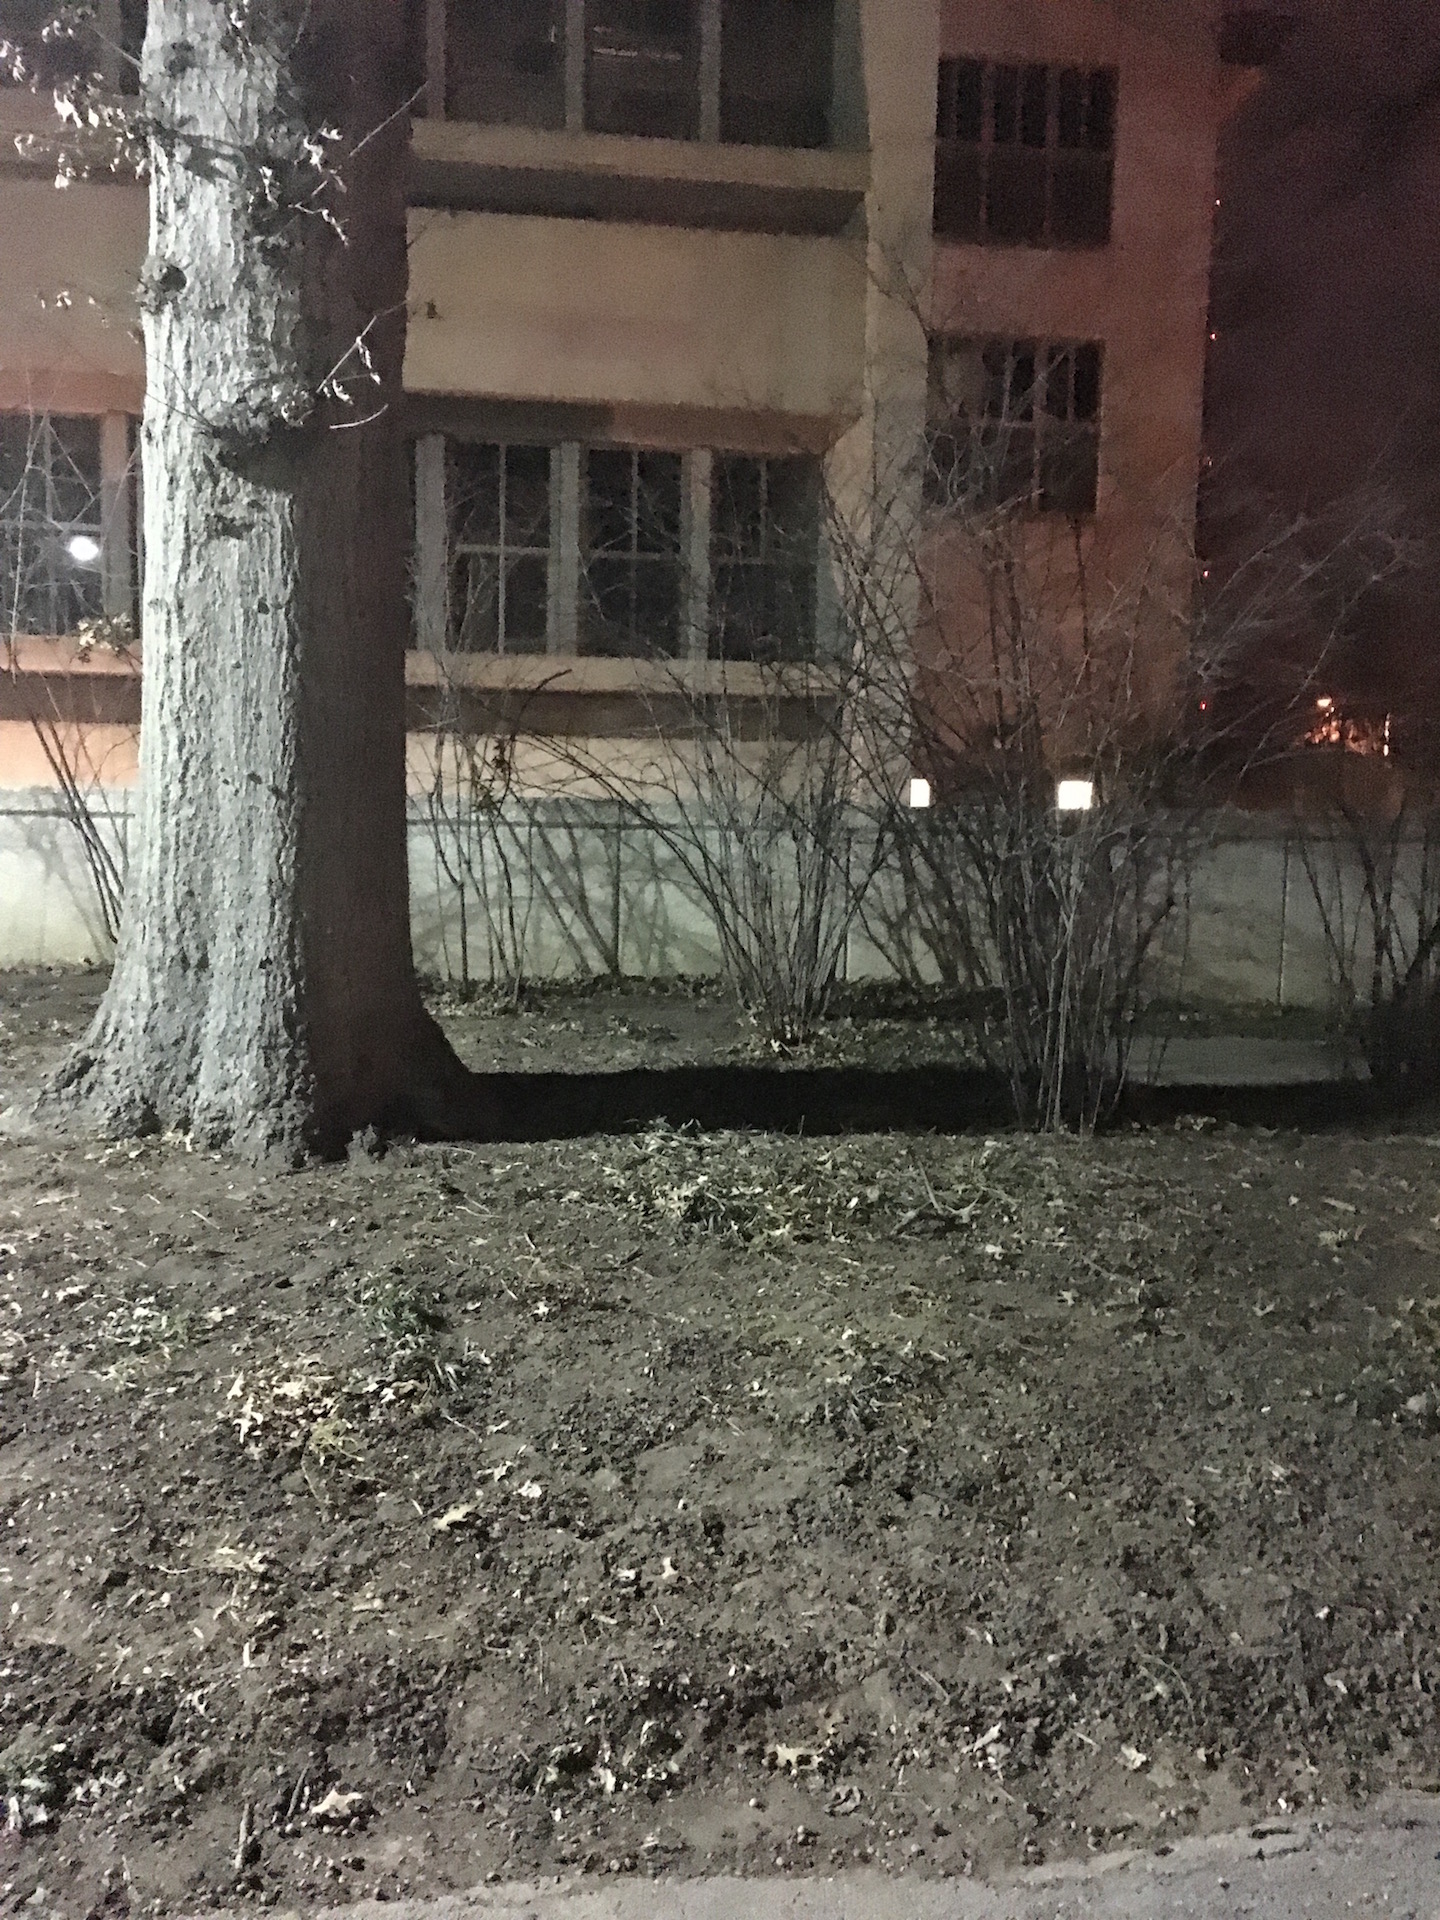
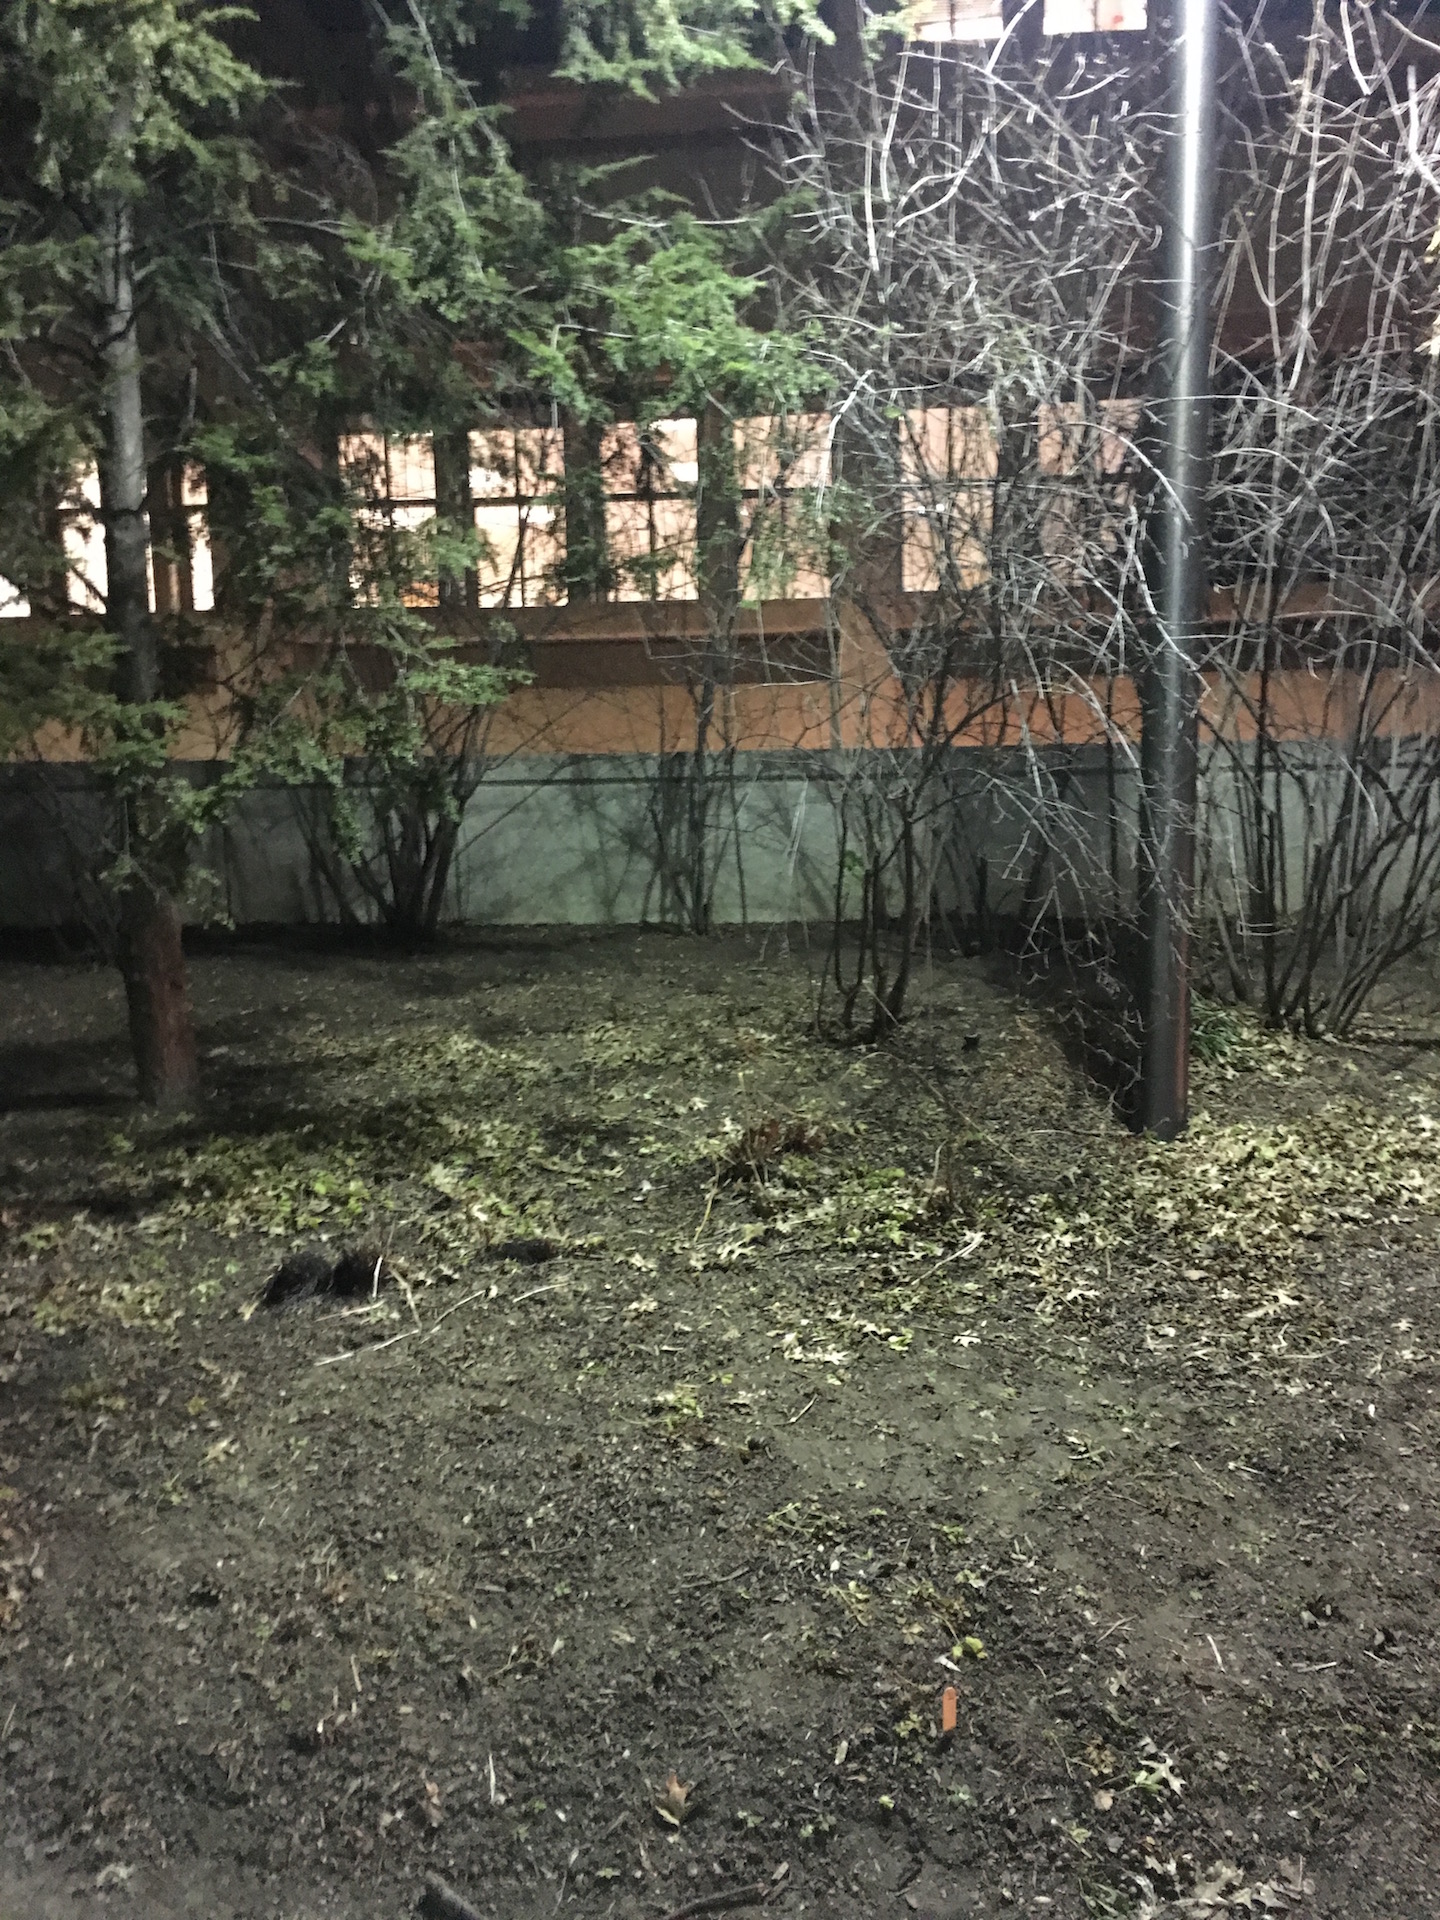
Transect 1 is comprised mostly of factors that make up a wooded terrain -- trees, leaves, soil, plants and is located right outside the East side of Hurst. The majority of the transect is on a small hill and is dominated by one large tree as well as other smaller trees (see fig. 3 and 4 for location, respectively). As a result of the recent weather (cold and snowy) much of the plant life is no longer living. According to a sign placed on the transect, there is Kerria japonica 'Pleniflora' present, a plant typically found in China, Japan, and Korea (see fig. 2). On the day when the samples were taken from the transect (01/13), the high was 32°F and the low was 21°F and there was no precipitation. Although the transect was visited at night and sunlight was not present -- the only light present came from the light pole -- it is reasonable to assume that sunlight plays a significant role in the plant and animal life seen on the transect.
Aerial View of Transect:
Kerria japonica 'Pleniflora' Sign
Transect 1 Tree
Transect 1
-AL