User:Alexis L. Danchak/Notebook/Biology 210 at AU
March 20, 2014 Embryology Lab Entry. ALD.
Introduction: The objectives of this lab are to learn the stages of embryonic development, and to study how the environmental conditions affect the embryonic development. The environmental condition is studied in this experiment is the effect that Vitamin A has on Zebrafish. Vitamin A helps with growth and development. If there is too much Vitamin A this can lead to deformities within the central nervous system and the tail in zebrafish. The Vitamin A can access the embryo directly, which makes it a great organism to use. Zebrafish have large amounts of eggs with translucent embryos, which can be observed when they hatch in a matter of days. This means that they are a great specimen to observe. They also have similar characteristics to mammalian animals so this makes them great subjects to test.
Day 1: The test group and control group will be set up in two petri dishes. 20 mL’s of Deerpark water and 20 healthy embryos will be placed in each dish. A dropper will be used to transfer the eggs to the petri dishes. 10 mL’s of Vitamin A will be added to the group being tested. These will be left to hatch.
Day 3: The viability, swimming, yolk absorption, heart rate, structures, and hatching will be observed. Any dead zebrafish will be removed with a transfer pipette. Then, 10 mL’s will be removed from each petri dish to be replaced with 10 mL’s of clean water in the control dish and 10 mL’s of Vitamin A in the test dish. Any dead zebrafish will be saved in paraformaldehyde.
Day 5: Viability, movement, and hatching will be observed. 10 mL’s will be removed from each dish, and replaced with 10 mL’s of new water and Vitamin A will be added. Any dead zebrafish will be removed from the petri dish.
Day 7: Viability, movement, yolk absorption, eye pigment/movement, body/tail pigment, heart rate, structures, tail length, and eye diameter will be observed. Changing of the water and Vitamin A will be done. Any observations or notes will be added. 3 zebrafish will be sacrificed from each petri dish. Look at some of the zebrafish on a depression slide under a compound microscope. The ones to be sacrificed will be placed in a 1.7 mL tube with only a little bit of solution in the tube. These will then be labeled in order to identify the control group and the test group.
Day 9: Viability, swimming, eye pigment/movement, body/tail pigment, structures, and tail length. If the water needs to be changed or the Vitamin A, then these will be changed.
Day 11: This is the last day that these will be observed. All applicable variables that can be observed will be observed. 2-4 zebrafish will be sacrificed. They will sit for 10 minutes while anesthesia is mixed into their 1.7 mL tube. They will then be observed with a depression slide under a compound microscope. Any living zebrafish will be placed containers to be returned.
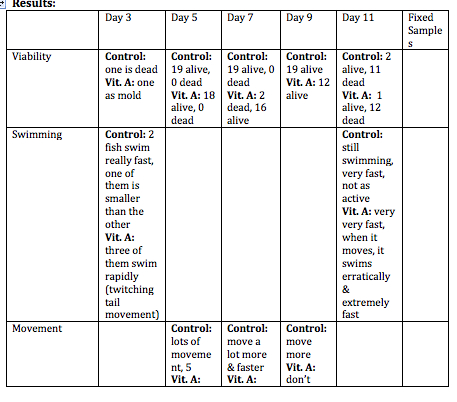
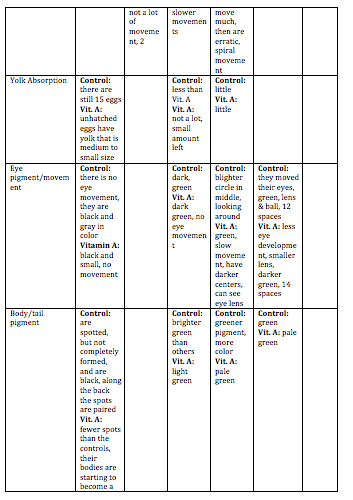
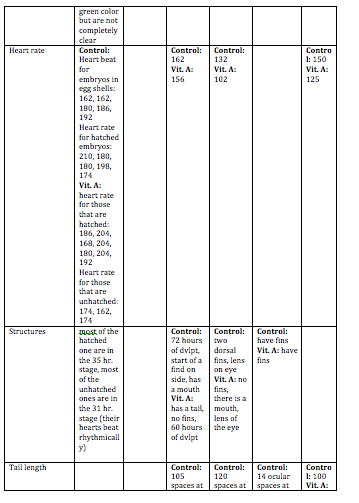
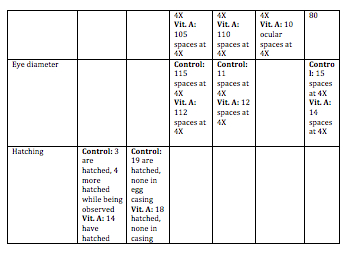
Discussion: The heart rate was not measured everyday because it was very hard to observe. Swimming was not recorded everyday because this did not change drastically everyday. Hatching was not observed after Day 5 because they were all hatched by then. Overall, the zebrafish in the Vitamin A were paler in color to the control ones. They did not develop as fast as the control group. The eyes of the Vitamin A group did not develop as much as the controls. In the fixed samples, the eyes were leaking out of the sockets. The tails of the Vitamin A group were smaller, and bent. This caused these zebrafish to move in an erratic spiral as opposed to the control ones who moved the tail side-to-side in order to move. This also caused them to move slower, and they rarely moved. For humans, this means that too much Vitamin A could result in eye deformation, deformation of other body parts, and development could be slowed. This could also result in motor reactions be slower. One limitation of this experiment was that it was very hard to examine the heart rate of the zebrafish. In order to get rid of this, they could be examined at a higher power, and there could be a timer to time the heart rate for a certain amount of time. These zebrafish could be observed for a longer time period in order to collect more data on them. A mammalian animal could also be tested to see if the same results are produced.
March 2, 2014 Week 6 Entry. ALD.
PCR mini lab
Intro: The objective of this experiment was to see the sequencing of the PCR reactions and determine what organisms were observed.
Methods: Refer to Week 3 and Week 4 of the lab manual.
Results:
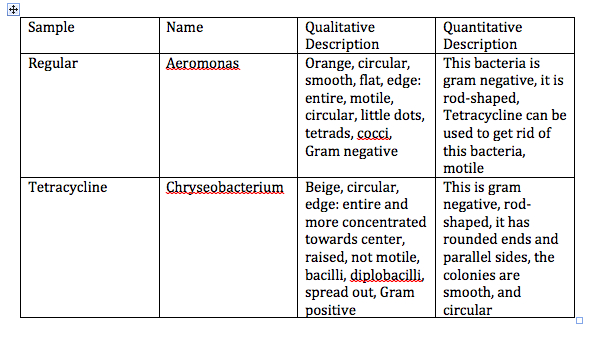
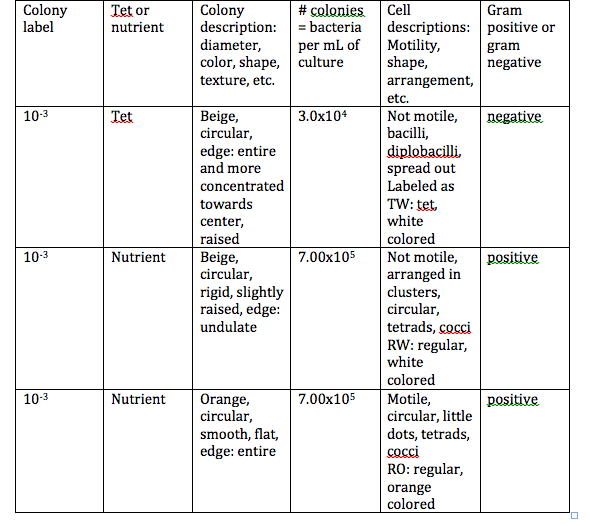
Table 1: Analysis of the organisms and their DNA sequences.
These results show that sample one was Aeromonas, and sample two was Chryseobacterium. The quantitative results and the qualitative results for sample one are similar as shown in Table 1. The quantitative results, and the qualitative results for the second sample are not as similar.
Discussion: Sample one, which is named Aeromonas, was observed to be motile, circular, and had circular edges. According to the quantitative results shown in Table 1, the Aeromonas is motile, but it is rod shaped with rounded edges. Both the qualitative data and the quantitative data proved that this bacteria is Gram negative. Both agree that there is a cocci shape to this bacteria. Sample two, which is named Chryseobacterium was observed to be circular with an entire edge. This bacteria was not observed to be motile, and looked to be Gram positive as shown in Table 1. The quantitative data shows that this bacteria was rounded edges, and the colonies are smooth and circular. According to the quantitative results, this bacteria is Gram negative.
February 16, 2014 Week 5 Entry. ALD.
Objectives/ Question: to understand the importance of invertebrates, and to learn how simple systems evolved into more complex systems. These objectives will by addressed by looking at the invertebrates found in our Berlese Funnels, and we will examine three different types of worms that show a progression from a simple system to more complex systems in each of the different worms. The questions is did our Berlese Funnel work and produce invertebrates? This will be tested by looking under a microscope at our samples.
Steps:
1. We observed the different worms in the three different stations, and described the movements of these three types of worms and how the movements are related to their body structures.
2. Then, we took our tube from out under our Berlese Funnel and poured half of it into one petri dish and the bottom half into another petri dish.
3. We examined both petri dishes under the microscope and filled in Table 1.
4. We also looked at two petri dishes that had invertebrates from West Virginia, and filled in the rest of Table 1.
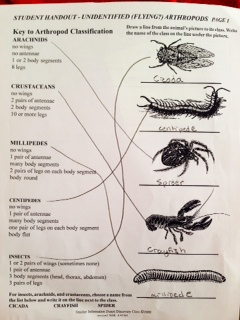
5. Then, we looked at the samples of different arthropods, and filled out the worksheet on them.
Raw Data:
Acoelomate:
Flatworms: big and slug-like, since it is like this, it just inches along, has a bulky body, doesn’t move side-to-side, and is flat
Nematode:
Roundworm: long, thin, circular, moves by wiggling side-to-side
Coelomate:
Earthworm: segmented body, circular, long, accordion-like movement
Table 1: Invertebrates
What is the size range of organisms that you measured? 0.20mm – 3mm
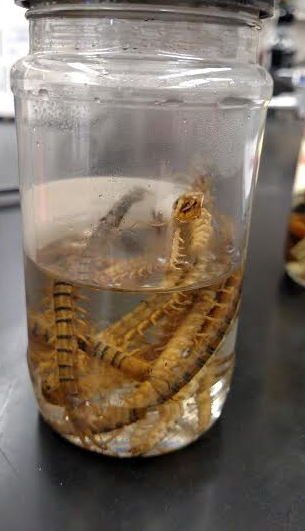
What kind of organism is largest? Centipede
What kind is smallest? Soil Mite
What kinds of organisms are most common in leaf litter? Soil Mite, Centipede, Springtail, and Springtail Primitive
Why were there not many samples from our Berlese Funnel? We did not put the leaves at the bottom of our Berlese Funnel so this affected our sample.
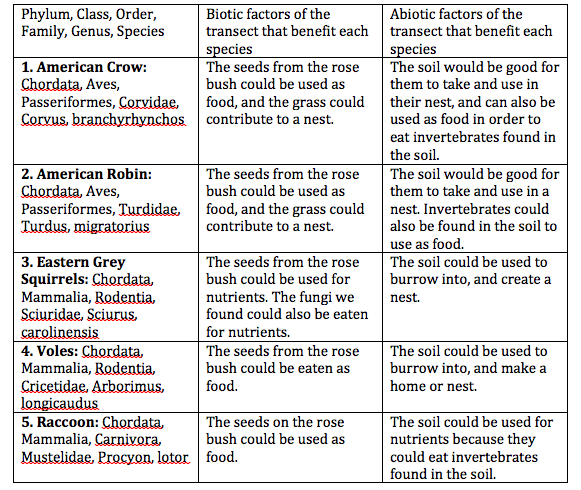
Table 2: Vertebrates and Niches
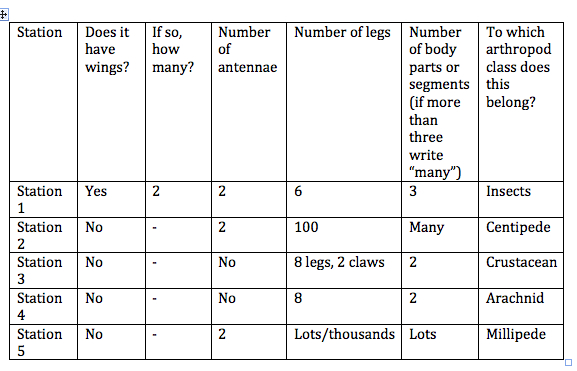
Table 3: Unidentified (Flying?) Arthropods
Figure 1: Key to Arthropod Classification
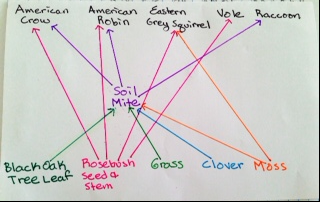
Figure 2: Food Web
Conclusion: Our Berlese Funnel did not work very well, we were only able to see one invertebrate, this is because we did not put the leaves at the bottom of our funnel. Next time, we could put our leaves at the bottom to see if this produced different results. Our objectives were met because we learned how invertebrates are important, and how simple systems evolved. My guess is that voles, raccoons, the American Robin, the American Crow, and the Eastern Grey Squirrel inhabit our transect because these are common animals in the D.C. area, and have been seen on campus. In looking at the invertebrates from West Virginia and our transect, it was determined that the smallest was the soil mite, and the largest was the centipede.
February 14, 2014 Week 4 Entry. ALD.
Objectives: to understand the characteristics, and the diversity of plants, to comprehend the function and importance of Fungi. In this experiment, five plant samples will be analyzed from the transect and classified according to their characteristics, and Fungi will be observed.
Steps:
1. We took three bags out to our transect. We filled one of them with soil from our transect, and another with plants from our transect.
2. We described where we took the five plants from in our notebooks.
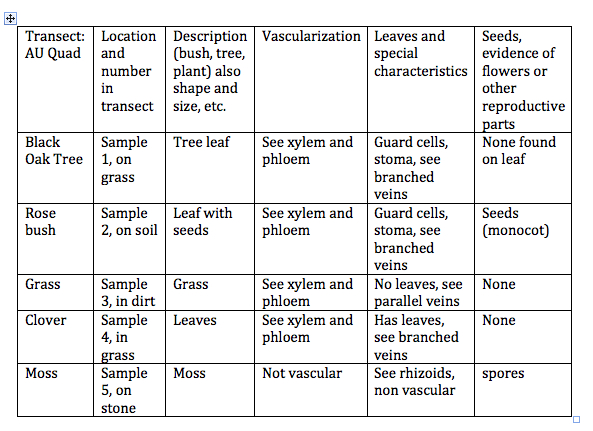
3. Table 1 was then filled out by describing the vascularization of our plants, the leaves and any specialization, if there was any evidence o f any reproductive organs, and classifying any seeds as monocot or dicot.
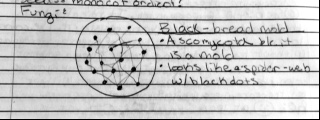
4. Then, we looked at fungi in a petri dish under a microscope, and determined what type of fungus this was.
5. Then the Berlese Funnel was set up.
6. We poured 25 mL of the ethanol/water solution into a tube.
7. We took a funnel, and cut a piece of screening material to fit into the bottom of the funnel. We taped the sides of the screening material so that leaves did not fall into the tube.
8. We place the funnel in a clamp on a ring stand.
9. The tube was place directly below the funnel.
10. We emptied the soil into the funnel, we tried to put as much soil as we could into our funnel.
11. We then left our funnel in order for the invertebrates to fall into the tube.
12. The PCR reactions were observed on agarose gel, and observed under UV light.
Raw Data:
Table 1: Transect Plants
What are Fungi sporangia and why are they important? Sporangia are the spores that fungi produce during asexual reproduction. Spores are their way of reproducing, and continuing having fungus grow in various places.
Why do you think it is a fungus? We think it is a fungus because it looks like it has spores, because it looks like mold. It also looks exactly like the picture of the Black-bread mold in our lab sheet.
Figure 1: Fungi Drawings
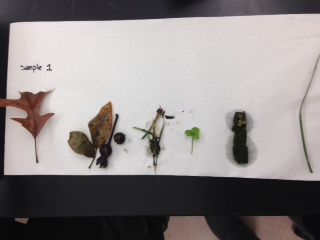
Figure 2: Picture of All Plant Samples
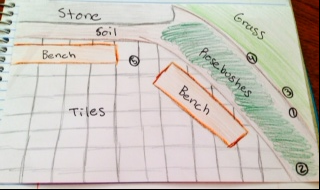
Figure 3: Map of AU Transect and Numbers Showing Where the Sample Were Taken
Key:
Sample 1: Black Oak Tree leaf
Sample 2: Rosebush seed and stem
Sample 3: Grass
Sample 4: Clover
Sample 5: Moss
Conclusion: In this lab, we found out that in our transect we had a Black Oak tree, a rosebush, grass, a clover, and moss. We also determined that the fungus we were looking at was Black-bread mold. The objectives were reached by looking at the fungus, and also examining our plant samples. When we set up our Berlese Funnel, we did not put the leaves at the bottom of the funnel so this could affect our results when we look at our invertebrates next week. To have prevented this, we could have put the leaves at the bottom of our funnel.
February 9, 2014 Week 3 Entry. ALD.
Objectives and Question: To understand the characteristics of bacteria, observe antibiotic resistance, learn how DNA sequences are used to identify species. The question is will any Archaea species have grown on the agar plates? I predict that there will be some growth on the agar plates because I think they will be able to live off of the nutrient provided for them on the plates without the tetracycline. I think there will be more bacteria on the plates that are not too diluted, like the 10-3, because there will be more nutrients available for the bacteria, instead of a very diluted, watery mixture of nutrients. There will be amore concentrated mixture of nutrients available for the bacteria. I do not think there will be any growth on the plates that contain tetracycline because this is an antibiotic so it should be able to fight off these bacteria, and prevent them from growing. We will look at the nutrient agar plates, and see if there are any bacterial colonies growing on the plates, this will allow us to answer this question.
Steps:
1. We took another look at our Hay Infusion, and made observations about any changes in the smell of appearance of this sample.
2. We filled out Table 1 by looking at our agar plates.
3. We identified three different colonies that we wanted to look at under a microscope, two were from the 10-3 plate without the tetracycline, and the other was from the 10-3 plate with tetracycline.
4. Before looking at these under a microscope, we looked at already prepared slides of bacteria in order to be familiar with what bacteria look like.
5. To make the wet mount slides of our three colonies, we used a loop to scrape the agar plates from each of the three colonies. We used three separate loops in order to not contaminate the different colonies. We then placed a drop of water on the slides to look at the colonies under the microscope.
6. We then looked at the colonies under the microscope.
7. Next, we prepared gram stains.
8. We did this by scraping more of our three colonies onto three new slides, without a covers slip. Then we drew a red circle around these colonies in order to identify where we put the colonies on our slides.
9. We then lit a Bunsen burner, and used tongs to run each slide through the Bunsen burner quickly 7 times.
10. We made sure that the slides were dry, then placed them on a straining tray. We then covered them with crystal violet for 1 minute.
11. Then, we rinsed the stain off using a wash bottle containing water.
12. Then, we covered the slides with Gram’s iodine for another minute followed by gently rinsing them with water.
13. Then, in order to decolorize by flooding the smear with 95% alcohol for 20 seconds. We rinsed it with water.
14. Then, we put safranin stain on for 30 seconds, and rinsed it with water.
15. Then we carefully dried our slides with paper towels.
16. We then looked at the slides under the 40X, and oil lens objective.
17. Then we prepared our PCR reaction by mixing a small amount of two of our colonies, one from the tetracycline plate (this was an orange colored colony), and one from the regular agar plate (this was also an orange colony) in 100 microliters of distilled water.
18. We labeled these with initials, and put RO for regular orange, and TO for tetracycline orange.
19. We heated these in the heating block for 10 minutes.
20. Then we put them in the microcentrifuge for 1 minute at 13.6K rpm.
21. Two samples, one from the tetracycline bacteria and one from the regular bacteria were transferred into two sterile tubes with a 100microliters of water
22. This was incubated at 100°C for 10 minutes, and then centrifuged.
23. 5 microliters of the supernatant was placed into the PCR reactions.
Raw Data:
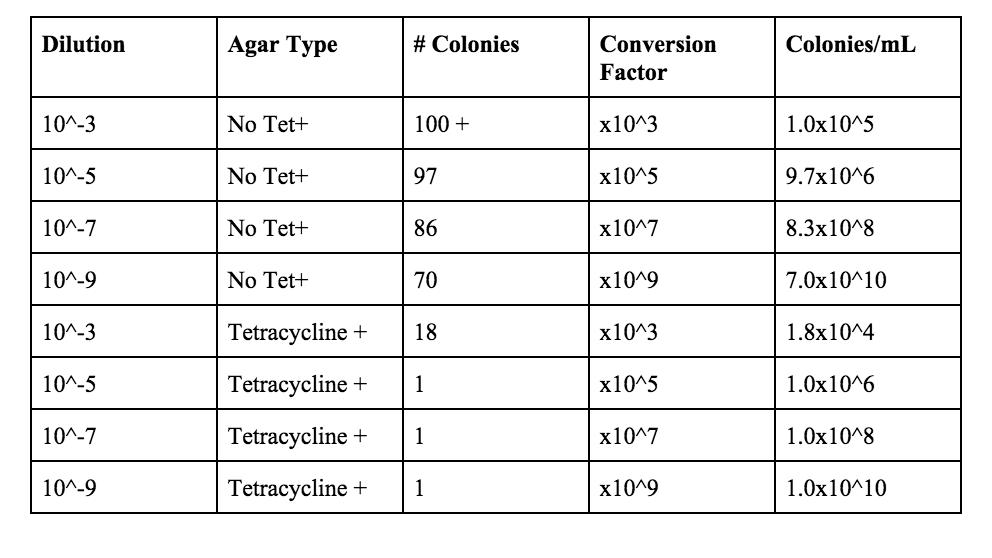
Table 1: 100-fold Serial Dilutions Results
Hay Infusion Observations: everything went to the bottom, there is nothing growing on top, it is clearer, some grass is still growing on the bottom, there is water on top, the odor is less distinct
Why would the appearance or smell change in a week for the Hay Infusion? The appearance and smell could change because whatever is growing in there might not have enough nutrients to sustain itself so it cannot grow anymore, and it could also die.
Do you see any differences in the colony types between the plates with vs. without antibiotic? Without the antibiotic there was fungi on the 10-9 plate, and a lot of colonies on the 10-3 plate. There were definitely more colonies on the 10-3 plate without the Tet than on the plate that contained Tet. The colonies look like they are circular, and that there are some irregular shaped ones. Without Tet, the colonies are smaller, and they are lighter in color. With the tetracycline, they have a very orange color, and the size of the colonies are bigger. Without the Tet, there are more white and beige colored colonies.
What does this indicate? This indicates that these bacteria are able to grow more easily without the antibiotic. It also indicates though, that these bacteria are antibiotic resistant since there was a considerable amount of growth on the 10-3 plate with Tet.
What is the effect of tetracycline on the total number of bacteria? Fungi? There a bigger colonies, but there are less colonies. There is more fungi on the 10-5 and 10-7 plates than on the regular plates.
How many species of bacteria are unaffected by tetracycline? In our samples, it seems that two types of bacteria were not affected by the tetracycline.
How does Tetracycline work? Tetracycline is used to kill E. Coli, Haemophilus influenza, Mycobacterium tuberculosis, and Pseuodomonas aeruginosa(Rafal). Tetracylince inhibits protein synthesis by binding to the 30S ribosome in order for the aminoacyl tRNA to be prevented from binding to the RNA-ribosome complex (Rafal).
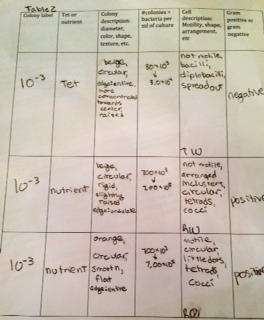
Table 2: Colony Descriptions
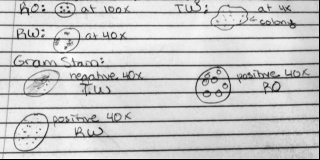
Figure 1: Colony Drawings and Gram Stain Drawings
We labeled our colonies with the letters RW (regular-white colored), RO (regular-orange colored), and TO (tetracycline-orange colored).
Conclusions: My prediction was correct in saying that I thought there would be some growth on the regular agar plates, but bacteria only grew on one of these plates. My prediction was incorrect in saying that no bacteria would grow on the Tet plates, bacteria grew on one of these plates. We determined that some of our bacteria was antibiotic resistant, and that is why it grew on the Tet plate, but it only grew on the least diluted plate. On the 10-5, 10-5 with Tet, and 10-7 with Tet plates fungi was growing. We also determined that our colonies were all circular, and the we had orange colored ones, and white colored ones. We can use the fungi plates later to determine what type of fungi is growing on them. The objectives were all addressed in this experiment.
References:
Klajn, Rafal. “Antimicrobial Proporties”. Tetracycline. Institute of Organic Chemistry, PAN. (8 Feb. 2014) < http://www.chm.bris.ac.uk/motm/tetracycline/antimicr.htm>
2/6/14, lab 1 notes
Great job, Alexis! Start working on building a map of your transect to detail your land and where your samples are taken from. We will talk about this more Wednesday.
AP
February 5, 2014 Week 2 Entry. ALD.
Objectives: to understand how to use a dichotomous key, and to comprehend the characteristics of Algae and Protists. In this experiment, we will use a dichotomous key to determine what the unknown organisms are, and we will look at algae and protists.
Steps:
1. We observed our Hay Infusion, and determined if there were any changes from the week before.
2. We used a dichotomous key to identify six organsims. In order to identify these organsims, we made wet mount slides from our Hay Infusion. We did this by taking a sample from the bottom for one slide, and taking a sample from the top for the other slide.
3. We identified three organisms on each slide, described their characteristic, and measured their size with the ocular micrometer.
4. We labeled four tests tubes with the numbers 2,4,6, and 8. We put 10 mL’s of broth into all four test tubes. Then, we took 100 μL’s from the Hay Infusion, and mixed this into test tube 2. We then took 100 μL’s from test tube 2, and placed it into test tube 4. Then, 100 μL’s was taken from test tube 4, and put into test tube 6. Lastly, 100 μL’s was taken from test tube 6, and put into test tube 8. All of these were gently mixed.
5. We labeled seven agar plates with the labels: 10-3, 10-5, 10-7,10-9, 10-3 tet, 10-5 tet, and 10-7 tet. The ones with the “tet” label also have tetracycline on them, so we used four regular nutrient agar plates, and three that had tetracycline on them.
6. 100 μL’s was taken from test tube 2, and placed onto the 10-3 agar plate. We then spread the sample over surface of the agar plate. We used the exact same procedure for the 10-3 tet plate. We used this same procedure and put the number 4 test tube onto the 10-5 plates, the number 6 test tube was used with the 10-7 plates, and the number 8 test tube was used with the 10-9 plate.
7. We left the agar plates to incubate at room temperature for a week.
Raw Data:
Observation of Sample: the water is murky, dirt has settled to the bottom, there is grass growing from the bottom, there is something growing on the top that has white speckles, there is a layer of gray film along the top, mold is growing, the sample has a distinct odor.
Why might organisms differ near vs away from the plant matter? Organisms may differ when taken near plant matter because the organisms that need plants for nutrients will be located around the plants. Organisms that do not need plants for nutrients will not be located near the plant matter.
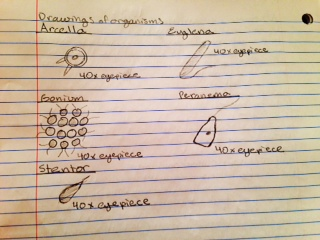
Organisms found in the sample:
Sample taken from the top:
Arcella – size: 25 μm
Very mobile, kind of brown
Euglena – size: 12 μm
Very mobile, green
Gonium – size: 40 μm
Not really mobile, green in color, many cells
Sample taken from the bottom:
Euglena – size: 25 μm
Very mobile, green in color
Peranema – size: 10 μm
Very mobile, colorless, could see nucleus
Stentor – size: 12.5 μm
Very mobile, brown in color
Description of Euglena as an organism and how it meets that criteria of being alive (according to Freeman, page 2 in the book): Euglena are heterotrophic organisms so they have to consume food, and they also perform photosynthesis in order to acquire more energy (Biologycorner.com). This organism meets the criteria of Energy because it acquires energy through eating and going through photosynthesis, and uses this energy to help maintain the functions of the organelles in its cell. This organism is made of a cell with a membrane that can regulate what comes in and out so it meets the second criteria (Cells). Euglena have an eyespot in their cell that allows them to identify where light is so they are processing information (Biologycorner.com). This means that they meet the criteria of Information because they are processing this information in order to keep the cell alive, and keep it functioning. Euglena replicate by dividing into two so this meets the criteria that the organism has to replicate in order to be alive (Sitemeter, 2009). Euglena have evolved because there used to be Euglena without chloroplasts (Princeton.edu, 2014).
What changes would you expect to occur if the hay infusion where observed for two more months? If the hay infusion would to be observed for another two months I would expect grass to cover the bottom. I would expect the white speckles on the top to cover the surface, and the gray film to cover the entire surface of the top. I would also expect the mold to have spread throughout the entire sample.
What selective pressures affected the compositions of the samples? The selected pressures that affected the compositions of the sample was the amount of nutrients that were available. The sample could only sustain itself with whatever nutrients were present within it. Also, the amount of sunlight that was present in order to help the grass perform photosynthesis. The grass did not receive as much sunlight as it would if it were outside, so this limited it’s ability to perform photosynthesis.
Figure 1: Dilution procedure
Conclusions: There was Arcella, Euglena, and Gonium on the slide that had the sample from the top of the Hay Infusion. There was Euglena, Peranema, and Stentor on the slide with the sample taken from the bottom. The Hay Infusion seemed to stop growing things on the surface, which could be because it did not have enough nutrients to sustain itself for this long, so whatever was growing on the surface died. The bottom was still growing so it still had enough nutrients to continue to live. The objectives were addressed because we learned how to use the dichotomous key, and learned the distinctions between Algae, and Protists.
References:
“Euglena”. The Euglena. Biologycorner.com. (26 Jan. 2014) < http://www.biologycorner.com/worksheets/euglena_color.html#.UuUMqXn0B7->
“Form and Function”. Euglena. 18 Jan. 2014. Princeton.edu. (26. Jan. 2014) < http://www.princeton.edu/~achaney/tmve/wiki100k/docs/Euglena.html>
“Protozoa – Euglena”. Protozoa – One Celled Animals. 2009. Sitemeter. (26 Jan. 2014) < http://www.mcwdn.org/Animals/Euglena.html>
January 30, 2014 Week 1 Lab Entry. ALD.
Objectives: Understand the characteristics and differences between biotic and abiotic factors. This experiment will help us learn the differences between these by having us characterize things as living or nonliving.
Steps:
1. Next, we went outside where our TA showed us which 20 X 20 feet transect we had.
2. We recorded all observations pertaining to the location, topography, abiotic factors, and biotic factors. Pictures were also taken at this point.
3. After this, a sample of the transect was taken using a shovel. The sample was placed into a tube. This sample was taken where the grass met up with the soil of what was surrounding the plants in our transect.
4. This sample was then taken back into the lab.
5. 10.9 grams of the sample was placed into a plastic jar with 500 mLs of Deerpark water. 0.1 grams of dried milk was added, and then the mixture was mixed up for 10 seconds.
6. The hay infusion was then placed on one of the tables with the lid off. The jar was labeled at this point in order to provide identification of the jar.
Raw Data:
Location: middle of the AU quad Topography: grass, rose bushes, concrete, soil, stone, level grounds, small plants
Abiotic/Biotic Factors: concrete, stone, soil, grass, rose bushes, small plants
Conclusions: The location of our transect was determined be the middle of the AU quad. The abiotic factors in our transect were determined to be the stone, concrete, and soil. The biotic factors in our transect were determined to be the grass, the rose bushes, and the small plants. In future studies we could figure out what type of plant these small, green plants are.
January 22, 2014 Successfully entered text into Lab notebook. ALD.
