Talk:20.109(S10):Aptamer binding assay (Day7)
Binding Data Files
| Group | T/R zip data file | W/F zip data file |
|---|---|---|
| Red | Media:S10_M1D7_TR-Red.zip | Media:S10_M1D7_WF-Red.zip |
| Orange | Media:S10_M1D7_TR-Orange.zip | Media:S10_M1D7_WF-Orange.zip |
| Yellow | Media:S10_M1D7_TR-Yellow.zip | Media:S10_M1D7_WF-Yellow.zip |
| Green | Media:S10_M1D7_TR-Green.zip | Media:S10_M1D7_WF-Green.zip |
| Blue | Media:S10_M1D7_TR-Blue.zip | Media:S10_M1D7_WF-Blue.zip |
| Pink | Media:S10_M1D7_TR-Pink.zip | Media:S10_M1D7_WF-Pink.zip |
| Purple | Media:S10_M1D7_TR-Purple.zip | Media:S10_M1D7_WF-Purple.zip |
Binding Data Results Summary
T/R
| Group | Corrected A405 values* | Pre % 8-12: expected, measured | Post % 8-12: fewer washes, more washes (measured) | Additional comments | |
|---|---|---|---|---|---|
| Syntax sample | 0.1; 0.2; 0.3 0.4; 0.5; 0.6 |
10%, 12% | 40%, 50% | We used Grey group's 6-5 because we didn't have any. | |
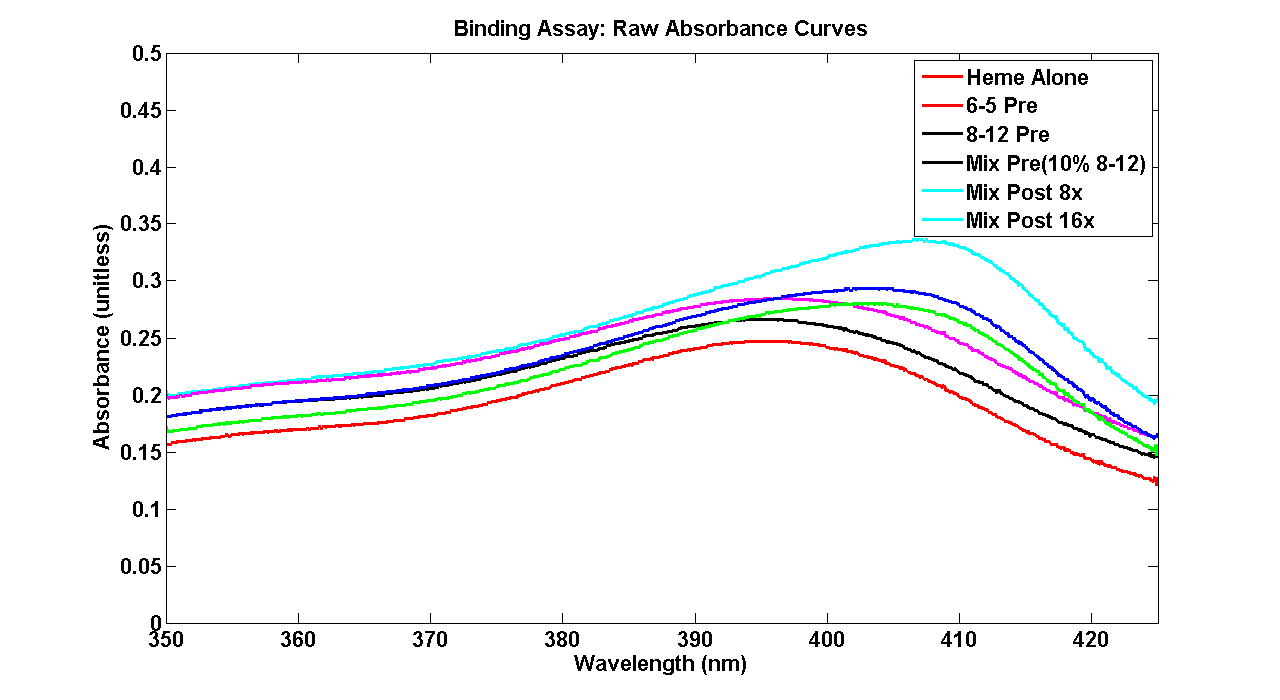
| red | 0.276; 0.281; 0.282; 0.283; 0.349, 0.385 |
50% ; >150% | > 150% ; > 150% | We had to use extra '6-5' because we ran out of it. Our results came in harmony with what expected in terms of peak shifts. There was something definitely wrong with our '8-12' and 'pre-wash' mixture absorbency, which were abnormally low (even lower than '6-5' peak we tried to fix it by making the 350 nm - 385 nm overlap by finding the average distance, but that procedure neither made them perfectly overlap nor did it increase the peak. If you look at the graph, you can see that our pre-mixture is quite close to out 8-12 curve and very far from our 6-5 curve. When we calculated the real % 8-12 we had a HUGE value come out! So our data is not the best to discuss 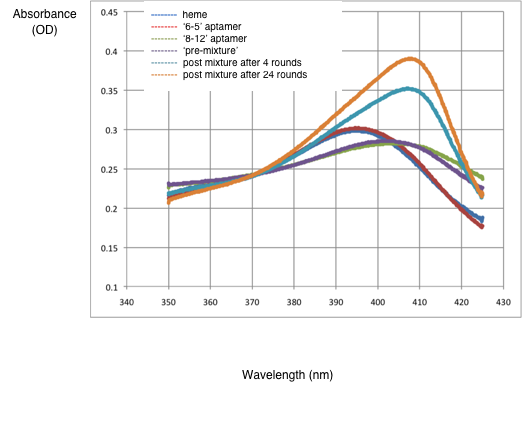
| |
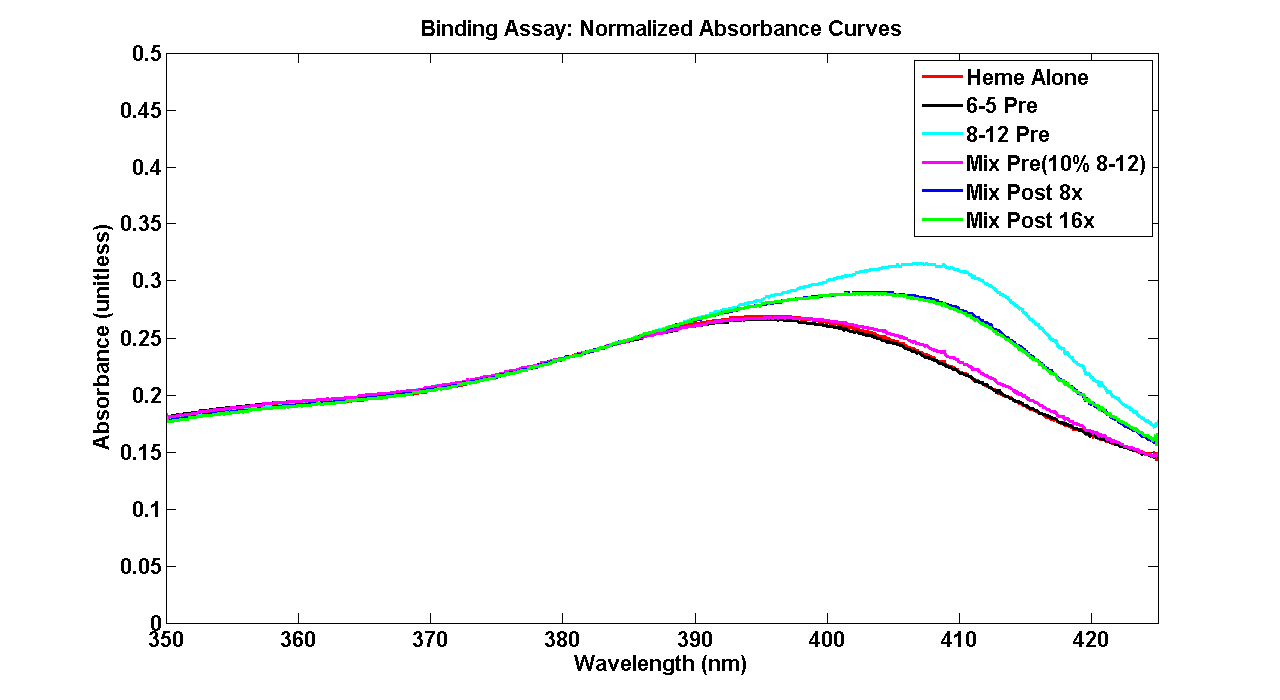
| orange | 0.181392157 0.182 0.236803922 0.18354902 0.256019608 0.281509804 |
2%; 3.3696% | 4 washes: 134.8675%; 24 washes: 181.1195% |
Only used 1nmols each for the binding assay samples
Normalized Data: Media:NormalizedAbsorbance.png | |
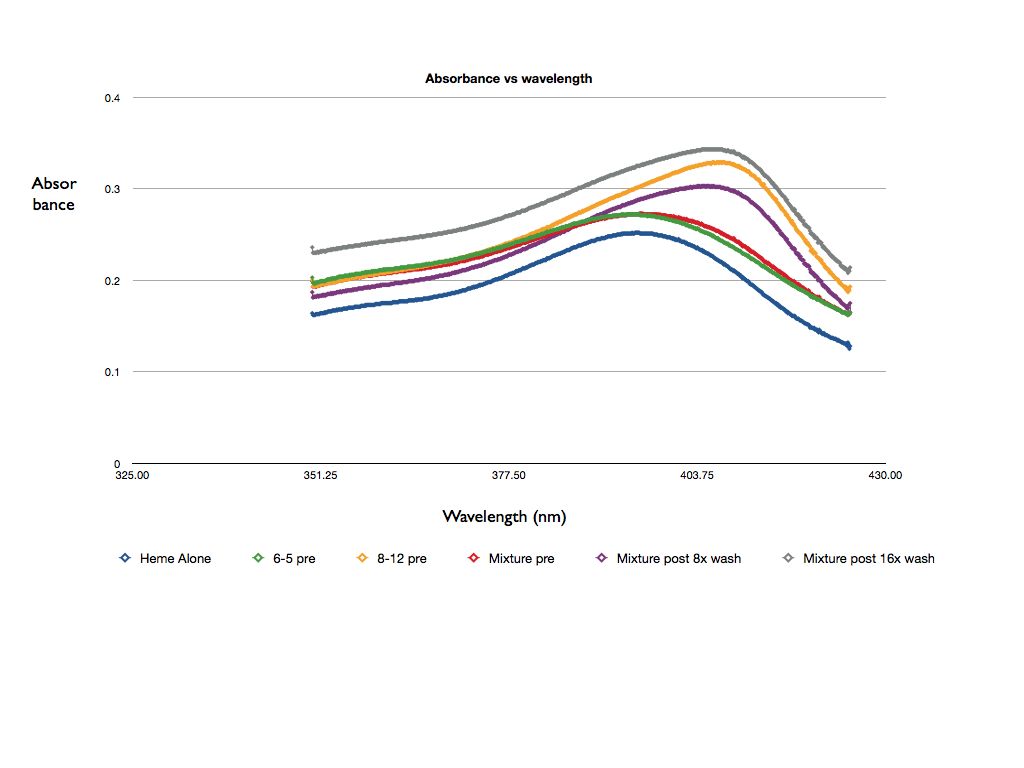
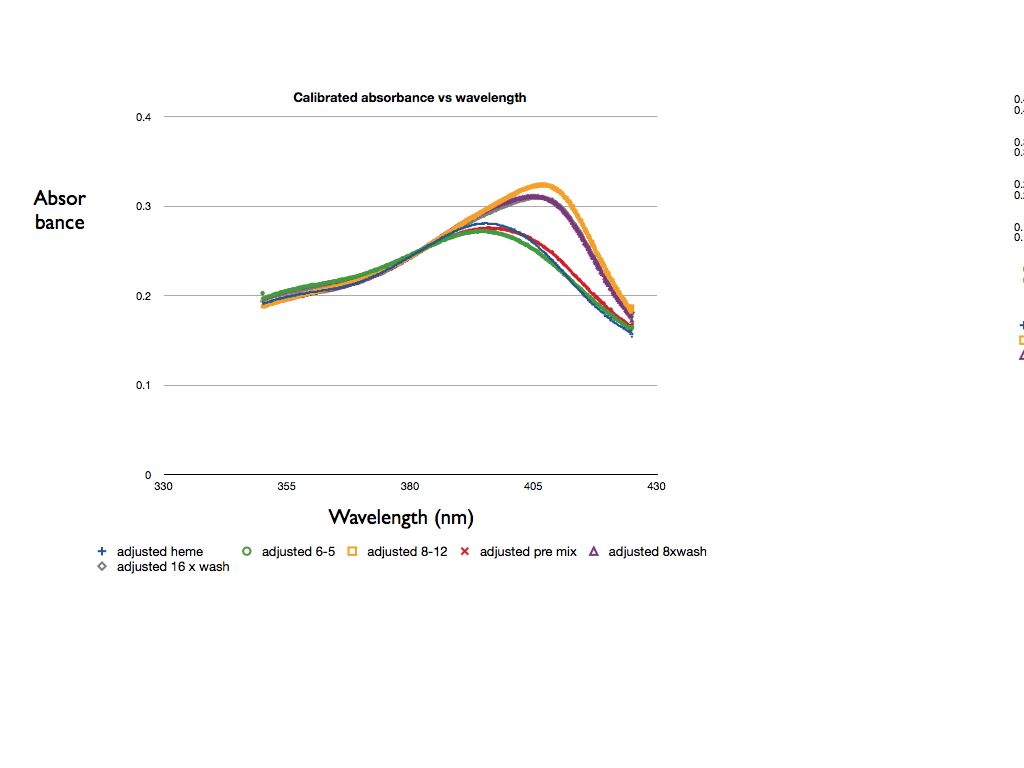
| yellow | 0.270, 0.276, 0.345, 0.272, 0.325, 0.329 | 2%; -5.79% from MATLAB: 0% | 8 washes: 71.01%, 16 washes: 76.80% from MATLAB: 8 washes: 65.82%, 16 washes: 67.08% |   The pre value is definitely wrong. I believe it is due to either the corrections or OpenOffice dropping sig-figs somewhere. Our post mixtures are around what I would expect. The horizontal peak shifts seem to be consistent with our findings. File:Results chart.pdf The results match the hypothesis that the 8-12 aptamer will have a shifted peak and a higher absorbance. The mixtures have slightly less shifted peaks and a smaller increase in absorbancy (relative to the heme-alone baseline). This makes sense, as they have a smaller concentration of 8-12 aptamer than the 8-12 sample. It is unexpected that the 6-5 pre sample has a lower absorbance than heme alone. This does not match our hypothesis and is indicative of potential experimental error. It is also unexpected that the 8 wash sample has a higher absorbance than the 16 wash sample--perhaps 16 washes removes enough of the 8-12 aptamer in addition to the 6-5 aptamer to lower the absorbance. |
|
| Green | 0.244, 0.242, 0.319, 0.252, 0.286, 0.312 | 10%; 12.987% | 4 washes: 57.143%; 24 washes: 90.909% |
File:20.109 Green TR assay graphs version 2.pdf Due to the corrections, the heme and 6-5 aptamer horizontal peaks are a little off; the 6-5 aptamer graph should be shifted up from the heme graph at low absorbances, but instead, it's simply lined up with the heme graph. The other graphs seem consistent with the fact that 8-12 graph should be higher horizontally than the 6-5 graph, with the heights increasing in the following order: mix 10% pre, mix 10% post 4x, post 24x, and 8-12 aptamer. | |
| Blue | 0.261, 0.263, 0.322, 0.294, 0.3111, 0.306 |
50%; 52.2905% | 8 washes: 80.3992%; 16 washes: 71.7277% |

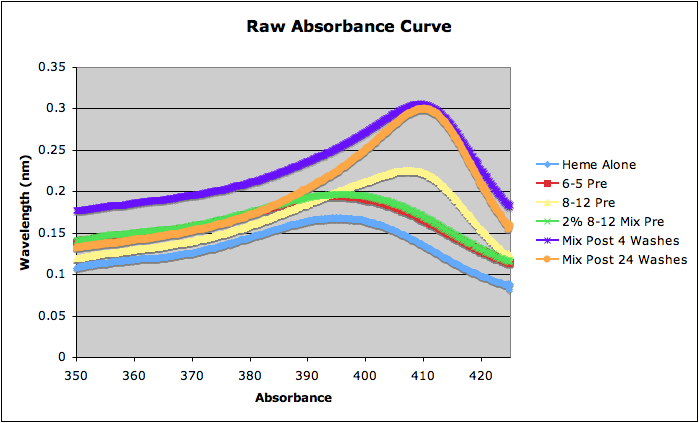
Raw Data: Media:rawdata.jpg | |
| Pink | 0.249; 0.248; 0.317; 0.257; 0.321; 0.294; | 10%, 14% | 8 washes: 67% 16 washes: 106% |
Our data has two major errors. 1) Our graph shows that we have over 100% 8-12 in our 16 wash sample. We believe that this is due to an error in the molecular weight assumption that we made. We believe that we overestimated the MW which caused us to not dilute the sample enough. This means we had over 8 M sample which we then mixed with 6M samples, assuming we probably had less than actually 8M. This caused our absorbance to be very high. 2) We added double heme to our 8 wash mixture. We demed that the absorbance we found from that sample was useless, and we ran another sample with our remaining aptamer 8 wash mixture. It contained 100ul mixture 75 ul buffer and 175 ul heme. We found the expected ratio of heme to mixture in nanomoles and then corrected our ratio and data accordingly. This is the data shown on the graph.
| |
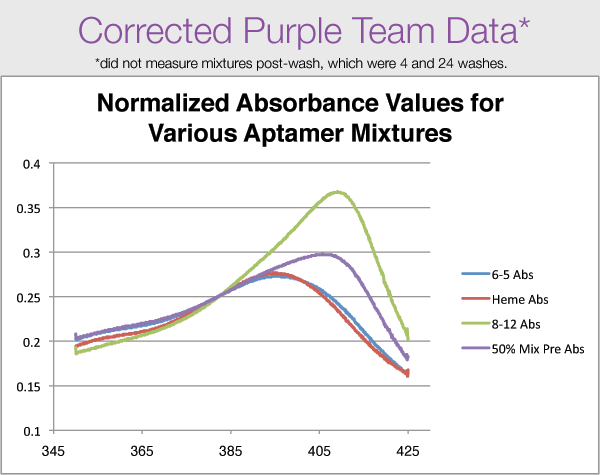
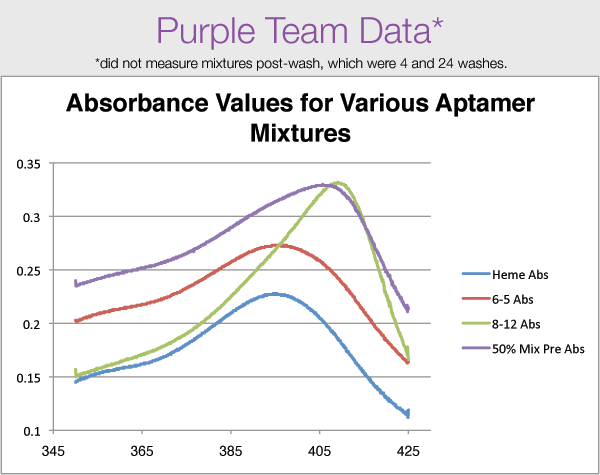
| Purple | 0.254; 0.259; 0.3559 0.2971; N/A; N/A |
50%, 41.5% | N/A | We did not obtain proper data for the mixes post-wash, unfortunately. Also, our 8-12 "pre" sample came from the Blue group. <3 The horizontal and vertical shifts for the samples we did have all appear consistent with our expected results. Corrected Data: Media:Yuan-mod1spec-CORRECTED.png |

* Be sure to post the values you got after baseline correction, not the raw data (if your curves didn't line up)!
* Order: heme, 6-5, 8-12, "pre" mix, post low wash, post high wash
* Recommended syntax for A405 column: "#1 ; #2; #3 <br> #4; #5; #6"
W/F
| Group | Corrected A405 values* | Pre % 8-12: expected, measured | Post % 8-12: fewer washes, more washes (measured) | Additional comments |
|---|---|---|---|---|
| Syntax sample | 0.1; 0.2; 0.3 0.4; 0.5; 0.6 |
10%, 12% | 40%, 50% | We used Grey group's 6-5 because we didn't have any. |
| Red | 0.260; 0.252; 0.323 0.262; 0.311; 0.30888 |
10%, 14% | 82.5%, 80.9% | Now the calculations are correct. :)
Raw Data: Media:WFRed-UV.png Raw Graph: Media:20109rawgraph.002.jpg |
| Orange | 0.2802;0.28;0.362 0.289;0.324;0.3558 |
50%;10% | 4 washes 53.5%;24 washes 92.4% | We hypothesized that with 4 washes the final mixture would be 60% 8-12, and that for 24 washes the final mixture would be 90% 8-12. Our observed values are relatively close. We were suprised that the pre-mixtue had only 10% 8-12 when we though we put in 50% 8-12. We are trying to figure this out.
Raw Data:Media:raw.pdf Normalized Data:Media:normalized.pdf |
| Yellow | 0.2623; 0.2580; 0.3333 0.2620; 0.2895; 0.2863 |
2%;5.4% | 8 Washes 41.8%; 16 washes 37.6% | During the dilution step, we accidentally diluted it to 7.7uM as opposed to the 8uM (This is estimating final concentration to be 50% 8-12) However, we corrected this by decreasing the amount of heme so that it was still a 1:1 ratio. Therefore, the results should not have been affected. Normalization was used to correct for the heme curve, which was lower than all the other curves. Enrichment values were close to expected ones (50%) but slightly surprising that 8 washes enriched a bit more than 16 washes.
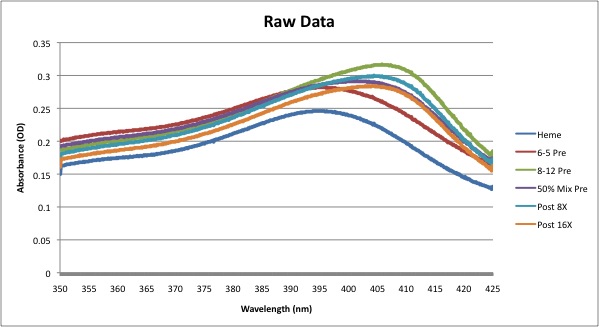
Raw Data: Raw Data: Media:Absorbance data.jpg |
| Green | 0.248; 0.245; 0.313; 0.253; 0.289; 0.287 |
10%, 12% | 64%, 61% | Before normalization of the Absorbance curves, the pre8-12 was much higher than the pre6-5 in the 380-385 region.
Our pre mix % was close to expected (~11.9%). Our hypothesized post values were different from the actual ones. We were surprised to see that the 8x sample had enrichment and that 16x showed decrease in enrichment. We hypothesized that the 8x sample would have 50% 8-12 and the 16x sample would have 80% 8-12. Relative positions of peaks are as expected. (Greater vertical shift corresponds to greater horizontal shift). Raw Data: Media:RawBindingAssayM1D7.png |
| Blue | 0.270; 0.267; 0.336; 0.303; 0.344; 0.374 |
50%, 52% | 106%, 155% | Our data showed a slight difference between the expected concentration of 8-12 aptamer in our
"pre" mixture and the measured concentration (respectively, 50% and 52%). This inconsistency could be due to pipetting errors or data normalization. The measurements for our "post" mixtures are both surprisingly high; it seems that we ended up with more aptamer than we had in our original "pre" samples. This is probably due to the fact that we had to estimate the average molecular weights of our "post" mixtures. We estimated 80% 8-12 in the 8-wash solution and 90% in the 16-wash solution. An overestimation would have led to such a discrepancy; it would have caused us to not dilute our samples enough before running them through the spectrophotometer to read high absorbance values. This would lead to a higher interpolated value for %8-12. On the other hand, the difference between our measured %8-12 in the "post" samples with 8 washes and 16 washes seemed reasonable (the direction, not necessarily magnitude). The sample with more washes ended up with a higher concentration of 8-12, which is what we wanted. Finally, our horizontal peak shifts were very consistent with our vertical ones. Though the peak values do not follow a linear trend, a rightward peak shift always corresponded with a higher absorbance. Corrected Data: Media:MWBlue-HemeBindingAssay.png |
| Pink | .273; .267; .268; .267; .280; .294 |
10%,-1% | 4 washes: 1219% 24 washes: 2541% |
Upon analysis of our data, it is clear that a mistake was made somewhere. We expected to see 10% 8-12 in our pre mixture. However, our absorbance data suggests that the 8-12 aptamer was not existent in our mixture. This speculation is based on the fact that our absorbance for the 6-5 aptamers at 405nm was .267 and .268 for the 8-12 aptamers. Because we did not have any 8-12 aptamers in the pre mixture, it is our hypothesis that we did not use the correct DNA template in our initial DNA library PCR. This error would explain the nonsensical values for post mixture. We will continue our analysis using T/R Green groups data. Please reference their data in your analysis.
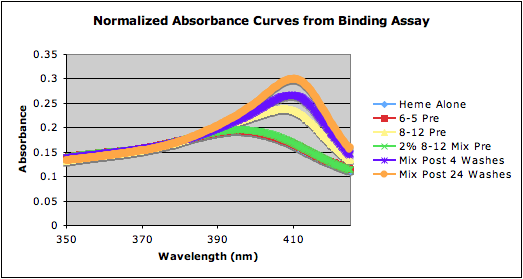
Media:MW_normalized_10%8-12.png
|
| Purple | .283, .277, .339,
.278, .319, .344 |
2%, .994% | 4 washes: 66.7%; 24 washes: 107.5% | Though our data show the correct shifts and trends, the numbers seem a bit off. The plots of our data show the expected shift to the right to match the vertical peak shift. Additionally, as we expected, the experiment that included more washes showed a larger increase in 8-12 percentage. However, our original estimates were very far off from the actual efficiency of our selection. We predicted a 10% increase in 8-12 for the 4 wash round and a 20% increase in 8-12 for the 24 wash round. However, our data suggest that our selection was much more efficient than that, and we believe that it was this skewed estimation of the molecular weight that caused us to make a mixture that was more concentrated than 8μM, resulting in a seemingly impossible result for the 24 wash experiment. The value we obtained for our pre mixture was on the right order of magnitude compared to our expected value of 2%, and we attribute the error to difficulties pipetting such small volumes of 8-12 aptamer to create such a diluted mixture.
 |
* Be sure to post the values you got after baseline correction, not the raw data (if your curves didn't line up)!
* Order: heme, 6-5, 8-12, "pre" mix, post low wash, post high wash
* Recommended syntax for A405 column: "#1 ; #2; #3 <br> #4; #5; #6"
[[]]
