Home
Lab 1
Lab 2
Lab 3
Lab 4
Essay
Glossary
Teacher's Resource Room
|
PDF of this page
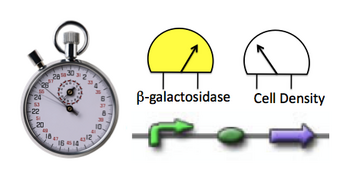
Lab 2: iTune device
- Evaluating promoter and RBS combinations to maximize beta-galactosidase output
Objectives
By the conclusion of this laboratory investigation, the student will be able to:
Introduction
As engineers, synthetic biologists engage in the “design--> build--> test” process. They design genetic devices by coupling together promoters, ribosome binding sites (RBS), open reading frames (ORF), and terminator sequences. They then build devices using techniques such as DNA synthesis, gel electrophoresis, polymerase chain reaction, and cloning. The synthetic biologists then test the function of the devices they’ve built, characterizing the cells that bear the devices through enzyme activity assays, fluorescent protein measurements or phenotype analysis. Depending on the device that’s being characterized, measurements may evaluate the speed of a device’s response, its sensitivity to environmental signals, or the level of a protein made by the device. It’s tempting to think that a strong quick level of response is always desired when designing genetic devices. However, depending on the role that the device will play in a system, it may be desirable to be able to tune the output to intermediate levels, or even to slow and low outputs in some cases.
Tuning genetic devices may be accomplished in many ways. One method controls the rate of transcription initiation by choosing a promoter of a particular efficiency or that’s active only under some conditions, for example. Another method involves translation control, modifying the strength of the ribosome binding site to increase or decrease the translation initiation rate. Finer tuning can be achieved by rational combination of the promoter and RBS elements. Predictable design, however, is confounded by the fact that some devices are not fully insulated from others in the cell and so might be affected by the system in which they must perform. Other devices demand a lot of the cell’s resources to run and so might slow a cell’s growth or protein production rates. These problems would be like a car in which the volume button on the radio also turned the steering wheel, or like a car in which the louder you played the radio, the slower the car could run. Problematic to say the least!
Thus measuring the performance of a device, even a rationally designed one, is still needed. As a starting point, we will consider a "reference device" that includes a strong log phase promoter, a strong RBS, a lacZ ORF that produces beta-galactosidase, and a transcriptional terminator sequence. Variants of this device are also available. All contain the same lacZ ORF and terminator sequence, but the devices vary in the efficiency (“strength”) of the promoters and RBSs. We will measure the output of each device, presuming that any difference in beta-galactosidase activity level will be due to the combination of promoter and RBS.
The lacZ ORF provides us with an easy method to measure the activity level of each promoter/ORF combination since the beta-galactosidase that is produced by the lacZ ORF allows the bacteria to metabolize lactose (see lac operon). Normally lactose is cleaved into two monosaccharides, galactose and glucose. However, we will provide the cells with ONPG (o-nitrophenyl-β-D-galactoside) rather than lactose. ONPG will be metabolized by the beta-galactosidase into galactose and o-nitrophenol, a yellow compound. The intensity of the yellow color formed will be proportional to the amount of beta-galactosidase enzyme that the device produced in the cell. We measure intensity of yellow color using a spec 20 or with visual comparisons to turbidity standards.
Procedure
Part 1: Culturing Bacteria
We will be receiving our bacteria with the plasmid already inserted. This culture will come in the form of a "stab" or "slant", a test tube with a small amount of bacteria on a slanted media. To continue the experiment we will have to further culture the bacteria.
Day 1:
- Using a sterile toothpick or inoculating loop, gather a small amount of bacteria from the stab and transfer it to a petri dish containing Luria Broth (LB) agar plus ampicillin medium.
- Repeat with the remaining stab samples, streaking out each onto a different petri dish.
- Place these cultures in a 37°C incubator overnight.
This video illustrates the technique used for this transfer:
Day 2:
- Using a sterile inoculating loop, transfer a bacterial colony from the petri dish to a large sterile culture tube containing 5 ml of Luria Broth, 50 μL IPTG and 5 μl of ampicillin.
- Repeat for each strain you will inoculate.
- Place the culture tubes in the roller wheel in the incubator at 37°C overnight. Be sure to balance the tubes across from each other to minimize stress on the roller wheel.
This video illustrates the general technique for setting up overnight liquid cultures, though you’ll be transferring cells from the petri dish to the Luria Broth.
Part 2: Beta-galactosidase assay
Procedure using a Spec 20
With this assay you will determine the amount of beta-galactosidase activity associated with each sample of cells. As a class you should try to perform replicate assays of each sample (so each strain gets measured two or three times) and then pool your class data to gain some confidence in the values you measure. A data table is included to help you organize your assay, but you can make one of your own if you prefer. Note that the volumes here are given for spectrophotometers that use glass test tube cuvettes.
- Make 3.0 ml of a 1:10 dilution of each cell sample, using Zbuffer as the diluent
- Measure the Absorbance at 600 nm (OD 600) of this dilution*. Record the value X 10 in the data table. This is the density of the undiluted cells.
- Add 1.0 ml of Zbuffer to 11 glass spectrophotometer tubes labeled B (blank), R (reference), and 1 though 9 (the samples).
- Add 30 μl of the cells (undiluted) to each tube. Add 30 ul of LB to tube B, to serve as your blank.
- Next you will lyse the cells by add 60 μl of 0.1% SDS and 50 μl of CHCl3 to each tube. Wear gloves when you add the CHCl3 and cap the tubes when you're done.
- Still wearing your gloves, vortex the tubes for 10 seconds each. You should time this step precisely since you want the replicates to be treated as identically as possible.
- Start the reactions by adding 300 μl of ONPG to each tube at 15 second intervals, including your blank.
- After 7 minutes, stop the reactions by adding 750 μl of Na2CO3 to each tube at 15 second intervals. Seven minutes is sufficient time to provide results that are yellow enough to give a reliable reading in the spectrophotometer, best between 0.1 and 1.0. Usually this color is approximately the same as that of a yellow tip for your pipetman. Don't be surprised when the Na2CO3 makes the reactions look more yellow. The reactions are now stable and can be set aside to read another day.
- If a microfuge is available, spin all the tubes for 1 minute at 13,000 RPM to pellet any cell debris.
- Read the absorbance of each sample tube at 420nm (OD 420)*. These values reflect the amount of yellow color in each tube.
- Calculate the beta-galactosidase activity in each sample according to the formula below.
If a spec 20 is not available
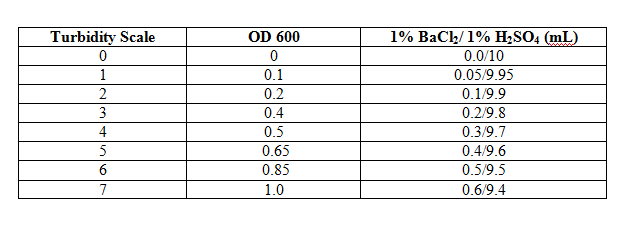
- The OD 600 can be estimated using Turbidity Standards. This method uses suspensions of a 1% BaCl2 in 1% H2SO4 at various concentrations and is modeled after the McFarland Turbidity Scale. These suspensions appear visually similar to suspensions of various populations of E coli.
- Following your teacher's instructions, obtain small clear test tubes containing the turbidity standards. The tubes should contain enough standard in each to fill the tube to a height of about 1 inch (2.5 cm) from the bottom. Make sure each tube is properly labeled with its turbidity standard number. If you are filling the tubes from stock bottles of the standards, use small tubes and place enough standard in each to fill the tube to a height of about 1 inch (2.5 cm) from the bottom.
- Place them in a test tube rack that allows you to view them from the side. Use small tubes and place enough standard in each to fill the tube to a height of about 1 inch (2.5 cm) from the bottom.
- On a blank index card or paper use a marker to draw two black lines. These lines should be within the height of the standards.
- Place the card with the lines behind the standards.
- To compare your bacterial cultures to the standards, you will need to place the bacterial sample in a test tube of the same size and equal volume as the standards. be sure to label these sample tubes.
- Place the sample tube next to the standard tubes. You should move the sample to compare it to the standard tubes with the most similar turbidity. You can make this assessment more precise by looking for a standard that most similarly obscures the black lines on the background card.
- Use the table below to determine the comparable OD 600.
- 1 OD 600 unit equals approximately 1 x 10⁹ cells.
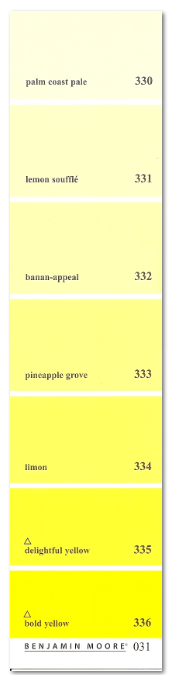
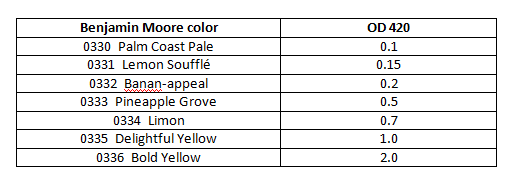
- The OD 420 can be estimated using Benjamin Moore paint chips. It is impossible to accurately reproduce these chips online. Color chips will be provided by your instructor.
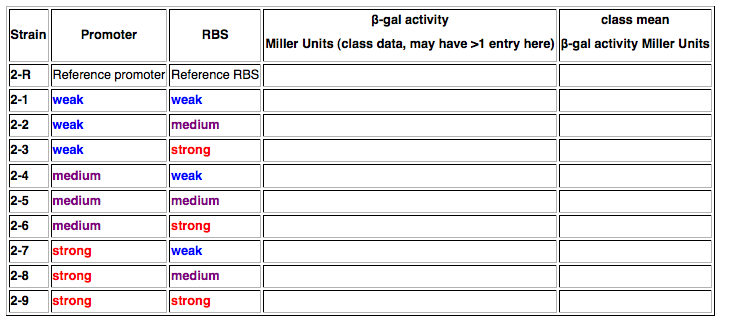
Data Table
In your lab notebook, you will need to construct a data table as shown below. If you are testing only a subset of the promoter and RBS collection, be sure to note which ones you are investigating:
- Tested Promoter (circle the experimental sample(s) you are measuring):
- Tested RBS (circle the experimental sample(s) you are measuring):

Calculations
The β-gal production is reported in Miller Units
1 Miller Unit = [math]\displaystyle{ 1000 * \frac{Abs{420}}{(t * v * Abs{600})} }[/math]
Where:
Abs 420 is the Spec 20 absorbance at 420 nm. It is a measure of the yellow color produced by the β-gal activity.
Abs 600 is the Spec 20 absorbance at 600 nm. It is a measure of the cell density.
t is the reaction time in minutes.
v is the culture volume in mls.
Summary Data Table
In your lab notebook, you will need to construct a data table as shown below. Fill in as many values as possible.
Lab Report
As you write, be sure to define and properly use all highlighted terms throughout the introduction and other parts of the lab.
Introduction:
- Provide a brief introduction describing the field of synthetic biology.
- Briefly describe the purpose of the lab. What are we trying to do here? Presume that a reader of your lab report has not read the assignment.
- Discuss the function of the promoter and the RBS. Relate your discussion to the function of the lac operon.
Methods:
- You do not have to rewrite the procedure.
- Explain why you did each step of the protocol.
Results:
- Present the data tables in clear format.
- Create a graph summarizing the results.
Discussion:
- Draw a conclusion: Were we able to tune this system?
- Describe the results: How do each of the promoter/RBS pairs compare? Did changing the promoters and changing the RBS have the same effect?
- Analyze the data: Be sure to discuss how each part of the experiment adds to your conclusion.
- Discuss errors and other reasons for data variability.
- How might experiments like this one help us learn about evolution?
Navigation
- Synthetic Biology and the High School Curriculum
- Synthetic Biology and the High School Curriculum: Lab 1
- Synthetic Biology and the High School Curriculum: Lab 2
- Synthetic Biology and the High School Curriculum: Lab 3
- Synthetic Biology and the High School Curriculum: Lab 4
- Synthetic Biology and the High School Curriculum: Essay
- Synthetic Biology and the High School Curriculum: Glossary
- Lab Report Rubric ( pdf) and Lab Report ScoreSheet ( pdf)
- Essay Rubric ( pdf) and Essay Scoresheet ( pdf)
- SynBio and the HS Curriculum Teacher's Resource Room
|


