Biomod/2014/ASU/Results: Difference between revisions
No edit summary |
No edit summary |
||
| Line 145: | Line 145: | ||
h1, h2, #super-list, .box, .tagline, #index-list { | h1, h2, #super-list, .box, .tagline, #index-list { | ||
font-family: | font-family: Times New Roman; | ||
} | } | ||
| Line 1,581: | Line 1,581: | ||
</div> | </div> | ||
<div class="box b1x2" data-symbol="description" data-category="student"> | <div class="box b1x2" data-symbol="description" data-category="student"> | ||
<p class = "serif" style = "color: #000000; font-size: 25px;"><span class = "mw-headline"> | <p class = "serif" style = "color: #000000; font-size: 25px;"><span class = "mw-headline">Characterization of DNA Antibody Formation and Structure</span></p> | ||
<hr> | <hr> | ||
<p style = "color: #000000; font-size: 16px;"> | <p style = "color: #000000; font-size: 16px;">The correct formation of the DNA antibody was analyzed by native gel and also confirmed using AFM (shown below in Figure R1). The dimensions of the DNA antibody were measured and these corresponded to the expected sizes from the design. The DNA tiles stack end to end, due to their hydrophobicity, to form long DNA snake-like structures. White dots were consistently seen in the center of each DNA antibody, corresponding to the increased height from the cluster of aptamer strands.</p><br> | ||
< | <img src = "http://openwetware.org/images/f/f9/Screen_Shot_2014-10-25_at_8.07.07_PM.png"> | ||
<img src = "http://openwetware.org/images/ | |||
<p style = "color: #000000; font-size: 16px;"> | <p class = "serif" style = "color: #000000; font-size: 25px;"><span class = "mw-headline">Positive Control DNA Antibody Binding to Alpha-Thrombin</span></p> | ||
<p style = "color: #000000; font-size: 16px;"> | <hr> | ||
<p style = "color: #000000; font-size: 16px;">These | <p style = "color: #000000; font-size: 16px;">Positive control DNA antibodies were constructed containing the aptamers with known sequences which had previously been shown to specifically bind alpha-thrombin protein at different sites1. For simplicity, these aptamers were labeled “aptamer A” and “aptamer B”. The DNA antibodies were created using the tile assembly protocol under the Protocols tab of the Experiment section. The sequence for the control aptamers are listed in Table E1 under the Materials tab.</p> | ||
<img src = "http://openwetware.org/images/ | <p style = "color: #000000; font-size: 16px;">The DNA antibodies were created to incorporate known the control aptamers in different positions on the tile. The number of aptamers and their orientation with respect to each other were also changed as illustrated in the schematic figure R1 below. Some of the DNA antibodies include a filler strand instead of an aptamer strand. This filler strand is made up of an oligo which only contains the sequence for the insertion into the tile such that when it binds, it “fills” the tile to be two dimensional.</p> | ||
<p style = "color: #000000; font-size: 16px;"> | <img src = "http://openwetware.org/images/0/08/Screen_Shot_2014-10-25_at_8.08.37_PM.png"> | ||
<p style = "color: #000000; font-size: 16px;"> | <p style = "color: #000000; font-size: 16px;">Positive control DNA antibodies were incubated at room temperature with alpha-thrombin and then were run on an 8% Native PAGE and imaged. This process is known as an Electrophoretic Mobility Shift Assay (EMSA).</p><br> | ||
<p style = "color: #000000; font-size: 16px;"> | <p style = "color: #000000; font-size: 16px;">There was an obvious shift in the gel bands between the lanes containing only DNA antibody and those containing DNA antibody incubated with protein. This indicates that the protein is binding the DNA antibodies which alters the progression through the gel. These shifts are seen for all of the positive control DNA antibodies indicating they all bound protein. </p> | ||
<img src = "http://openwetware.org/images/ | <img src = "http://openwetware.org/images/d/da/Screen_Shot_2014-10-25_at_8.12.28_PM.png"><br> | ||
<p style = "color: #000000; font-size: 16px;">These tiles also show another interesting result. The tile PCAB does not run exactly like PC2A nor PC1A but instead shows a further shift on the gel. We hypothesize that this is because PC2A has two of the same aptamers incorporated into the DNA tile, which can each bind a separate protein molecule. In contrast, it appears that the PCAB tile bound only a single protein.</p> | |||
<p class = "serif" style = "color: #000000; font-size: 25px;"><span class = "mw-headline">Alpha-Thrombin Selection to DNA Antibodies with Randomized Aptamers</span></p> | |||
<hr> | |||
<p style = "color: #000000; font-size: 16px;">A new pool of DNA antibodies were made incorporating aptamers with random sequences after previously confirming the binding between alpha-thrombin and the positive control DNA antibodies. A native gel of the EMSA representing DNA antibodies with randomized oligonucleotide aptamers is shown below in Figure R4. From this gel, it is difficult to tell whether or not the random aptamer tiles (AT2R’) in the protein-positive lanes have shifted. The double bands in AT2R’ were seen earlier in other DNA antibodies that incorporated two randomized oligonucleotides into the opposite sites as AT2R’. We suspect that this phenomenon occurs due to incomplete incorporation of the aptamer strands into the DNA tile. However, there is still a large band of DNA antibodies with correctly incorporated aptamers to provide a large enough selectable pool and in the future, a longer program when annealing oligo strands will be used. | |||
</p><br> | |||
<img src = "http://openwetware.org/images/c/cf/Screen_Shot_2014-10-25_at_8.13.18_PM.png"> | |||
<p style = "color: #000000; font-size: 16px;">To test whether the concentration of DNA tile bound to protein is too low to visualize with gel stain, a gel slice was cut from the region above 600 bp to just below the bottom of the well in lanes “AT2R’ w/o protein” and “AT2R’ w/ protein” separately, and the DNA eluted. These eluates were analyzed by PCR amplification using the randomized aptamer strands AT2R’, BT11A and BT16A (see Figure R5 below). </p> | |||
<img src = "http://openwetware.org/images/9/9f/Screen_Shot_2014-10-25_at_8.14.33_PM.png"> | |||
<p style = "color: #000000; font-size: 16px;">Results of the PCR from the gel slice in Figure R5 proved inconclusive, so we progressed to testing the binding of the DNA antibody to alpha-thrombin using a NHS ester bead affinity column as described in the Experimental Protocol section with strand BT11 apt-A (a positive control). BT11 apt-A, a simple aptamer strand, is very similar to aptamer A, which is shown to bind alpha-thrombin in Figure R6 below.</p> | |||
<img src = "http://openwetware.org/images/5/50/Screen_Shot_2014-10-25_at_8.15.35_PM.png"> | |||
<p style = "color: #000000; font-size: 16px;">This process was first tested using positive control aptamer BT11 and alpha-thrombin bound to NHS-ester bead. The DNA was mixed in a column and washed with buffer to remove any unbound DNA. Any DNA retained would be through binding to the alpha-thrombin protein. The DNA in resulting flowthroughs and column elutions were amplified using PCR and run on a 4% agarose gel and shown in Figure R7 below. </p> | |||
<img src = "http://openwetware.org/images/b/be/Screen_Shot_2014-10-25_at_8.16.33_PM.png"> | |||
<p style = "color: #000000; font-size: 16px;">Surprisingly, it was found that DNA appeared in all wash fractions , no matter how many washes were done before the final elution. Therefore, we decided to test if DNA was nonspecifically binding to the beads. A negative DNA strand (BT11A) with no affinity for alpha-thrombin was used to test this theory. It was expected that no band should be present in the sample eluted from the column as the alpha-thrombin protein attached to the beads does not bind the DNA aptamer. Yet a band was observed in each experimental lane of this gel at 46 bp, the length of BT11A DNA strand (see Figure R8 below). Minor bands attributed to primer dimerization during PCR also occurred at ~30 bp. The major bands are of similar strength across all lanes, and the column material appears to have amplified as much as the other eluates. This would suggest that the DNA strands bind to the column beads and that this method is not suitable to test the binding of the DNA antibody to the alpha-thrombin protein. Another column was run with no protein and it confirmed this result as again, DNA was present in all elution fractions even though no protein was present in the column. Therefore, the DNA must have been binding directly to the beads.</p> | |||
<img src = "http://openwetware.org/images/9/95/Screen_Shot_2014-10-25_at_8.20.41_PM.png"> | |||
<p class = "serif" style = "color: #000000; font-size: 25px;"><span class = "mw-headline">Amplification of aptamer strands for confirmation by sequencing</span></p> | |||
<hr> | |||
<p style = "color: #000000; font-size: 16px;">During the process of DNA antibody selection and regeneration, the aptamers were the only element to be amplified. Therefore, the selected and amplified aptamers could be used to enrich another pool of aptamer strands for incorporation into more DNA tiles. Primers were designed for amplification of the randomized aptamers, and a test was run to see if these primers would amplify the aptamer strands. A 5% agarose electrophoresis gel of the resulting PCR products shows that we were able to amplify aptamer inserts for every insert site (Figure R9). Although PCR was run on known aptamer sequences, primer sequences were the same for the randomized aptamers.</p> | |||
<img src = "http://openwetware.org/images/c/cf/Screen_Shot_2014-10-25_at_8.19.28_PM.png"> | |||
<p class = "serif" style = "color: #000000; font-size: 25px;"><span class = "mw-headline">Computational Simulations</span></p> | |||
<hr> | |||
<p style = "color: #000000; font-size: 16px;">A pdb file of the control DNA tile was generated using CaDNAno and Cando used for visualization. From there, Avogadro was used to generate aptamer sequence, and the aptamers were manually inserted into the tile at the insertion points using PyMol. The structure was formatted.</p> | |||
<p class = "serif" style = "color: #000000; font-size: 25px;"><span class = "mw-headline">References</span></p> | |||
<hr> | |||
<p style = "color: #000000; font-size: 16px;">1) Rinker, S., Ke, Y., Liu, Y. Chhabra, R., Yan, H. Self-assembled DNA nanostructures for distance-dependent multivalent ligand-protein binding. Nature Nanotechnology 3, 418-422 (2008)</p> | |||
<hr> | <hr> | ||
</div> | </div> | ||
Revision as of 03:23, 26 October 2014
<html xmlns="http://www.w3.org/1999/xhtml" xmlns:v="urn:schemas-microsoft-com:vml" xml:lang="en" lang="en" dir="ltr">
	<head>
		<title>Nanodevils - OpenWetWare</title>
		<style type="text/css" media="screen, projection">/*<![CDATA[*/
			@import "/skins/common/shared.css?164";
			@import "/skins/monobook/main.css?164";
		/*]]>*/</style>
		<link rel="stylesheet" type="text/css" media="print" href="/skins/common/commonPrint.css?164" />
		<script type= "text/javascript">/*<![CDATA[*/
var skin = "monobook";
var stylepath = "/skins";
var wgArticlePath = "/wiki/$1";
var wgScriptPath = "";
var wgScript = "/index.php";
var wgVariantArticlePath = false;
var wgActionPaths = [];
var wgServer = "http://openwetware.org";
var wgCanonicalNamespace = "";
var wgCanonicalSpecialPageName = false;
var wgNamespaceNumber = 0;
var wgPageName = "Biomod/2014/ASU";
var wgTitle = "Biomod/2014/ASU";
var wgAction = "view";
var wgArticleId = "136275";
var wgIsArticle = true;
var wgUserName = null;
var wgUserGroups = null;
var wgUserLanguage = "en";
var wgContentLanguage = "en";
var wgBreakFrames = false;
var wgCurRevisionId = "750826";
var wgVersion = "1.13.2";
var wgEnableAPI = true;
var wgEnableWriteAPI = false;
var wgMWSuggestTemplate = "http://openwetware.org/api.php?action=opensearch\x26search={searchTerms}\x26namespace={namespaces}";
var wgDBname = "owwdb";
var wgSearchNamespaces = [0, 1, 2, 3, 4, 5, 6, 7, 8, 9, 10, 11, 12, 13, 14, 15, 100, 101, 110, 111];
var wgMWSuggestMessages = ["with suggestions", "no suggestions"];
var wgRestrictionEdit = [];
var wgRestrictionMove = [];
/*]]>*/</script>
		<script type="text/javascript" src="/skins/common/wikibits.js?164"></script>
		<script type="text/javascript" src="/skins/common/ajax.js?164"></script>
		<script type="text/javascript" src="/ext/AjaxShowEditors/AjaxShowEditors.js"></script>
		<script type="text/javascript" src="/skins/common/mwsuggest.js?164"></script>
		<script type="text/javascript" src="/index.php?title=-&action=raw&gen=js&useskin=monobook"></script>
		<style type="text/css">/*<![CDATA[*/
@import "/index.php?title=MediaWiki:Common.css&usemsgcache=yes&action=raw&ctype=text/css&smaxage=18000";
@import "/index.php?title=MediaWiki:Monobook.css&usemsgcache=yes&action=raw&ctype=text/css&smaxage=18000";
@import "/index.php?title=-&action=raw&gen=css&maxage=18000&useskin=monobook";
/*]]>*/</style>
	</head>
<body class="mediawiki ns-0 ltr page-Biomod_2014_ASU">
<a name="top" id="top"></a>
Biomod/2014/ASU
From OpenWetWare
< <a href="/wiki/Biomod" title="Biomod">Biomod</a> | <a href="/wiki/Biomod/2014" title="Biomod/2014">2014</a>
<link rel="stylesheet" href="http://fonts.googleapis.com/css?family=Lato:300,100&subset=latin">
<script src="//ajax.googleapis.com/ajax/libs/jquery/1.10.2/jquery.min.js" ></script>
<script type"text/javascript">
$(function () {
$("style[media*='screen']").remove();
$("link[href*='favicon']").remove();
//fix heading
var h1 = $(".firstHeading").text().split("/");
$(".firstHeading").text(h1[h1.length-1]);
$("tr:odd").addClass("odd");
});
</script>
<style type="text/css">
/**** Base styles ****/
- column-one, #footer, div#sidebar-main, #contentSub, .firstHeading, #siteSub, #jump-to-nav, .printfooter{
display: none;
}
- content {
margin: 0;
padding: 0;
background: #fff;
border: none;
}
html, body, div, span, object, iframe,
h1, h2, h3, h4, h5, h6, p, blockquote, pre,
abbr, address, cite, code, del, dfn, em, img, ins, kbd, q, samp,
small, strong, sub, sup, var, b, i, dl, dt, dd, ol, ul, li,
fieldset, form, label, legend,
table, caption, tbody, tfoot, thead, tr, th, td,
article, aside, canvas, details, figcaption, figure,
footer, header, hgroup, menu, nav, section, summary,
time, mark, audio, video {
margin: 0;
padding: 0;
border: 0;
font: inherit;
}
article, aside, details, figcaption, figure,
footer, header, hgroup, menu, nav, section {
display: block;
}
body {
/*padding: 15px;*/
font-family: 'Lato', 'Lucida Sans Regular', 'Lucida Grande', 'Lucida Sans Unicode', Arial, sans-serif;
font-size: 2rem;
font-weight: 200;
line-height: 1.4;
background: #fff;
color: #000000;
max-width: 1280px;
padding-top: 55px;
margin-left: auto;
margin-right: auto;
}
}
h1, h2, h3, p, ul, ol, pre, dl {
font-weight: 100;
}
h1, h2, #super-list, .box, .tagline, #index-list {
font-family: Times New Roman;
}
h1, h2, h3 { font-weight: 300; }
h1 {
font-size: 16px;
line-height: 1.1em;
}
h2 {
font-size: 22px;
}
a,
a code {
color: #FB4;
text-decoration: none;
}
a:hover,
a:hover code {
color: #FFCC00;
}
a:active,
a:active code {
color: #000000;
/*background: black;*/
}
a img { border: none; }
a.anchor{display: block; position: relative; visibility: hidden;}
p{
text-align:left;
}
em { color: #00EF00; }
strong { font-weight: bold; }
blockquote {
padding-left: 1.0em;
margin-left: 1.0em;
border-left: 1px solid #333;
font-style: italic;
}
nav {
background: rgba(25, 25, 25, 0.85);
padding: 0px;
position: fixed;
top: 0px;
left: 0px;
bottom: 0px;
right: 0px;
z-index: 100;
}
nav ul {
width: 100%;
margin: 0px auto;
padding: 0px;
list-style-type: none;
}
nav ul li {
float: left;
line-height:2.5;
}
nav ul li.selected {
border-bottom: solid 10px #580000;
}
nav ul li.home {
padding: 0px;
}
nav ul a {
float: left;
text-decoration: none;
color: #F2F2F2;
text-transform: uppercase;
font-size: 20px;
font-weight: 300;
padding: 0px 20px 0;
}
- content {
margin-top: 60px;
}
- filters > li{
margin: 0px;
display: inline-block;
}
.box.clickable:hover{
background: none repeat scroll 0 0 #fff;
}
.clickable img {
transition: 0.3s ease;
}
.clickable img:hover {
opacity:0.9;
transition: 0.3s ease;
}
.background {
left: 0;
margin: 0;
max-width: 100%;
padding: 0;
}
/*the boxes*/
.box.b2x2{
height: 300px;
width: 300px;
position: fixed;
}
.box.b2x2 > img{
display: block;
margin-left: auto;
margin-right: auto;
margin-top: 10px;
height: 300px;
width: 300px;
position: fixed;
}
.box.b2x1{
height: 360px;
}
.box.b1x2{
width: 930px;
height: 2200px;
}
.box.b1x3{
width: 700px;
}
/*start page*/
.box.intro { font-size:7.2rem;}
.box > p {
font-size: 16px;
padding: 0 20px;
margin-top: 10px;
text-align: justify;
font-weight: 300;
}
.box > h2 {
font-size: 20px;
font-weight: 100;
text-align:left;
margin-left: 20px;
margin-top: 15px;
}
.tease > h2 {
font-size: 40px;
font-weight: 100;
margin-top: 80px;
}
/*project*/
.project{
background-attachment: fixed;
width: 100%;
padding-bottom: 40px;
}
.project h2 {
color: #FFFFFF;
font-weight: 300;
margin-bottom: 30px;
margin-left: 180px;
padding-top: 20px;
position: relative;
}
.project h3 {
font-size: 26px;
}
.project .box {
margin-bottom: 20px;
margin-top: 0;
}
.interlude{
background: none repeat scroll 0 0 #2A2A2A;
box-shadow: 0 0 25px rgba(0, 0, 0, 0.8);
border: 1px solid rgba(0, 0, 0, 0.3);
height: 150px;
position: relative;
z-index: 3;
}
.interlude *{
float:left;
}
.interlude h2{
color: #FFFFFF;
display: block;
font-weight: 300;
line-height: 150px;
margin-left: 24%;
margin-right: -14%;
width: 50%;
}
.interlude img{
float: left;
line-height: 150px;
margin-left: 10%;
margin-top: 25px;
vertical-align: middle;
}
.clear{
clear: both;
}
.project_box{
background: none repeat scroll 0 0 #FFFFFF;
color: #000000;
display: block;
float: left;
font-size: 18px;
font-weight: 300;
line-height: 1.6;
margin-left: auto;
margin-right: auto;
overflow: hidden;
padding: 10px;
width: 50%;
}
.figure_box{
display: block;
float: left;
margin-left: 20px;
overflow: hidden;
width: 230px;
}
/*se*/
.project_box h2{
color: #1A1A1A;
display: block;
font-weight: 300;
margin-left: 0%;
margin-right: -10%;
width: 90%;
}
.project_box p{
text-align: justify;
margin-bottom: 18px;
}
.project_box li {
margin-left:50px
}
- pb_mot.project_box{
height: 350px;
}
- pb_dna_scaff.project_box{
height: 400px;
}
- pb_dna_req.project_box{
height: 250px;
}
- pb_poly_intro.project_box{
/*right: -20%;*/
height: 200px;
}
- pb_poly_pmoxa.project_box{
/*right: -20%;*/
height: 600px;
width: 1000px;
overflow:scroll;
}
- pb_ir.project_box{
/*right: -20%;*/
height: 1300px;
}
- pb_poly_cp.project_box{
/*right: -20%;*/
height: 600px;
}
/*team page*/
.bio_box {
background: none repeat scroll 0 0 #E74C3C;
float: left;
font-size: 15px;
height: 440px;
padding: 15px;
text-align: justify;
width: 210px;
}
.bio_box > .name{
font-size: 24px;
font-weight: 300;
margin-bottom: 25px;
text-align: center;
width: 100%;
}
.bio_box > p{
text-align: justify;
font-weight: 300;
font-size: 16px;
}
.box.big img{
opacity:1;
}
.flag > *{
float:left;
}
.flag > p{
font-size: 18px;
position: relative;
text-align: center;
top: -6px;
width: 75%;
margin-bottom: 10px;
}
- team .big{
opacity:1;
}
.head{
width:220px;
float:left;
}
/*sponsor page*/
- sponsors .box {
background: none repeat scroll 0 0 white;
}
- sponsors figcaption {
height: 65px;
width: 100%;
font-size: 15px;
font-weight: 300;
top: auto;
bottom: 0;
opacity: 0;
transform: translateY(100%);
transition: transform 0.4s, opacity 0.1s 0.3s;
-webkit-transform: translateY(100%);
-webkit-transition: -webkit-transform 0.4s, opacity 0.1s 0.3s;
}
- sponsors .descr{
background: none repeat scroll 0 0 rgba(0, 0, 0, 0.4);
font-size: 12px;
font-weight: 300;
height: 60px;
margin: 0;
padding-left: 10px;
padding-right: 10px;
padding-top: 10px;
text-align: justify;
top: -155px;
line-height: 1.3;
}
- sponsors .descr p{
width:90%;
margin-left:auto;
margin-right:auto;
}
- sponsors figure.clickable:hover figcaption{
opacity: 1;
transform: translateY(0px);
transition: transform 0.4s, opacity 0.1s;
-webkit-transform: translateY(0px);
-webkit-transition: -webkit-transform 0.4s, opacity 0.1s;
}
- sponsors figure:hover .descr{
opacity: 1;
transform: translateY(155px);
transition: transform 0.4s, opacity 0.1s;
-webkit-transform: translateY(155px);
-webkit-transition: -webkit-transform 0.4s, opacity 0.1s;
}
/*gallery*/
- gallery .box img{
min-height: 220px;
min-width: 220px;
}
/*ptocols*/
.protocol_box{
background: none repeat scroll 0 0 #FFFFFF;
color: #000000;
display: block;
float: left;
font-size: 18px;
font-weight: 300;
line-height: 1.6;
margin-left: 40px;
margin-right: auto;
overflow: hidden;
padding: 10px;
width: 66%;
}
.protocol_box li {
margin-left:50px
}
.protocol_box p{
text-align: justify;
margin-top: 18px;
}
.protocol_box h1 {
font-size: 30px;
}
.protocol_box h2 {
font-size: 24px;
}
.protocol_box h3 {
font-size: 22px;
}
/*Outreach*/
.outreach_box{
background: none repeat scroll 0 0 #FFFFFF;
color: #000000;
display: block;
float: left;
font-size: 18px;
font-weight: 300;
line-height: 1.6;
margin-left: 10px;
margin-right: auto;
overflow: hidden;
padding: 10px;
width: 70%;
}
.outreach_box li {
margin-left:50px
}
/*Acknowlegement*/
.ack_box{
background: none repeat scroll 0 0 #FFFFFF;
color: #000000;
text-align: center;
display: block;
float: left;
font-size: 18px;
font-weight: 300;
line-height: 1.6;
margin-left: 10px;
margin-right: auto;
overflow: hidden;
padding: 10px;
width: 80%;
}
.ack_box p {
text-align: center;
}
.next, .prev{
z-index: 99;
background-image: url("http://openwetware.org/images/5/55/Fancybox_sprite.png");
width: 36px;
height: 36px;
top: 200px;
}
figure.box > .next {
left: 425px;
background-position: 0 -72px;
}
figure.box > .prev {
background-position: 0 -36px;
}
/**** Isotope styles ****/
/* required for containers to inherit vertical size from window */
html,
body {
height: 100%;
}
- container {
padding: 0px;
bottom-margin: 10px;
}
.box {
width: 220px;
height: 220px;
margin: 10px;
float: left;
overflow: hidden;
position: fixed;
background: #fff;
color: #000000;
display: table-cell;
text-align: center;
vertical-align: middle;
overflow:hidden;
}
div#b2x2{ position:fixed;}
figure.box > *{
left: 0;
position: absolute;
right: 0;
}
.box figure{
overflow: hidden;
}
.box figcaption {
background: none repeat scroll 0 0 rgba(0, 0, 0, 0.4);
bottom: 0;
font-size: 20px;
font-weight: 300;
padding-left: 5px;
text-align: center;
width: 100%;
z-index: 4;
}
.clickable .box:hover {
cursor: pointer;
}
/* The Magnificent Clearfix: nicolasgallagher.com/micro-clearfix-hack/ */
.clearfix:before, .clearfix:after { content: ""; display: table; }
.clearfix:after { clear: both; }
.clearfix { zoom: 1; }
/* Start: Recommended Isotope styles */
/**** Isotope Filtering ****/
.isotope-item {
z-index: 2;
}
.isotope-hidden.isotope-item {
pointer-events: none;
z-index: 1;
}
/**** Isotope CSS3 transitions ****/
.isotope,
.isotope .isotope-item {
-webkit-transition-duration: 0.8s;
-moz-transition-duration: 0.8s;
-ms-transition-duration: 0.8s;
-o-transition-duration: 0.8s;
transition-duration: 0.8s;
}
.isotope {
-webkit-transition-property: height, width;
-moz-transition-property: height, width;
-ms-transition-property: height, width;
-o-transition-property: height, width;
transition-property: height, width;
}
.isotope .isotope-item {
-webkit-transition-property: -webkit-transform, opacity;
-moz-transition-property: -moz-transform, opacity;
-ms-transition-property: -ms-transform, opacity;
-o-transition-property: -o-transform, opacity;
transition-property: transform, opacity;
}
.rs-wrap:after,
.rs-slider:after,
.rs-thumb-wrap:after,
.rs-arrows:after,
.rs-caption:after {
content: ".";
display: block;
height: 0;
clear: both;
line-height: 0;
visibility: hidden;
}
/* ===[ Slider ]=== */
.rs-wrap {
position: relative;
max-width: 100%;
}
.rs-slide-bg { *zoom: 1 }
.rs-slider > li > a { display: block }
.rs-slider > li {
list-style: none;
filter: alpha(opacity=0);
opacity: 0;
width: 100%;
height: 100%;
margin: 0 -100% 0 0;
padding: 0;
float: left;
position: relative;
}
.rs-slider > li > a {
padding: 0;
background: none;
-webkit-border-radius: 0;
-moz-border-radius: 0;
border-radius: 0;
}
.rs-slider > li img {
display: block;
max-width: 100%;
max-height: 100%;
-ms-interpolation-mode: bicubic;
}
/* ===[ Thumbnails ]=== */
.rs-thumb-wrap { *zoom: 1 }
.rs-thumb-wrap > a {
display: block;
float: left;
position: relative;
-moz-box-sizing: border-box;
-webkit-box-sizing: border-box;
box-sizing: border-box;
-webkit-backface-visibility: hidden; /* Hardware accelerate to prevent jumps on transition */
}
.rs-thumb-wrap > a > img {
max-width: 100%;
max-height: 100%;
display: block;
-ms-interpolation-mode: bicubic;
}
.rs-thumb-wrap > a:first-child { margin-left: 0!important }
/* ===[ Arrows ]=== */
.rs-arrows .rs-next,
.rs-arrows .rs-prev { z-index: 1; background-image: url("fancybox_sprite.png");}
.rs-arrows .rs-next,
.rs-arrows .rs-prev { z-index: 1; background-image: url("fancybox_sprite.png");}
.rs-arrows:hover .rs-next,
.rs-arrows:hover .rs-prev { z-index: 2; }
/* ===[ Captions ]=== */
.rs-caption {
position: absolute;
max-height: 100%;
overflow: auto;
-moz-box-sizing: border-box;
-webkit-box-sizing: border-box;
box-sizing: border-box;
bottom: 0;
left: 0;
}
.rs-caption.rs-top-left {
top: 0;
bottom: auto;
}
.rs-caption.rs-top-right {
top: 0;
right: 0;
left: auto;
bottom: auto;
}
.rs-caption.rs-bottom-left {
bottom: 0;
left: 0;
}
.rs-caption.rs-bottom-right {
right: 0;
left: auto;
border-bottom: none;
border-right: none;
}
.rs-caption.rs-top {
top: 0;
bottom: auto;
width: 100%!important;
}
.rs-caption.rs-bottom { width: 100%!important }
.rs-caption.rs-left {
top: 0;
height: 100%;
}
.rs-caption.rs-right {
top: 0;
left: auto;
right: 0;
height: 100%;
}
/* ===[ Grid ]=== */
.rs-grid {
position: absolute;
overflow: hidden;
width: 100%;
height: 100%;
display: none;
}
.rs-gridlet {
position: absolute;
opacity: 1;
}
/* Optional - remove captions at smaller screen widths
@media screen and (max-width: 480px) {
.rs-caption { opacity: 0!important; }
}
- /
.project_box > img {
margin-left: 90px;
}
- protocols, #polymers_protocols, #origami_protocols, #reaction_protocols, #nanocontainer_protocols, #imaging_protocols {
font-size: 20px;
font-weight: 300;
margin-bottom: 30px;
margin-left: 50px;
}
- protocols > h2, #polymers_protocols > h2, #origami_protocols > h2, #reaction_protocols > h2, #nanocontainer_protocols > h2, #imaging_protocols > h2 {
margin-bottom: 20px;
margin-top: 20px;
}
- protocols .interlude, #polymers_protocols .interlude, #origami_protocols .interlude, #reaction_protocols .interlude, #nanocontainer_protocols .interlude, #imaging_protocols .interlude {
margin-left: -50px !important;
}
- protocols > ul {
margin-bottom: 30px;
margin-left: 30px;
margin-top: 20px;
}
li > ul {
margin-left: 10px;
}
/*achievement*/
.achievement_box{
background: none repeat scroll 0 0 #FFFFFF;
color: #000000;
display: block;
float: left;
font-size: 18px;
font-weight: 300;
line-height: 1.6;
margin-left: 180px;
margin-right: auto;
overflow: hidden;
padding: 10px;
width: 50%;
}
- subnav-sticky-wrapper {
height: 5px !important;
}
table {
border-collapse: collapse;
margin: auto auto 40px;
width: 635px;;
}
th {
background-color: #5F5F5F;
border: 1px solid #999999;
color: #FFFFFF;
}
tr td {
border: 1px solid #999999;
text-align: center;
}
tr.odd td {
background-color: #EEEEEE;
color: #000000;
}
.ref li {
font-size: 14px;
font-weight: 300;
}
</style>
<link href="http://openwetware.org/images/2/29/Nano_icon.png" rel="shortcut icon">
<script src="https://biomod2013.googlecode.com/svn/trunk/js/jquery.isotope.min.js"></script>
<script src="https://biomod2013.googlecode.com/svn/trunk/js/jquery.refineslide.min.js"></script>
<script type="text/javascript" src="http://biomod2013.googlecode.com/svn/trunk/js/fb/jquery.fancybox.pack.js"></script>
<script type="text/javascript" src="http://biomod2013.googlecode.com/svn/trunk/js/fb/helpers/jquery.fancybox-buttons.js"></script>
<script type="text/javascript" src="http://biomod2013.googlecode.com/svn/trunk/js/fb/helpers/jquery.fancybox-media.js"></script>
<script type="text/javascript" src="http://biomod2013.googlecode.com/svn/trunk/js/fb/helpers/jquery.fancybox-thumbs.js"></script>
<script type="text/javascript" src="http://biomod2013.googlecode.com/svn/trunk/js/jquery.easing.min.js"></script>
<script type="text/javascript" src="http://biomod2013.googlecode.com/svn/trunk/js/jquery.scrollUp.min.js"></script>
<script type="text/javascript" src="http://biomod2013.googlecode.com/svn/trunk/js/jquery.stellar.min.js"></script>
<script type="text/javascript" src="http://biomod2013.googlecode.com/svn/trunk/js/jquery.sticky.js"></script>
<script type="text/javascript" src="http://biomod2013.googlecode.com/svn/trunk/js/jquery.scrollTo.min.js"></script>
<script type="text/javascript" src="http://biomod2013.googlecode.com/svn/trunk/js/jquery.localscroll.min.js"></script>
<script>
(function(i,s,o,g,r,a,m){i['GoogleAnalyticsObject']=r;i[r]=i[r]||function(){
(i[r].q=i[r].q||[]).push(arguments)},i[r].l=1*new Date();a=s.createElement(o),
m=s.getElementsByTagName(o)[0];a.async=1;a.src=g;m.parentNode.insertBefore(a,m)
})(window,document,'script','//www.google-analytics.com/analytics.js','ga');
ga('create', 'UA-45176973-1', 'openwetware.org');
ga('send', 'pageview');
</script>
<style type="text/css">
/*! fancyBox v2.1.5 fancyapps.com | fancyapps.com/fancybox/#license */
.fancybox-wrap,
.fancybox-skin,
.fancybox-outer,
.fancybox-inner,
.fancybox-image,
.fancybox-wrap iframe,
.fancybox-wrap object,
.fancybox-nav,
.fancybox-nav span,
.fancybox-tmp
{
padding: 0;
margin: 0;
border: 0;
outline: none;
vertical-align: top;
}
.fancybox-wrap {
position: absolute;
top: 0;
left: 0;
z-index: 8020;
}
.fancybox-skin {
position: relative;
background: #f9f9f9;
color: #444;
text-shadow: none;
-webkit-border-radius: 4px;
-moz-border-radius: 4px;
border-radius: 4px;
}
.fancybox-opened {
z-index: 8030;
}
.fancybox-opened .fancybox-skin {
-webkit-box-shadow: 0 10px 25px rgba(0, 0, 0, 0.5);
-moz-box-shadow: 0 10px 25px rgba(0, 0, 0, 0.5);
box-shadow: 0 10px 25px rgba(0, 0, 0, 0.5);
}
.fancybox-outer, .fancybox-inner {
position: relative;
}
.fancybox-inner {
overflow: hidden;
}
.fancybox-type-iframe .fancybox-inner {
-webkit-overflow-scrolling: touch;
}
.fancybox-error {
color: #444;
font: 14px/20px "Helvetica Neue",Helvetica,Arial,sans-serif;
margin: 0;
padding: 15px;
white-space: nowrap;
}
.fancybox-image, .fancybox-iframe {
display: block;
width: 100%;
height: 100%;
}
.fancybox-image {
max-width: 100%;
max-height: 100%;
}
- fancybox-loading, .fancybox-close, .fancybox-prev span, .fancybox-next span {
background-image: url('http://openwetware.org/images/5/55/Fancybox_sprite.png');
}
- fancybox-loading {
position: fixed;
top: 50%;
left: 50%;
margin-top: -22px;
margin-left: -22px;
background-position: 0 -108px;
opacity: 0.8;
cursor: pointer;
z-index: 8060;
}
- fancybox-loading div {
width: 44px;
height: 44px;
background: url('http://openwetware.org/images/d/d0/Fancybox_loading.gif') center center no-repeat;
}
.fancybox-close {
position: absolute;
top: -18px;
right: -18px;
width: 36px;
height: 36px;
cursor: pointer;
z-index: 8040;
}
.fancybox-nav {
position: absolute;
top: 0;
width: 40%;
height: 100%;
cursor: pointer;
text-decoration: none;
background: transparent url('http://openwetware.org/images/c/c0/Blank.gif'); /* helps IE */
-webkit-tap-highlight-color: rgba(0,0,0,0);
z-index: 8040;
}
.fancybox-prev {
left: 0;
}
.fancybox-next {
right: 0;
}
.fancybox-nav span {
position: absolute;
top: 50%;
width: 36px;
height: 34px;
margin-top: -18px;
cursor: pointer;
z-index: 8040;
visibility: hidden;
}
.fancybox-prev span {
left: 10px;
background-position: 0 -36px;
}
.fancybox-next span {
right: 10px;
background-position: 0 -72px;
}
.fancybox-nav:hover span {
visibility: visible;
}
.fancybox-tmp {
position: absolute;
top: -99999px;
left: -99999px;
visibility: hidden;
max-width: 99999px;
max-height: 99999px;
overflow: visible !important;
}
/* Overlay helper */
.fancybox-lock {
overflow: hidden !important;
width: auto;
}
.fancybox-lock body {
overflow: hidden !important;
}
.fancybox-lock-test {
overflow-y: hidden !important;
}
.fancybox-overlay {
position: absolute;
top: 0;
left: 0;
overflow: hidden;
display: none;
z-index: 8010;
background: url('http://openwetware.org/images/e/e0/Fancybox_overlay.png');
}
.fancybox-overlay-fixed {
position: fixed;
bottom: 0;
right: 0;
}
.fancybox-lock .fancybox-overlay {
overflow: auto;
overflow-y: scroll;
}
/* Title helper */
.fancybox-title {
visibility: hidden;
font: normal 13px/20px "Helvetica Neue",Helvetica,Arial,sans-serif;
position: relative;
text-shadow: none;
z-index: 8050;
}
.fancybox-opened .fancybox-title {
visibility: visible;
}
.fancybox-title-float-wrap {
position: absolute;
bottom: 0;
right: 50%;
margin-bottom: -35px;
z-index: 8050;
text-align: center;
}
.fancybox-title-float-wrap .child {
display: inline-block;
margin-right: -100%;
padding: 2px 20px;
background: transparent; /* Fallback for web browsers that doesn't support RGBa */
background: rgba(0, 0, 0, 0.8);
-webkit-border-radius: 15px;
-moz-border-radius: 15px;
border-radius: 15px;
text-shadow: 0 1px 2px #222;
color: #FFF;
font-weight: bold;
line-height: 24px;
white-space: nowrap;
}
.fancybox-title-outside-wrap {
position: relative;
margin-top: 10px;
color: #fff;
}
.fancybox-title-inside-wrap {
padding-top: 10px;
}
.fancybox-title-over-wrap {
position: absolute;
bottom: 0;
left: 0;
color: #fff;
padding: 10px;
background: #000;
background: rgba(0, 0, 0, .8);
}
/*Retina graphics!*/
@media only screen and (-webkit-min-device-pixel-ratio: 1.5),
only screen and (min--moz-device-pixel-ratio: 1.5),
only screen and (min-device-pixel-ratio: 1.5){
#fancybox-loading, .fancybox-close, .fancybox-prev span, .fancybox-next span {
background-image: url('http://openwetware.org/images/b/b8/Fancybox_sprite%402x.png');
background-size: 44px 152px; /*The size of the normal image, half the size of the hi-res image*/
}
#fancybox-loading div {
background-image: url('http://openwetware.org/images/0/01/Fancybox_loading%402x.gif');
background-size: 24px 24px; /*The size of the normal image, half the size of the hi-res image*/
}
}
- fancybox-buttons {
position: fixed;
left: 0;
width: 100%;
z-index: 8050;
}
- fancybox-buttons.top {
top: 10px;
}
- fancybox-buttons.bottom {
bottom: 10px;
}
- fancybox-buttons ul {
display: block;
width: 166px;
height: 30px;
margin: 0 auto;
padding: 0;
list-style: none;
border: 1px solid #111;
border-radius: 3px;
-webkit-box-shadow: inset 0 0 0 1px rgba(255,255,255,.05);
-moz-box-shadow: inset 0 0 0 1px rgba(255,255,255,.05);
box-shadow: inset 0 0 0 1px rgba(255,255,255,.05);
background: rgb(50,50,50);
background: -moz-linear-gradient(top, rgb(68,68,68) 0%, rgb(52,52,52) 50%, rgb(41,41,41) 50%, rgb(51,51,51) 100%);
background: -webkit-gradient(linear, left top, left bottom, color-stop(0%,rgb(68,68,68)), color-stop(50%,rgb(52,52,52)), color-stop(50%,rgb(41,41,41)), color-stop(100%,rgb(51,51,51)));
background: -webkit-linear-gradient(top, rgb(68,68,68) 0%,rgb(52,52,52) 50%,rgb(41,41,41) 50%,rgb(51,51,51) 100%);
background: -o-linear-gradient(top, rgb(68,68,68) 0%,rgb(52,52,52) 50%,rgb(41,41,41) 50%,rgb(51,51,51) 100%);
background: -ms-linear-gradient(top, rgb(68,68,68) 0%,rgb(52,52,52) 50%,rgb(41,41,41) 50%,rgb(51,51,51) 100%);
background: linear-gradient(top, rgb(68,68,68) 0%,rgb(52,52,52) 50%,rgb(41,41,41) 50%,rgb(51,51,51) 100%);
filter: progid:DXImageTransform.Microsoft.gradient( startColorstr='#444444', endColorstr='#222222',GradientType=0 );
}
- fancybox-buttons ul li {
float: left;
margin: 0;
padding: 0;
}
- fancybox-buttons a {
display: block;
width: 30px;
height: 30px;
text-indent: -9999px;
background-color: transparent;
background-image: url('fancybox_buttons.png');
background-repeat: no-repeat;
outline: none;
opacity: 0.8;
}
- fancybox-buttons a:hover {
opacity: 1;
}
- fancybox-buttons a.btnPrev {
background-position: 5px 0;
}
- fancybox-buttons a.btnNext {
background-position: -33px 0;
border-right: 1px solid #3e3e3e;
}
- fancybox-buttons a.btnPlay {
background-position: 0 -30px;
}
- fancybox-buttons a.btnPlayOn {
background-position: -30px -30px;
}
- fancybox-buttons a.btnToggle {
background-position: 3px -60px;
border-left: 1px solid #111;
border-right: 1px solid #3e3e3e;
width: 35px
}
- fancybox-buttons a.btnToggleOn {
background-position: -27px -60px;
}
- fancybox-buttons a.btnClose {
border-left: 1px solid #111;
width: 35px;
background-position: -56px 0px;
}
- fancybox-buttons a.btnDisabled {
opacity : 0.4;
cursor: default;
}
- fancybox-thumbs {
position: fixed;
left: 0;
width: 100%;
overflow: hidden;
z-index: 8050;
}
- fancybox-thumbs.bottom {
bottom: 2px;
}
- fancybox-thumbs.top {
top: 2px;
}
- fancybox-thumbs ul {
position: relative;
list-style: none;
margin: 0;
padding: 0;
}
- fancybox-thumbs ul li {
float: left;
padding: 1px;
opacity: 0.5;
}
- fancybox-thumbs ul li.active {
opacity: 0.75;
padding: 0;
border: 1px solid #fff;
}
- fancybox-thumbs ul li:hover {
opacity: 1;
}
- fancybox-thumbs ul li a {
display: block;
position: relative;
overflow: hidden;
border: 1px solid #222;
background: #111;
outline: none;
}
- fancybox-thumbs ul li img {
display: block;
position: relative;
border: 0;
padding: 0;
max-width: none;
}
p.serif {
font-family: "Times New Roman", Times, serif;
}
.box.b1x3{
width: 853px;
height: 465px;
}
- b2x2
{
position:fixed;
}
- main-nav {
width: 100%;
height: 67px;
background: #f2f2f2;
}
- main-nav .subnav {
display: none;
position: absolute;
top: 67px;
left: 0px;
right:0px;
width: 100%;
list-style-type: none;
background: #f2f2f2;
margin: 0;
border:solid 1px #eeeeee;
z-index:5;
padding:0;
}
- main-nav .subnav li {
display: block;
border-bottom: solid 1px #580000;
margin:0;
}
- main-nav .subnav li a {
color: #333;
height:18px;
font-size:20px;
}
- main-nav .subnav li a:hover {
background:#f9f9f9;
}
- nav-primary {
list-style-type: none;
margin: 0;
float: left;
padding:0;
}
- nav-primary li {
float: left;
position: relative;
}
- nav-primary li a {
float: left;
color: #000;
text-align: center;
font-size: 20px;
height: 40px;
padding-top: 35px;
line-height: 13px;
width:120px;
text-decoration:none;
}
- nav-primary li a:hover {
text-decoration:none;
color:#FFCC00;
}
- nav-primary li:hover .subnav {
display: block;
}
</style>
<nav id = "main-nav">
</nav>
<img src = "http://openwetware.org/images/1/1b/Rsz_ascube.png">
Characterization of DNA Antibody Formation and Structure
The correct formation of the DNA antibody was analyzed by native gel and also confirmed using AFM (shown below in Figure R1). The dimensions of the DNA antibody were measured and these corresponded to the expected sizes from the design. The DNA tiles stack end to end, due to their hydrophobicity, to form long DNA snake-like structures. White dots were consistently seen in the center of each DNA antibody, corresponding to the increased height from the cluster of aptamer strands.
<img src = "http://openwetware.org/images/f/f9/Screen_Shot_2014-10-25_at_8.07.07_PM.png">
Positive Control DNA Antibody Binding to Alpha-Thrombin
Positive control DNA antibodies were constructed containing the aptamers with known sequences which had previously been shown to specifically bind alpha-thrombin protein at different sites1. For simplicity, these aptamers were labeled “aptamer A” and “aptamer B”. The DNA antibodies were created using the tile assembly protocol under the Protocols tab of the Experiment section. The sequence for the control aptamers are listed in Table E1 under the Materials tab.
The DNA antibodies were created to incorporate known the control aptamers in different positions on the tile. The number of aptamers and their orientation with respect to each other were also changed as illustrated in the schematic figure R1 below. Some of the DNA antibodies include a filler strand instead of an aptamer strand. This filler strand is made up of an oligo which only contains the sequence for the insertion into the tile such that when it binds, it “fills” the tile to be two dimensional.
<img src = "http://openwetware.org/images/0/08/Screen_Shot_2014-10-25_at_8.08.37_PM.png">
Positive control DNA antibodies were incubated at room temperature with alpha-thrombin and then were run on an 8% Native PAGE and imaged. This process is known as an Electrophoretic Mobility Shift Assay (EMSA).
There was an obvious shift in the gel bands between the lanes containing only DNA antibody and those containing DNA antibody incubated with protein. This indicates that the protein is binding the DNA antibodies which alters the progression through the gel. These shifts are seen for all of the positive control DNA antibodies indicating they all bound protein.
<img src = "http://openwetware.org/images/d/da/Screen_Shot_2014-10-25_at_8.12.28_PM.png">
These tiles also show another interesting result. The tile PCAB does not run exactly like PC2A nor PC1A but instead shows a further shift on the gel. We hypothesize that this is because PC2A has two of the same aptamers incorporated into the DNA tile, which can each bind a separate protein molecule. In contrast, it appears that the PCAB tile bound only a single protein.
Alpha-Thrombin Selection to DNA Antibodies with Randomized Aptamers
A new pool of DNA antibodies were made incorporating aptamers with random sequences after previously confirming the binding between alpha-thrombin and the positive control DNA antibodies. A native gel of the EMSA representing DNA antibodies with randomized oligonucleotide aptamers is shown below in Figure R4. From this gel, it is difficult to tell whether or not the random aptamer tiles (AT2R’) in the protein-positive lanes have shifted. The double bands in AT2R’ were seen earlier in other DNA antibodies that incorporated two randomized oligonucleotides into the opposite sites as AT2R’. We suspect that this phenomenon occurs due to incomplete incorporation of the aptamer strands into the DNA tile. However, there is still a large band of DNA antibodies with correctly incorporated aptamers to provide a large enough selectable pool and in the future, a longer program when annealing oligo strands will be used.
<img src = "http://openwetware.org/images/c/cf/Screen_Shot_2014-10-25_at_8.13.18_PM.png">
To test whether the concentration of DNA tile bound to protein is too low to visualize with gel stain, a gel slice was cut from the region above 600 bp to just below the bottom of the well in lanes “AT2R’ w/o protein” and “AT2R’ w/ protein” separately, and the DNA eluted. These eluates were analyzed by PCR amplification using the randomized aptamer strands AT2R’, BT11A and BT16A (see Figure R5 below).
<img src = "http://openwetware.org/images/9/9f/Screen_Shot_2014-10-25_at_8.14.33_PM.png">
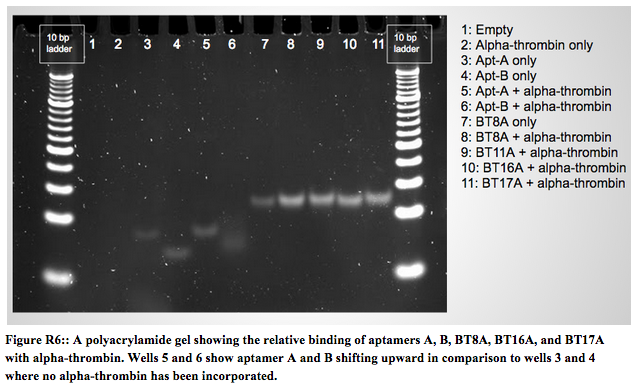
Results of the PCR from the gel slice in Figure R5 proved inconclusive, so we progressed to testing the binding of the DNA antibody to alpha-thrombin using a NHS ester bead affinity column as described in the Experimental Protocol section with strand BT11 apt-A (a positive control). BT11 apt-A, a simple aptamer strand, is very similar to aptamer A, which is shown to bind alpha-thrombin in Figure R6 below.
<img src = "http://openwetware.org/images/5/50/Screen_Shot_2014-10-25_at_8.15.35_PM.png">
This process was first tested using positive control aptamer BT11 and alpha-thrombin bound to NHS-ester bead. The DNA was mixed in a column and washed with buffer to remove any unbound DNA. Any DNA retained would be through binding to the alpha-thrombin protein. The DNA in resulting flowthroughs and column elutions were amplified using PCR and run on a 4% agarose gel and shown in Figure R7 below.
<img src = "http://openwetware.org/images/b/be/Screen_Shot_2014-10-25_at_8.16.33_PM.png">
Surprisingly, it was found that DNA appeared in all wash fractions , no matter how many washes were done before the final elution. Therefore, we decided to test if DNA was nonspecifically binding to the beads. A negative DNA strand (BT11A) with no affinity for alpha-thrombin was used to test this theory. It was expected that no band should be present in the sample eluted from the column as the alpha-thrombin protein attached to the beads does not bind the DNA aptamer. Yet a band was observed in each experimental lane of this gel at 46 bp, the length of BT11A DNA strand (see Figure R8 below). Minor bands attributed to primer dimerization during PCR also occurred at ~30 bp. The major bands are of similar strength across all lanes, and the column material appears to have amplified as much as the other eluates. This would suggest that the DNA strands bind to the column beads and that this method is not suitable to test the binding of the DNA antibody to the alpha-thrombin protein. Another column was run with no protein and it confirmed this result as again, DNA was present in all elution fractions even though no protein was present in the column. Therefore, the DNA must have been binding directly to the beads.
<img src = "http://openwetware.org/images/9/95/Screen_Shot_2014-10-25_at_8.20.41_PM.png">
Amplification of aptamer strands for confirmation by sequencing
During the process of DNA antibody selection and regeneration, the aptamers were the only element to be amplified. Therefore, the selected and amplified aptamers could be used to enrich another pool of aptamer strands for incorporation into more DNA tiles. Primers were designed for amplification of the randomized aptamers, and a test was run to see if these primers would amplify the aptamer strands. A 5% agarose electrophoresis gel of the resulting PCR products shows that we were able to amplify aptamer inserts for every insert site (Figure R9). Although PCR was run on known aptamer sequences, primer sequences were the same for the randomized aptamers.
<img src = "http://openwetware.org/images/c/cf/Screen_Shot_2014-10-25_at_8.19.28_PM.png">
Computational Simulations
A pdb file of the control DNA tile was generated using CaDNAno and Cando used for visualization. From there, Avogadro was used to generate aptamer sequence, and the aptamers were manually inserted into the tile at the insertion points using PyMol. The structure was formatted.
References
1) Rinker, S., Ke, Y., Liu, Y. Chhabra, R., Yan, H. Self-assembled DNA nanostructures for distance-dependent multivalent ligand-protein binding. Nature Nanotechnology 3, 418-422 (2008)
<script>
$(function(){
var $container = $('#container');
$container.isotope({
itemSelector : '.box',
columnWidth: 220,
sortBy : 'random',
gutterWidth: 8,
cornerStampSelector: '.logo',
category : function( $elem ) {
return $elem.attr('data-category');
},
sortBy: 'category'
});
});
</script>
<script>
$(function () {
$('.rs-slider').refineSlide({
transition : 'fade',
useThumbs : false,
autoplay: false,
maxWidth: 460,
onInit : function () {
var slider = this.slider;
$('.next').on('click', function (e) {
e.preventDefault();
slider.next()
});
$('.prev').on('click', function (e) {
e.preventDefault();
slider.prev()
});
}
});
});
</script>
<script>
$(document).ready(function() {
$(".yt").fancybox({
maxWidth : 800,
maxHeight : 600,
fitToView : false,
width : '70%',
height : '70%',
autoSize : false,
closeClick : false,
openEffect : 'none',
closeEffect : 'none'
});
});
</script>
Views
- <a href="/wiki/Biomod/2014/ASU" title="View the content page [c]" accesskey="c">Page</a>
- <a href="/index.php?title=Talk:Biomod/2014/ASU&action=edit" title="Discussion about the content page [t]" accesskey="t">Talk</a>
- <a href="/index.php?title=Biomod/2014/ASU&action=edit" title="This page is protected.
You can view its source. [e]" accesskey="e">View source</a>
- <a href="/index.php?title=Biomod/2014/ASU&action=history" title="Past versions of this page. [h]" accesskey="h">History</a>
Personal tools
- <a href="/wiki/User:209.147.144.5" title="The user page for the ip you're editing as [.]" accesskey="." class="new">209.147.144.5</a>
- <a href="/wiki/User_talk:209.147.144.5" title="Discussion about edits from this ip address [n]" accesskey="n" class="new">Talk for this IP</a>
- <a href="/index.php?title=Special:UserLogin&returnto=Biomod/2014/ASU" title="You are encouraged to log in, it is not mandatory however. [o]" accesskey="o">Log in</a>
<script type="text/javascript">if (window.runOnloadHook) runOnloadHook();</script>
<script src="/js/Urchin/urchin.js" type="text/javascript">
</script>
<script type="text/javascript">
_uacct = "UA-2860391-2";
urchinTracker();
</script>
</body></html>
