BIOL368/F14:Isabel Gonzaga Week 5: Difference between revisions
changed format |
added conclusion, results |
||
| Line 20: | Line 20: | ||
==Determining Genetic Relationships== | ==Determining Genetic Relationships== | ||
[[Image:Unrooted_Tree_-_Visit_1cc.png|thumb|left|300px|<b>Figure 1.</b> Unrooted phylogenetic tree generated for all sequences from Visit 1 after sequence alignment with a ClustalW matrix. Red indicates subjects diagnosed with AIDS, yellow represents subjects progressing towards AIDS and blue represents subjects with no trend of progression]] | [[Image:Unrooted_Tree_-_Visit_1cc.png|thumb|left|300px|<b>Figure 1.</b> Unrooted phylogenetic tree generated for all sequences from Visit 1 after sequence alignment with a ClustalW matrix. Red indicates subjects diagnosed with AIDS, yellow represents subjects progressing towards AIDS and blue represents subjects with no trend of progression]] | ||
[[Image:Unrooted_Tree_-_Final_Visitcc.png|thumb|left|300px|<b>Figure 2.</b> Unrooted phylogenetic tree generated for all sequences from their Final Visit after sequence alignment with a ClustalW matrix. Red indicates subjects diagnosed with AIDS, yellow represents subjects progressing towards AIDS and blue represents subjects with no trend of progression]] | [[Image:Unrooted_Tree_-_Final_Visitcc.png|thumb|left|300px|<b>Figure 2.</b> Unrooted phylogenetic tree generated for all sequences from their Final Visit after sequence alignment with a ClustalW matrix. Red indicates subjects diagnosed with AIDS, yellow represents subjects progressing towards AIDS and blue represents subjects with no trend of progression]]<Br><br> | ||
Biology WorkBench was used to compare and analyze the dataset. The sequence file was uploaded onto a new session for analysis. A ClustalW was performed for all sequences from the first visit, and all sequences from the final visit. The rootless trees were generated and color coded. In both trees, Red represents subjects diagnosed with AIDs, Yellow represents subjects trending towards AIDS and Blue represents subjects with no trend of progression towards the disease.<br><Br> | Biology WorkBench was used to compare and analyze the dataset. The sequence file was uploaded onto a new session for analysis. A ClustalW was performed for all sequences from the first visit, and all sequences from the final visit. The rootless trees were generated and color coded. In both trees, Red represents subjects diagnosed with AIDs, Yellow represents subjects trending towards AIDS and Blue represents subjects with no trend of progression towards the disease.<br><Br><Br><br> | ||
In Figure 1 we see that virus strains from each subject are genetically similar to each other, with the exception of one sequence in Subject 15. The three categories (AIDS diagnosed, progressing and no trend) are dispersed fairly evenly throughout the tree, thus no strong relationships between their genes may be determined. In Figure 2, the sequences of the viral strains from the last visit show a much different distribution pattern. The non-trending subjects are together and uninterrupted by other subjects. This shows that they are more genetically similar to one another, than the others. Subject 9 (progress or) and Subject 13 (no trend) also branched from the the same ancestor, however, this genetic connection may contribute to subject 9's resilience and ability to raise CD4 C Cell counts despite dropping below 200. <br>Most interestingly, Subject 10 and 15, both AIDS Diagnosed, cluster and overlap each other, showing much genetic overlap. They are most genetically similar to Subject 14, whom developed AIDS one year later. These observations support that AIDS development may be due to the development of specific genetic identities of the viral strains. That is, AIDS developing HIV-1 strains are similar to each other. | In Figure 1 we see that virus strains from each subject are genetically similar to each other, with the exception of one sequence in Subject 15. The three categories (AIDS diagnosed, progressing and no trend) are dispersed fairly evenly throughout the tree, thus no strong relationships between their genes may be determined. In Figure 2, the sequences of the viral strains from the last visit show a much different distribution pattern. The non-trending subjects are together and uninterrupted by other subjects. This shows that they are more genetically similar to one another, than the others. Subject 9 (progress or) and Subject 13 (no trend) also branched from the the same ancestor, however, this genetic connection may contribute to subject 9's resilience and ability to raise CD4 C Cell counts despite dropping below 200. <br>Most interestingly, Subject 10 and 15, both AIDS Diagnosed, cluster and overlap each other, showing much genetic overlap. They are most genetically similar to Subject 14, whom developed AIDS one year later. These observations support that AIDS development may be due to the development of specific genetic identities of the viral strains. That is, AIDS developing HIV-1 strains are similar to each other. | ||
<Br><br><Br><br><Br><br> | |||
==Analyzing Diversity Within Groups== | ==Analyzing Diversity Within Groups== | ||
[[Image:AIDSV1alignment.jpg|thumb|left|300px|<b>Figure 3.</b> ClustalW alignment for all AIDS-diagnosed sequences at the time of the first visit. Black, non-asterisked segments denote individual base pair differences between the 9 strands. These differences were counted and used to calculated the S and θ values to determine differences between the AIDS Diagnosed groups.]] | [[Image:AIDSV1alignment.jpg|thumb|left|300px|<b>Figure 3.</b> ClustalW alignment for all AIDS-diagnosed sequences at the time of the first visit. Black, non-asterisked segments denote individual base pair differences between the 9 strands. These differences were counted and used to calculated the S and θ values to determine differences between the AIDS Diagnosed groups.]] | ||
| Line 38: | Line 38: | ||
[[Image:Nonclustadistvf.png|thumb|left|300px|<b>Figure 13.</b> Clustadist analysis for all Non-Trending sequences at the time of their final visits. Minimum and Maximum base pair values were calculated using this matrix]] | [[Image:Nonclustadistvf.png|thumb|left|300px|<b>Figure 13.</b> Clustadist analysis for all Non-Trending sequences at the time of their final visits. Minimum and Maximum base pair values were calculated using this matrix]] | ||
ClustalW was performed for each group category from Visit 1 under the Biology Workbench Nucleic tools. Rootless phylogenetic trees were analyzed, and the multiple sequence alignment was conducted. This alignment was used to determine diversity within each category. The aligned sequences were then imported and further analyzed using the ClustalDist analysis, where a matrix was generated, determining percent differences between | ClustalW was performed for each group category from Visit 1 under the Biology Workbench Nucleic tools. Rootless phylogenetic trees were analyzed, and the multiple sequence alignment was conducted. This alignment was used to determine diversity within each category, as S and theta values were calculated. The aligned sequences were then imported and further analyzed using the ClustalDist analysis, where a matrix was generated, determining percent differences between the strains. The minimum and maximum base pair differences within the group classifications were then calculated for each group by multiplying the minimum and maximum percent difference by the total number of base pairs (n=185). This process was repeated for sequences at the final visits. <br><br><Br><br> | ||
<b>Table 2: </b>Diversity Within Categories at Initial Visit | <b>Table 2: </b>Diversity Within Categories at Initial Visit<Br> | ||
{|border="1" | {|border="1" | ||
|- | |- | ||
| Line 50: | Line 50: | ||
| No Trend || 64 || 24 || 1 || 47 | | No Trend || 64 || 24 || 1 || 47 | ||
|} | |} | ||
<Br><Br><br> | <Br><Br><Br><br> | ||
Within the initial visit, the AIDS Diagnosed category had the highest amount of diversity between it's three strains. They had the highest number of nucleotide sequence discrepancies in the multiple sequence alignment (S=70). In addition, some strains were nearly identical with one nucleotide difference, while others had up to 46 differences. The non-trending group had a similar pattern in its diversity, while the progressing group was less diverse in comparison. | |||
<Br><br><Br><br> | |||
<b>Table 3: </b>Diversity Within Categories at Final Visit<Br> | <b>Table 3: </b>Diversity Within Categories at Final Visit<Br> | ||
{|border="1" | {|border="1" | ||
| Line 61: | Line 64: | ||
|- | |- | ||
| No Trend || 61 || 22 || 1 || 43 | | No Trend || 61 || 22 || 1 || 43 | ||
|}<Br><br> | |}<Br><br><Br><br> | ||
In Table 3 we are able to see how the intragroup diversity changes over the course of the disease. The AIDS strains have become slightly more diverse, increasing to 76 nucleotide discrepancies and a maximum of 51 base pairs. The AIDS Progressing group has increased in their diversity levels, raising to 21 base pair discrepancies and increasing its range of base pair differences from 29 to 37 changes. The non trending group was the only group to slightly decrease diversity levels. This group mutates over the course of the study to gain 3 more congruent base pairs, reducing their maximum difference from 47 to 43 nucleotide changes. | |||
<Br><br> | |||
==Analyzing Diversity Between Groups== | ==Analyzing Diversity Between Groups== | ||
Groupings were further analyzed in comparison to each other. ClustalW was performed for AIDS diagnosed and AIDS progressing subjects. The sequences were aligned and a Clustaldist was performed to calculate minimum and maximum differences between strains within the two groups. This was repeated for AIDS diagnosed and No Trend, as well as AIDS progressing and no trend. These processes were repeated for the Final Visit sequences. The findings and calculations are as follows: | Groupings were further analyzed in comparison to each other. ClustalW was performed for AIDS diagnosed and AIDS progressing subjects. The sequences were aligned and a Clustaldist was performed to calculate minimum and maximum differences between strains within the two groups. This was repeated for AIDS diagnosed and No Trend, as well as AIDS progressing and no trend. These processes were repeated for the Final Visit sequences. The findings and calculations are as follows: | ||
| Line 76: | Line 82: | ||
<br><Br> | <br><Br> | ||
<b> | <b>Table 4.</b> Initial Visit Comparisons of Diversity Between Categories.<Br> | ||
{|border="1" | {|border="1" | ||
|- | |- | ||
| Line 87: | Line 93: | ||
| AIDS Progressing <br>vs.<br>No Trend || 13 || 43 | | AIDS Progressing <br>vs.<br>No Trend || 13 || 43 | ||
|}<br><br> | |}<br><br> | ||
<b> | |||
Of the three comparisons, the highest diversity was found between the AIDS Diagnosed compared to the non trending group. They had the highest minimum base pair difference (more than double that of the others) and a higher maximum base pair difference by 9-10 bases. This shows that even at the point of initial seroconversion, the AIDS and No Trend groups are more distinctly unrelated. The Progressing groups shows the same amount of diversity when compared to the diagnosed and non trending groups. | |||
<Br><Br> | |||
<b>Table 5.</b> Final Visit Comparisons of Diversity Between Categories.<Br> | |||
{|border="1" | {|border="1" | ||
|- | |- | ||
| Line 98: | Line 108: | ||
| AIDS Progressing <br>vs.<br>No Trend || 25 || 49 | | AIDS Progressing <br>vs.<br>No Trend || 25 || 49 | ||
|}<br><Br> | |}<br><Br> | ||
Through Table 5 we see how the AIDS Progressing group has mutated over time in relation to the other groups. With the increased diversity level within the Progressing Group (see: Table 3), the groups' diversity in relation to both the diagnosed and non-trending groups have been affected. Comparing this data to Table 4, AIDS Progressing shows to have mutated to more closely resemble the AIDS Diagnosed group, as the minimum base pair difference is the lowest at 17. Although the high maximum base pair difference remains, this is due to the genetically distinct Subject 3. As this is only one subject, the majority of sequence comparisons lie towards the lower-middle end of the base pair difference numbers. AIDS Diagnosed and No Trend maintain roughly the same number of differences. | |||
<br><br><br><br><br><br><br><br><br><br><br><br><br><br><br><br><br><br><br><br><br><br><br><br><br><br><br><br><br><br><br><br><br><br><br><br><br><br><br><br><br><br><br><br><br><br><br><br><br><br><br><br><br><br><br><br><br><br><br><br><br><br><br><br><br><br><br><br><br><br><br><br><br><br><br><br><br><br><br><br><br><br><br><br><br><br><br><br><br><br><br><br><br><br><br><br><br><br><br><br><br><br><br><br><br><br><br><br><br><br><br><br><br><br><br><br><br><br><br><br><br><br><br><br><br> | |||
=Discussion and Conclusion= | =Discussion and Conclusion= | ||
Through this research, I found that a relationship may indeed exist between the genetic identities of AIDS diagnosed subjects and AIDS progressing subjects, in comparison to the non-trending group. Data from the initial points of seroconversion show that each grouping maintains high diversity, and the phylogenetic tree (figure 1) shows evenly dispersed genetic relationships across groupings. Despite this, the AIDS Diagnosed and Non Trending groups showed relatively high diversity in a clustadist analysis, which suggests that the strain of virus affected may be used as a predicting factor for the onset of AIDS. <Br> | |||
Both of my hypotheses were correct, in that AIDS Diagnosed had higher diversity while the No Trend group had less diversity, even decreasing over time. Despite these changes in diversity, the relationship between the Diagnosed and Non Trending groups stayed relatively the same over time, with high minimum base pair differences (29-30) and high maximum differences (51-53). The Progressing group grew the most in terms of gaining diversity over time. As determined by the CD4 T Cell Counts in these groups in the [http://bioquest.org/bedrock/problem_spaces/hiv/HIV_data_table_README.pdf BEDROCK HIV Sequence Data Table], this may be due to them approaching AIDS diagnosis at the end of the study. This notion is also supported by their increased similarity to AIDS Diagnosed strains at the end of the study (Table 5).<br> | |||
However, it is important to note that the findings of this study are based off observations of statistical analyses. The trends discussed may not be distinct enough to produce a significant value in other statistical tests. Further analysis and calculations must be done to draw conclusions on the validity of these trends. | |||
{{Template:Isabel Gonzaga}} | {{Template:Isabel Gonzaga}} | ||
Revision as of 06:26, 1 October 2014
HIV Evolution Research Project - Introduction
- Question: Is there a relationship between the genetic identities in the viral strains present in Subjects with or progressing towards AIDS diagnosis, compared to subjects who are not?
- Hypothesis: I predict that in comparing and analyzing subjects of these three categories (diagnosed with AIDS, trending towards AIDS and no trend), higher diversity will be found in the AIDS diagnosed and in those trending towards AIDS. I also hypothesize that the 'no trend' group will maintain some genetic similarity across viruses.
Methods and Results
Defining the Population
According to the BEDROCK HIV Sequence Data Table, I was able to determine which of the subjects used within my study actually developed aids. All 3 AIDS diagnosed were confirmed with the disease. Subject 3 developed AIDS at the time of his 5th visit, Subject 10 developed it at his 5th visit, and Subject 15 developed it at his 3rd visit. This means that all three 'AIDS Diagnosed' subjects were correctly identified, and that the sequences from their final visits are of already of 'AIDS status'. In the AIDS progressing groups, Subject 8 and 14 both developed AIDs. Subject 8 developed AIDs in the year after his final visit (Visit 7), after which his TD4 Cell Counts declined to 51. Subject 14 also developed AIDS within one year after his last visit After the study, Subject 9 continued the downward progression and CD4 T Cell counts dropped as low as 180, which would be considered an AIDS diagnosis. However, after this visit, his counts rises back up and did not drop back below the threshold. The Non-Trending groups all maintained high CD4 T Cell Counts above the threshold. These findings support the validity of the groups defined for this analysis.
The following sequences was taken from the BEDROCK HIV Problem Space Database, from the Markham et al. (1998) study. The sequence were compiled into a single text document in FASTA format:
Table 1: Sequences analyzed
| Group | Subject | Visit | Sequences |
|---|---|---|---|
| AIDS Diagnosed | 3 10 15 |
1 6 1 6 1 4 |
1, 2, 3 3, 5, 6 3 , 5, 7 4, 6, 8 6, 9 , 12 2, 6, 8 |
| AIDS Progressing | 8 9 14 |
1 7 1 8 1 9 |
1, 2, 4 3, 5, 7 2, 3, 4 2, 4, 8 2, 5 , 6 3, 6, 9 |
| No Trend | 5 6 13 |
1 5 1 8 1 5 |
2, 4, 6 1, 3, 4 1, 2, 3 4, 6, 8 2, 3, 4 1, 2, 4 |
Determining Genetic Relationships
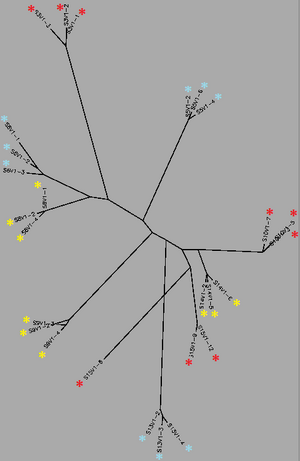
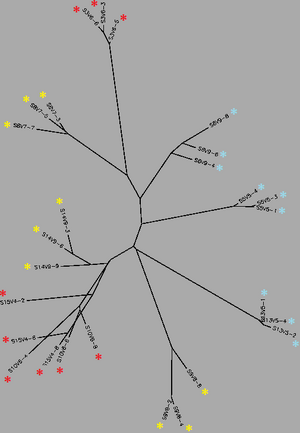
Biology WorkBench was used to compare and analyze the dataset. The sequence file was uploaded onto a new session for analysis. A ClustalW was performed for all sequences from the first visit, and all sequences from the final visit. The rootless trees were generated and color coded. In both trees, Red represents subjects diagnosed with AIDs, Yellow represents subjects trending towards AIDS and Blue represents subjects with no trend of progression towards the disease.
In Figure 1 we see that virus strains from each subject are genetically similar to each other, with the exception of one sequence in Subject 15. The three categories (AIDS diagnosed, progressing and no trend) are dispersed fairly evenly throughout the tree, thus no strong relationships between their genes may be determined. In Figure 2, the sequences of the viral strains from the last visit show a much different distribution pattern. The non-trending subjects are together and uninterrupted by other subjects. This shows that they are more genetically similar to one another, than the others. Subject 9 (progress or) and Subject 13 (no trend) also branched from the the same ancestor, however, this genetic connection may contribute to subject 9's resilience and ability to raise CD4 C Cell counts despite dropping below 200.
Most interestingly, Subject 10 and 15, both AIDS Diagnosed, cluster and overlap each other, showing much genetic overlap. They are most genetically similar to Subject 14, whom developed AIDS one year later. These observations support that AIDS development may be due to the development of specific genetic identities of the viral strains. That is, AIDS developing HIV-1 strains are similar to each other.
Analyzing Diversity Within Groups
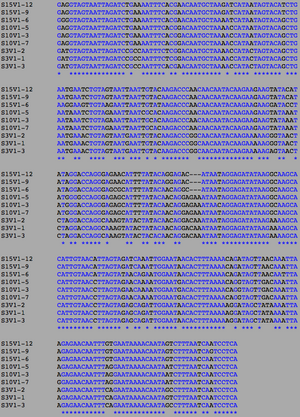
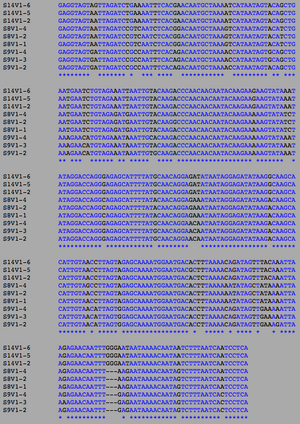
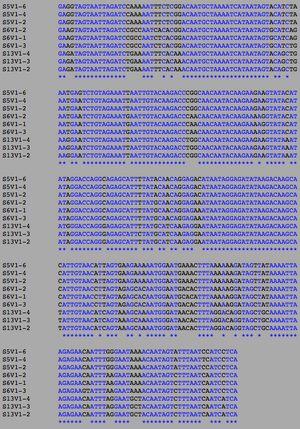


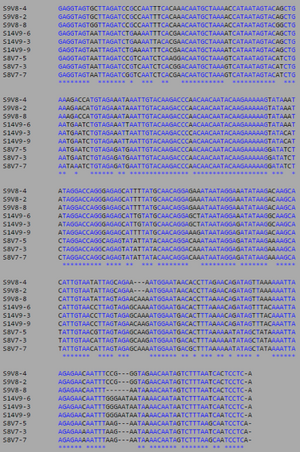
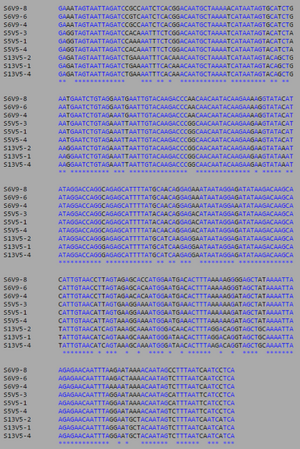


ClustalW was performed for each group category from Visit 1 under the Biology Workbench Nucleic tools. Rootless phylogenetic trees were analyzed, and the multiple sequence alignment was conducted. This alignment was used to determine diversity within each category, as S and theta values were calculated. The aligned sequences were then imported and further analyzed using the ClustalDist analysis, where a matrix was generated, determining percent differences between the strains. The minimum and maximum base pair differences within the group classifications were then calculated for each group by multiplying the minimum and maximum percent difference by the total number of base pairs (n=185). This process was repeated for sequences at the final visits.
Table 2: Diversity Within Categories at Initial Visit
| Group | S | θ | Minimum Base Pair Difference | Maximum Base Pair Difference |
|---|---|---|---|---|
| AIDS Diagnosed | 70 | 26 | 1 | 46 |
| AIDS Progressing | 50 | 18 | 2 | 31 |
| No Trend | 64 | 24 | 1 | 47 |
Within the initial visit, the AIDS Diagnosed category had the highest amount of diversity between it's three strains. They had the highest number of nucleotide sequence discrepancies in the multiple sequence alignment (S=70). In addition, some strains were nearly identical with one nucleotide difference, while others had up to 46 differences. The non-trending group had a similar pattern in its diversity, while the progressing group was less diverse in comparison.
Table 3: Diversity Within Categories at Final Visit
| Group | S | θ | Minimum Base Pair Difference | Maximum Base Pair Difference |
|---|---|---|---|---|
| AIDS Diagnosed | 76 | 28 | 2 | 51 |
| AIDS Progressing | 71 | 26 | 1 | 48 |
| No Trend | 61 | 22 | 1 | 43 |
In Table 3 we are able to see how the intragroup diversity changes over the course of the disease. The AIDS strains have become slightly more diverse, increasing to 76 nucleotide discrepancies and a maximum of 51 base pairs. The AIDS Progressing group has increased in their diversity levels, raising to 21 base pair discrepancies and increasing its range of base pair differences from 29 to 37 changes. The non trending group was the only group to slightly decrease diversity levels. This group mutates over the course of the study to gain 3 more congruent base pairs, reducing their maximum difference from 47 to 43 nucleotide changes.
Analyzing Diversity Between Groups
Groupings were further analyzed in comparison to each other. ClustalW was performed for AIDS diagnosed and AIDS progressing subjects. The sequences were aligned and a Clustaldist was performed to calculate minimum and maximum differences between strains within the two groups. This was repeated for AIDS diagnosed and No Trend, as well as AIDS progressing and no trend. These processes were repeated for the Final Visit sequences. The findings and calculations are as follows:


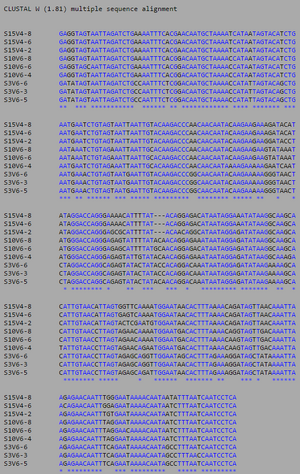


Table 4. Initial Visit Comparisons of Diversity Between Categories.
| Groups Compared | Minimum Base Pair Difference | Maximum Base Pair Difference |
|---|---|---|
| AIDS Diagnosed vs. AIDS Progressing |
13 | 42 |
| AIDS Diagnosed vs. No Trend |
29 | 53 |
| AIDS Progressing vs. No Trend |
13 | 43 |
Of the three comparisons, the highest diversity was found between the AIDS Diagnosed compared to the non trending group. They had the highest minimum base pair difference (more than double that of the others) and a higher maximum base pair difference by 9-10 bases. This shows that even at the point of initial seroconversion, the AIDS and No Trend groups are more distinctly unrelated. The Progressing groups shows the same amount of diversity when compared to the diagnosed and non trending groups.
Table 5. Final Visit Comparisons of Diversity Between Categories.
| Groups Compared | Minimum Base Pair Difference | Maximum Base Pair Difference |
|---|---|---|
| AIDS Diagnosed vs. AIDS Progressing |
17 | 51 |
| AIDS Diagnosed vs. No Trend |
30 | 51 |
| AIDS Progressing vs. No Trend |
25 | 49 |
Through Table 5 we see how the AIDS Progressing group has mutated over time in relation to the other groups. With the increased diversity level within the Progressing Group (see: Table 3), the groups' diversity in relation to both the diagnosed and non-trending groups have been affected. Comparing this data to Table 4, AIDS Progressing shows to have mutated to more closely resemble the AIDS Diagnosed group, as the minimum base pair difference is the lowest at 17. Although the high maximum base pair difference remains, this is due to the genetically distinct Subject 3. As this is only one subject, the majority of sequence comparisons lie towards the lower-middle end of the base pair difference numbers. AIDS Diagnosed and No Trend maintain roughly the same number of differences.
Discussion and Conclusion
Through this research, I found that a relationship may indeed exist between the genetic identities of AIDS diagnosed subjects and AIDS progressing subjects, in comparison to the non-trending group. Data from the initial points of seroconversion show that each grouping maintains high diversity, and the phylogenetic tree (figure 1) shows evenly dispersed genetic relationships across groupings. Despite this, the AIDS Diagnosed and Non Trending groups showed relatively high diversity in a clustadist analysis, which suggests that the strain of virus affected may be used as a predicting factor for the onset of AIDS.
Both of my hypotheses were correct, in that AIDS Diagnosed had higher diversity while the No Trend group had less diversity, even decreasing over time. Despite these changes in diversity, the relationship between the Diagnosed and Non Trending groups stayed relatively the same over time, with high minimum base pair differences (29-30) and high maximum differences (51-53). The Progressing group grew the most in terms of gaining diversity over time. As determined by the CD4 T Cell Counts in these groups in the BEDROCK HIV Sequence Data Table, this may be due to them approaching AIDS diagnosis at the end of the study. This notion is also supported by their increased similarity to AIDS Diagnosed strains at the end of the study (Table 5).
However, it is important to note that the findings of this study are based off observations of statistical analyses. The trends discussed may not be distinct enough to produce a significant value in other statistical tests. Further analysis and calculations must be done to draw conclusions on the validity of these trends.
Weekly Assignments
- Week 1 Assignment
- Week 2 Assignment
- Week 3 Assignment
- Week 4 Assignment
- Week 5 Assignment
- Week 6 Assignment
- Week 7 Assignment
- Week 8 Assignment
- Week 9 Assignment
- Week 10 Assignment
- Week 11 Assignment
- Week 12 Assignment
- Week 13 Assignment
- Week 15 Assignment
Class Journals
- Class Journal Week 1
- Class Journal Week 2
- Class Journal Week 3
- Class Journal Week 4
- Class Journal Week 5
- Class Journal Week 6
- Class Journal Week 7
- Class Journal Week 8
- Class Journal Week 9
- Class Journal Week 10
- Class Journal Week 11
- Class Journal Week 12
- Class Journal Week 13
- Class Journal Week 15