BIOL368/F14:Isabel Gonzaga Week 5: Difference between revisions
added MSA figures |
Added most figures |
||
| Line 25: | Line 25: | ||
In both trees, Red represents subjects diagnosed with AIDs, Yellow represents subjects trending towards AIDS and Blue represents subjects with no trend of progression towards the disease. | In both trees, Red represents subjects diagnosed with AIDs, Yellow represents subjects trending towards AIDS and Blue represents subjects with no trend of progression towards the disease. | ||
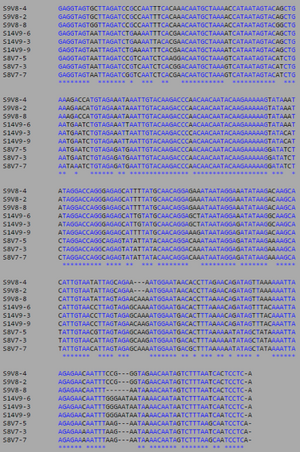
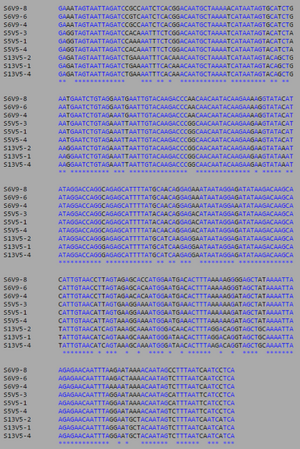
ClustalW was performed for each group from Visit 1. Sequences were aligned and further analyzed using the ClustalDist analysis, where minimum and maximum base pair differences were calculated within each AIDs status group. Groupings were further analyzed in comparison to each other. ClustalW was performed for AIDS diagnosed and AIDS progressing subjects. The sequences were aligned and a Clustaldist was performed to calculate minimum and maximum differences between strains within the two groups. This was repeated for AIDS diagnosed and No Trend, as well as AIDS progressing and no trend. These processes were repeated for the Final Visit sequences. The findings and calculations are as follows: | ClustalW was performed for each group from Visit 1. Sequences were aligned and further analyzed using the ClustalDist analysis, where minimum and maximum base pair differences were calculated within each AIDs status group. Groupings were further analyzed in comparison to each other. ClustalW was performed for AIDS diagnosed and AIDS progressing subjects. The sequences were aligned and a Clustaldist was performed to calculate minimum and maximum differences between strains within the two groups. This was repeated for AIDS diagnosed and No Trend, as well as AIDS progressing and no trend. These processes were repeated for the Final Visit sequences. The findings and calculations are as follows: | ||
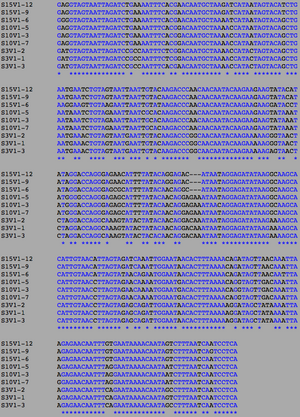
[[Image:AIDSV1alignment.jpg|thumb|left|300px|<b>Figure 3.</b> ClustalW alignment for all | [[Image:AIDSV1alignment.jpg|thumb|left|300px|<b>Figure 3.</b> ClustalW alignment for all AIDS-diagnosed sequences at the time of the first visit. Black, non-asterisked segments denote individual base pair differences between the 9 strands. These differences were counted and used to calculated the S and θ values to determine differences between the AIDS Diagnosed groups.]] | ||
[[Image:AIDS MSA F.png|thumb|left|300px|<b>Figure | |||
[[Image:Aids_clustadist_v1.png|thumb|left|300px|<b>Figure 6.</b> Clustadist analysis for all AIDS-diagnosed sequences at the time of their initial visits. Minimum and Maximum base pair values were calculated using this matrix]] | |||
[[Image:Progressingclustadistv2.png|thumb|left|300px|<b>Figure 7.</b> Clustadist analysis for all AIDS-progressing sequences at the time of their initial visits. Minimum and Maximum base pair values were calculated using this matrix]] | |||
[[Image:Notrendclustadistv1.png|thumb|left|300px|<b>Figure 8.</b> Clustadist analysis for all Non-trending sequences at the time of their initial visits. Minimum and Maximum base pair values were calculated using this matrix]] | |||
[[Image:DiagnosedvsProgressingClustadistV1.png|thumb|left|300px|<b>Figure 9.</b> Clustadist analysis comparing AIDS diagnosed and AIDS-Progressing sequences at the time of their initial visits. Minimum and Maximum base pair values were calculated using this matrix]] | |||
[[Image:AIDSvsNoTrendClustadistV1.png|thumb|left|300px|<b>Figure 10.</b> Clustadist analysis comparing AIDS diagnosed and Non-Trending sequences at the time of their initial visits. Minimum and Maximum base pair differences were calculated using this matrix]] | |||
[[Image:ProgressingVsNoTrendClustadistV1.png |thumb|left|300px|<b>Figure 11.</b> Clustadist analysis comparing AIDS-Progressing and Non-Trending sequences at the time of their initial visits. Minimum and Maximum base pair differences were calculated using this matrix]] | |||
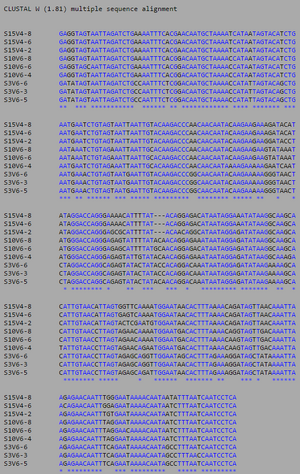
[[Image:AIDS MSA F.png|thumb|left|300px|<b>Figure 12.</b> ClustalW alignment for all AIDS-diagnosed sequences at the time of their final visits. Black, non-asterisked segments denote individual base pair differences between the 9 strands. These differences were counted and used to calculated the S and θ values to determine differences between the AIDS Diagnosed groups.]] | |||
[[Image:ClustalWProgressingVF.png|thumb|left|300px|<b>Figure 13.</b> ClustalW alignment for all AIDS-progressing sequences at the time of their final visits. Black, non-asterisked segments denote individual base pair differences between the 9 strands. These differences were counted and used to calculated the S and θ values to determine differences between the AIDS Progressing groups.]] | |||
[[Image:ClustalWNoTrendVF.png|thumb|left|300px|<b>Figure 14.</b> ClustalW alignment for all Non-Trending sequences at the time of their final visits. Black, non-asterisked segments denote individual base pair differences between the 9 strands. These differences were counted and used to calculated the S and θ values to determine differences between the Non-Trending groups.]] | |||
[[Image:AIDSClustadistVF.png|thumb|left|300px|<b>Figure 15.</b> Clustadist analysis for all AIDS-diagnosed sequences at the time of their initial visits. Minimum and Maximum base pair values were calculated using this matrix]] | |||
[[Image:ProgressingClustadistvF.png|thumb|left|300px|<b>Figure 16.</b> Clustadist analysis for all AIDS-progressing sequences at the time of their initial visits. Minimum and Maximum base pair values were calculated using this matrix]] | |||
[[Image:AIDSvsProgressingClustadistVF.png|thumb|left|300px|<b>Figure 18.</b> Clustadist analysis comparing AIDS diagnosed and AIDS-Progressing sequences at the time of their initial visits. Minimum and Maximum base pair values were calculated using this matrix]] | |||
[[Image:ProgressingVsNoTrendClustadistVF.png|thumb|left|300px|<b>Figure 20.</b> Clustadist analysis comparing AIDS Progressing and Non-Trending sequences at the time of their initial visits. Minimum and Maximum base pair values were calculated using this matrix]] | |||
<br><Br> | <br><Br> | ||
<b>Initial Visit</b><Br> | <b>Initial Visit</b><Br> | ||
Revision as of 00:47, 1 October 2014
HIV Evolution Research Project - Introduction
- Question: Is there a relationship between the genetic identities in the viral strains present in Subjects with or progressing towards AIDS diagnosis, compared to subjects who are not?
- Hypothesis: I predict that in comparing and analyzing subjects of these three categories (diagnosed with AIDS, trending towards AIDS and no trend), higher diversity will be found in the AIDS diagnosed and in those trending towards AIDS. I also hypothesize that the 'no trend' group will maintain some genetic similarity across viruses.
Methods and Results
- The following sequences was taken from the BEDROCK HIV Problem Space Database, from the Markham et al. (1998) study. The sequence were compiled into a single text document in FASTA format:
Table 1: Sequences analyzed
| Group | Subject | Visit | Sequences |
|---|---|---|---|
| AIDS Diagnosed | 3 10 15 |
1 6 1 6 1 4 |
1, 2, 3 3, 5, 6 3 , 5, 7 4, 6, 8 6, 9 , 12 2, 6, 8 |
| AIDS Progressing | 8 9 14 |
1 7 1 8 1 9 |
1, 2, 4 3, 5, 7 2, 3, 4 2, 4, 8 2, 5 , 6 3, 6, 9 |
| No Trend | 5 6 13 |
1 5 1 8 1 5 |
2, 4, 6 1, 3, 4 1, 2, 3 4, 6, 8 2, 3, 4 1, 2, 4 |
Biology WorkBench was used to compare and analyze the dataset. The sequence file was uploaded onto a new session for analysis. A ClustalW was performed for all sequences from the first visit, and all sequences from the final visit. The following rootless trees were generated and color coded:
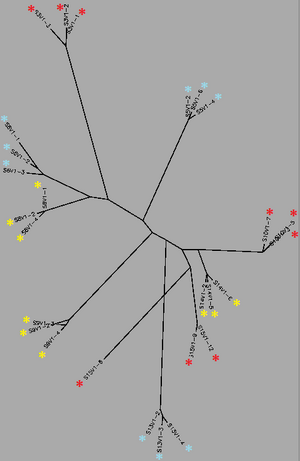
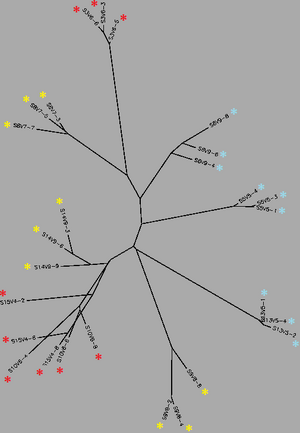
In both trees, Red represents subjects diagnosed with AIDs, Yellow represents subjects trending towards AIDS and Blue represents subjects with no trend of progression towards the disease.
ClustalW was performed for each group from Visit 1. Sequences were aligned and further analyzed using the ClustalDist analysis, where minimum and maximum base pair differences were calculated within each AIDs status group. Groupings were further analyzed in comparison to each other. ClustalW was performed for AIDS diagnosed and AIDS progressing subjects. The sequences were aligned and a Clustaldist was performed to calculate minimum and maximum differences between strains within the two groups. This was repeated for AIDS diagnosed and No Trend, as well as AIDS progressing and no trend. These processes were repeated for the Final Visit sequences. The findings and calculations are as follows:




Initial Visit
| Group | S | θ | Minimum Base Pair Difference | Maximum Base Pair Difference |
|---|---|---|---|---|
| AIDS Diagnosed | 70 | 26 | 1 | 46 |
| AIDS Progressing | 50 | 18 | 2 | 31 |
| No Trend | 64 | 24 | 1 | 47 |
Initial Visit Comparisons
| Groups Compared | Minimum Base Pair Difference | Maximum Base Pair Difference |
|---|---|---|
| AIDS Diagnosed vs. AIDS Progressing |
13 | 42 |
| AIDS Diagnosed vs. No Trend |
29 | 53 |
| AIDS Progressing vs. No Trend |
13 | 43 |
Final Visit
| Group | S | θ | Minimum Base Pair Difference | Maximum Base Pair Difference |
|---|---|---|---|---|
| AIDS Diagnosed | 76 | 28 | 2 | 51 |
| AIDS Progressing | 71 | 26 | 1 | 48 |
| No Trend | 61 | 22 | 1 | 43 |
Final Visit Comparisons
| Groups Compared | Minimum Base Pair Difference | Maximum Base Pair Difference |
|---|---|---|
| AIDS Diagnosed vs. AIDS Progressing |
17 | 51 |
| AIDS Diagnosed vs. No Trend |
30 | 51 |
| AIDS Progressing vs. No Trend |
25 | 49 |