Uploads by Veronica Liv Andersen
From OpenWetWare
Jump to navigationJump to search
This special page shows all uploaded files.
| Date | Name | Thumbnail | Size | Description |
|---|---|---|---|---|
| 18:55, 26 May 2015 | Sisi 6.png (file) |  |
618 bytes | |
| 13:47, 26 October 2013 | Intro veronica.png (file) | 127 KB | ||
| 13:53, 25 October 2013 | Ebbe 1.jpg (file) |  |
27 KB | |
| 13:51, 25 October 2013 | Joergen 1.jpg (file) |  |
34 KB | |
| 13:50, 25 October 2013 | Ane 1.jpg (file) |  |
52 KB | |
| 13:49, 25 October 2013 | Ane.jpg (file) |  |
52 KB | |
| 13:09, 25 October 2013 | Ebbe.jpg (file) |  |
35 KB | |
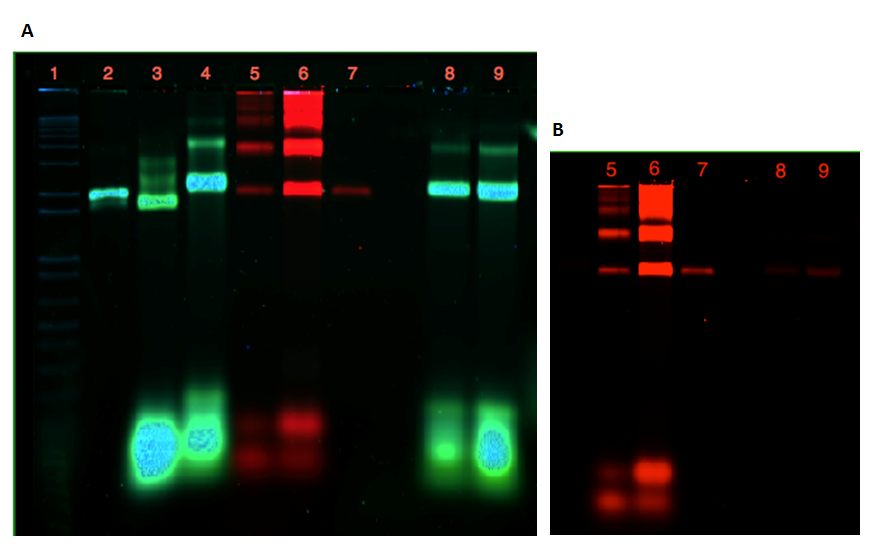
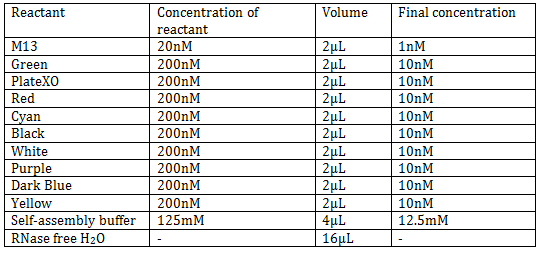
| 21:23, 23 October 2013 | Ori 100.png (file) |  |
164 KB | 1% Agarose gel containing self-assembly reactions of dome and plate, both purified and unpurified as well as connection samples. All self-assembly reactions were performed in 12.5mM MgCl2 over a 17 hour non-linear ramp. A: 1) 1kb Ladder, 2) M13 control, 3 |
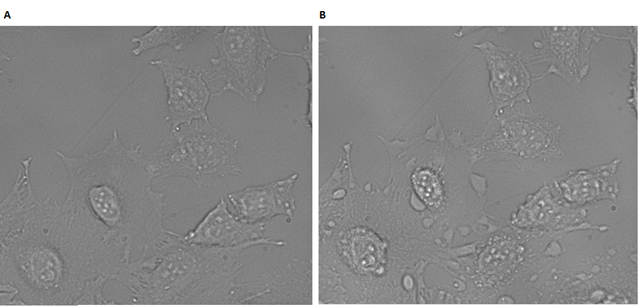
| 19:17, 23 October 2013 | Syst photo 11.png (file) |  |
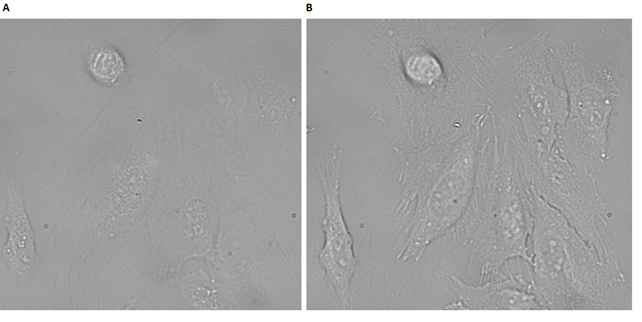
173 KB | Brightfield images (40x) of cells treated with PPa-cholesterol duplex. A: Treated cells before irridation. B: Cells after irradiation. |
| 19:16, 23 October 2013 | Syst photo 10.png (file) |  |
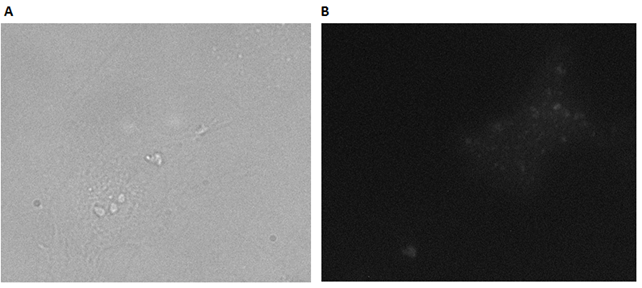
184 KB | Cells treated 1 µM sample of PPa-DNA annealed with DNA-cholesterol strand. A: Brightfield image of cells before irradiation. B: Flourescence microscopy image of cells after irradiation. |
| 19:14, 23 October 2013 | Syst photo 9.png (file) |  |
173 KB | Brightfield-image (40x) for comparison of untreated and treated cells. A: Untreated cells. B: cells that were incubated with 1µM PPa-DNA for 30 min and irradiated (the contrast has been increased). |
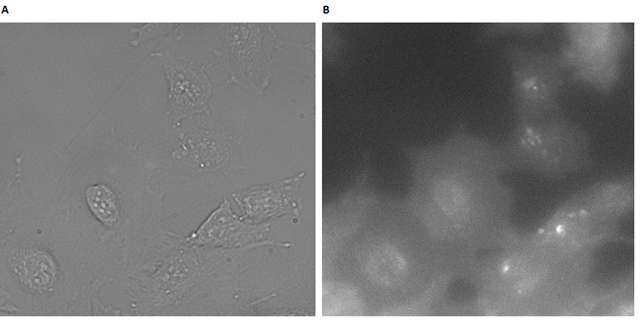
| 19:13, 23 October 2013 | Syst photo 8.png (file) |  |
155 KB | Brightfield image of cells treated with 1µM PPa-DNA for 30 min. Fig 7. Fluorescence-image of irradiated cells incubated with 1µM PPa-DNA for 30 min. |
| 19:11, 23 October 2013 | Syst photo 7.png (file) |  |
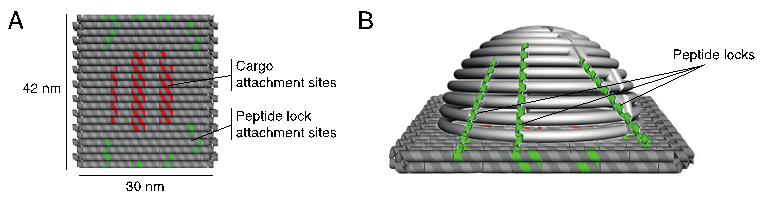
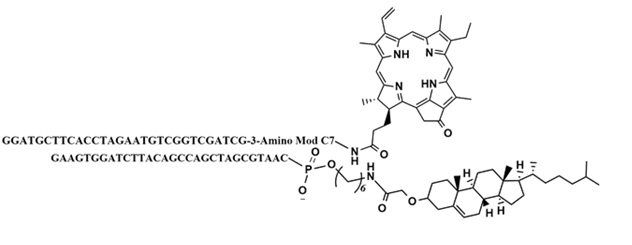
28 KB | Details of the system, DII*. |
| 19:10, 23 October 2013 | Syst photo 6.png (file) |  |
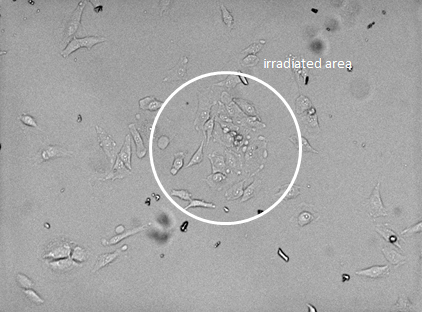
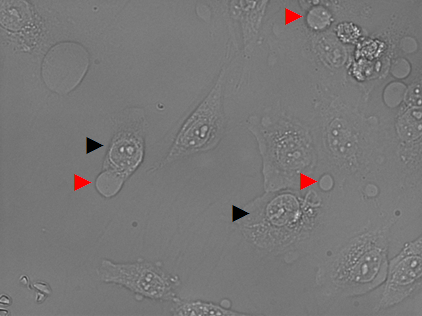
140 KB | Brightfield image, 10x. Only irradiated cells have died, while surrounding cells are still healthy. |
| 19:08, 23 October 2013 | Syst photo 5.png (file) |  |
116 KB | Brightfield image, 40x 15 minutes after irradiation. |
| 19:07, 23 October 2013 | Syst photo 4.png (file) |  |
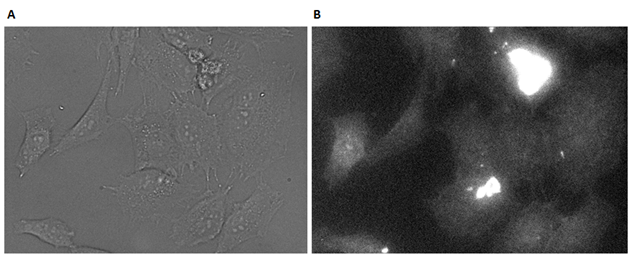
163 KB | Cells imaged after incubation with 5 µM DII for 2 hours. A: Brightfield microscopy image, 40x. B: Flourescence microscopy image, 40x. |
| 19:05, 23 October 2013 | Syst photo 3.png (file) |  |
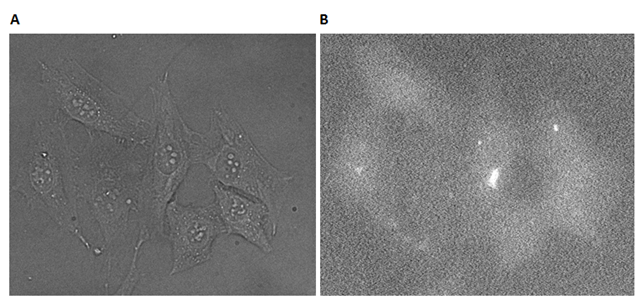
195 KB | Cells treated with 5 µM DII for 30 minutes. A: Brightfield (BF)- image, 40x. B: Flourescence microscopy image, 40x. |
| 19:04, 23 October 2013 | Syst photo 2.png (file) |  |
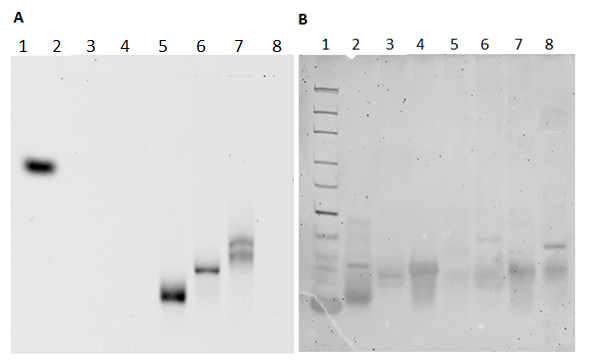
112 KB | Fig. 1. Native PAGE gel showing the annealing of modified DNA strands. A: Gel scanned for the photosensitizer. B: The gel after staining with ethidium bromide. 1) DNA ladder, 2) 5’ unmodified DNA, 3) 5’ cholesterol DNA design II, 4), 3’ cholesterol |
| 19:03, 23 October 2013 | Syst photo 1.png (file) |  |
27 KB | Details of the design, DII. |
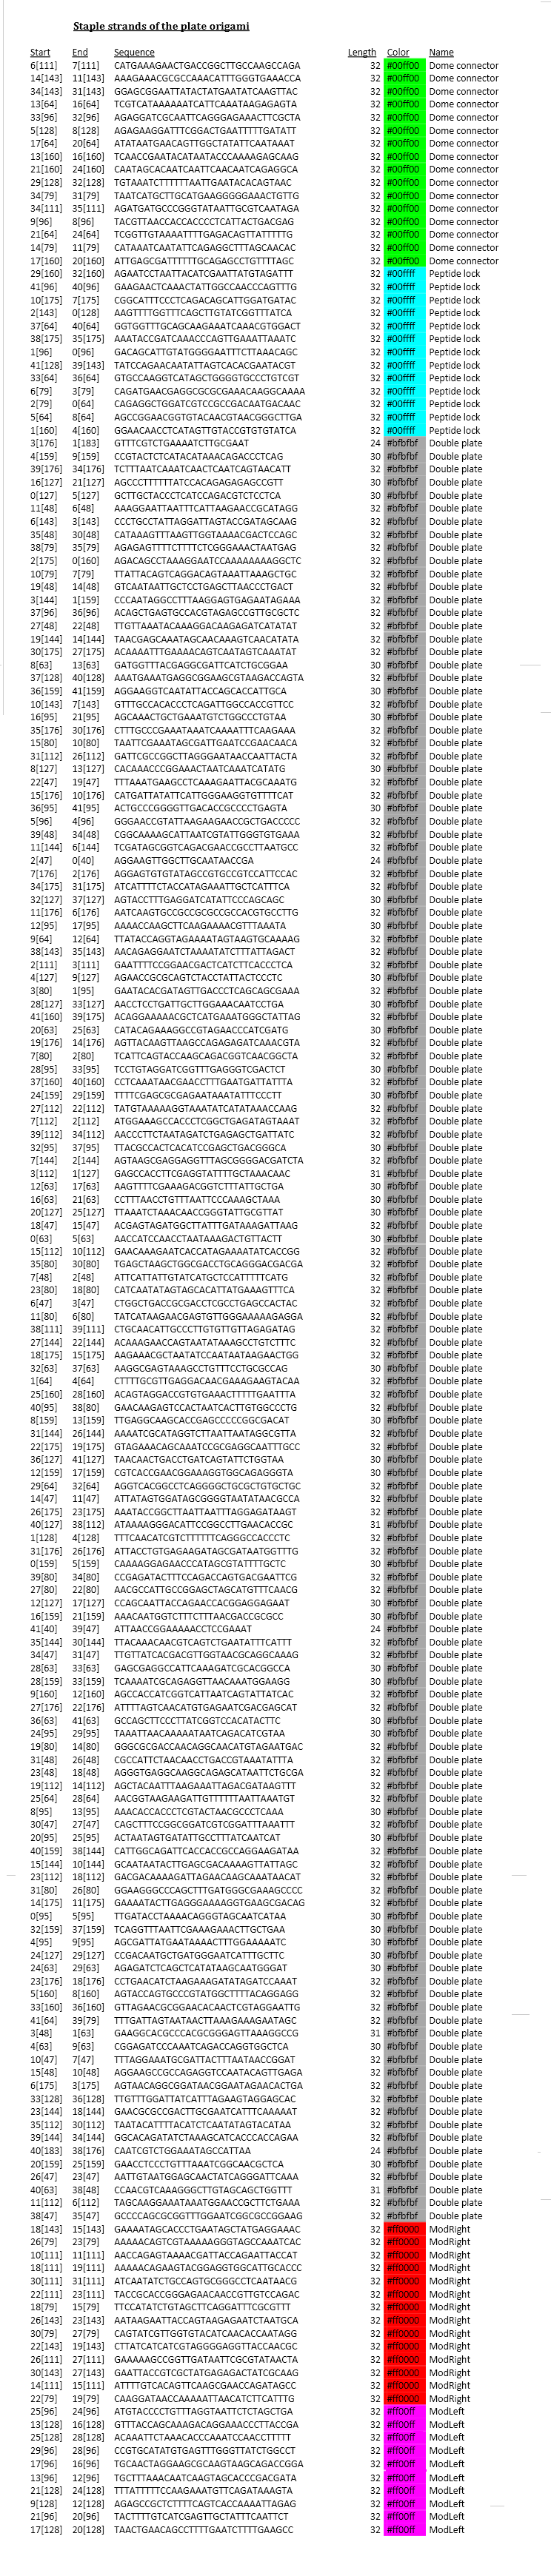
| 11:14, 23 October 2013 | Supp orig staples plate.png (file) |  |
638 KB | Staple strands for the plate. |
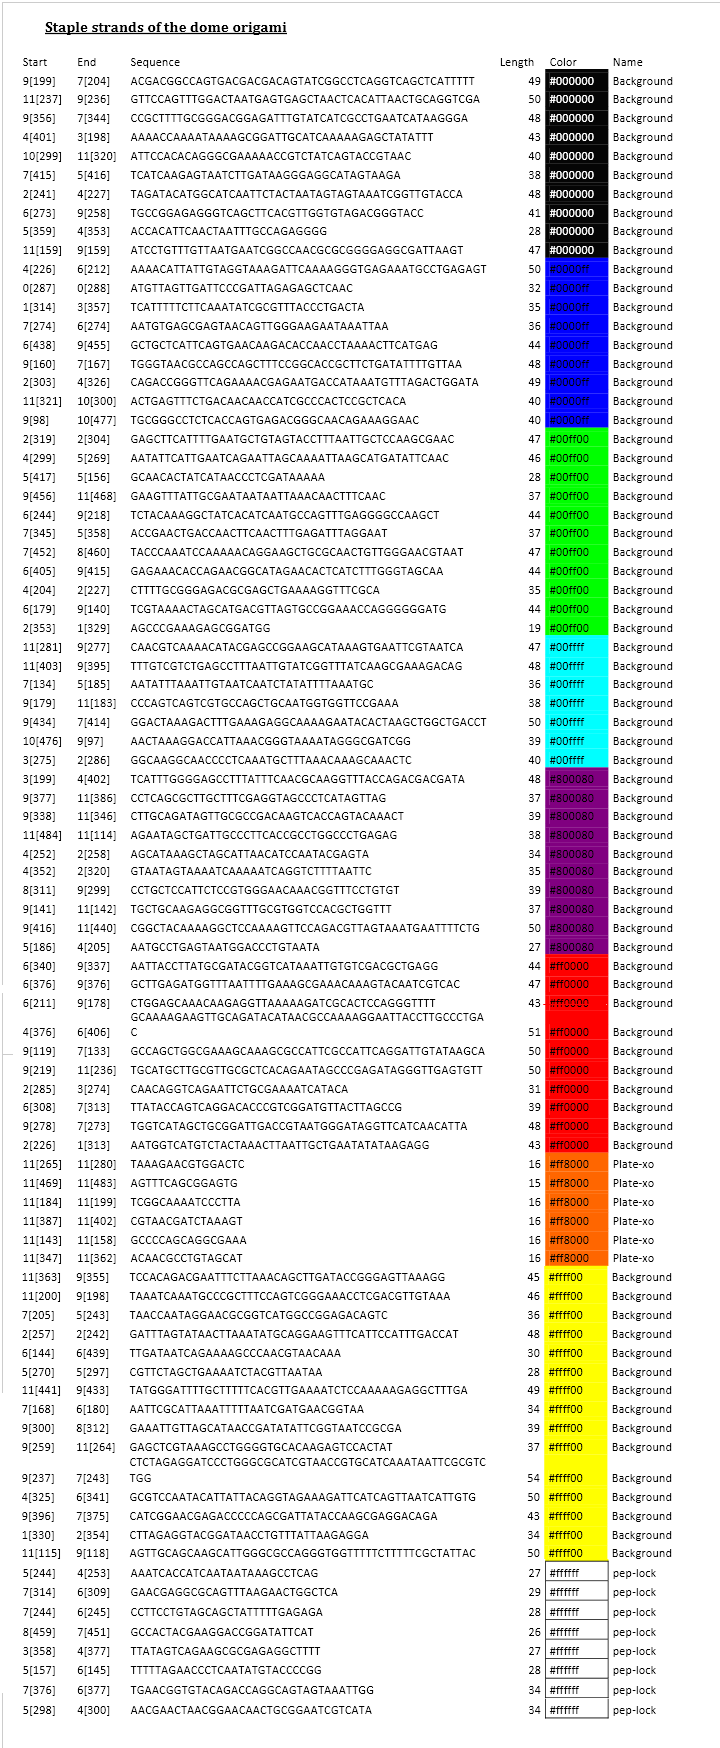
| 10:55, 23 October 2013 | Supp orig staples dome 2.png (file) |  |
217 KB | Staple strands for the dome. |
| 10:52, 23 October 2013 | Supp orig staples dome.png (file) |  |
184 KB | Staple strands for the dome. |
| 10:37, 23 October 2013 | CDNA logo.png (file) | 252 KB | CDNA | |
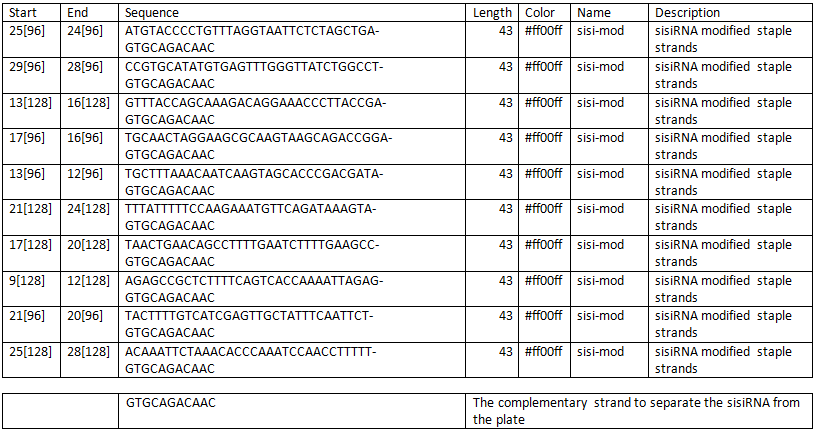
| 10:05, 23 October 2013 | Suppl modified staples for sisi.png (file) |  |
33 KB | Modified staples for attachment of sisiRNA. |
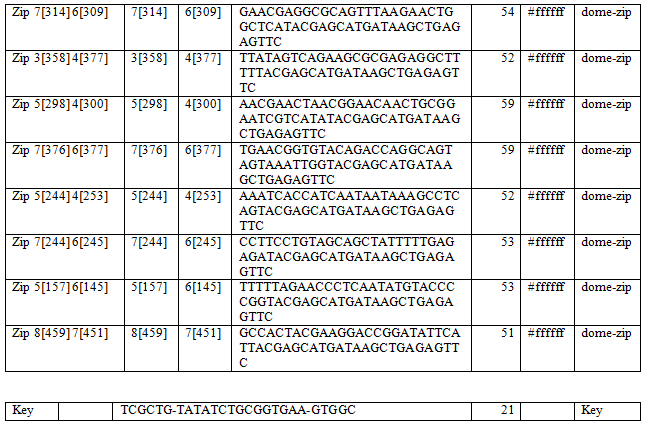
| 10:00, 23 October 2013 | Suppl dome peplock zipper.png (file) |  |
24 KB | Staple strands for dome-peptide lock with zipper. |
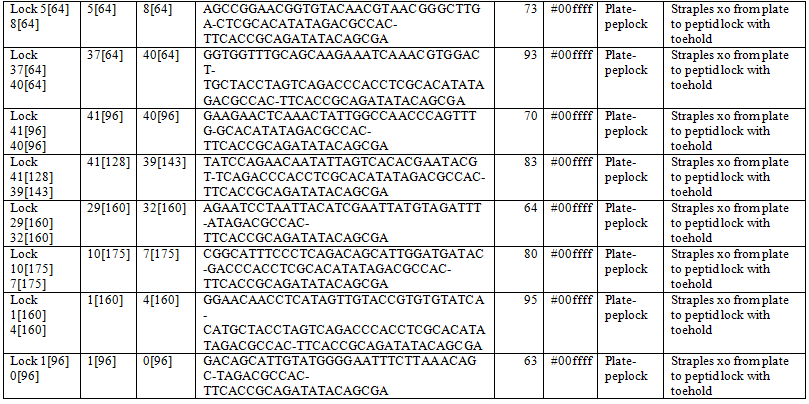
| 09:56, 23 October 2013 | Suppl pep lock toehold.png (file) |  |
41 KB | Staple strands for the peptide lock with toehold. |
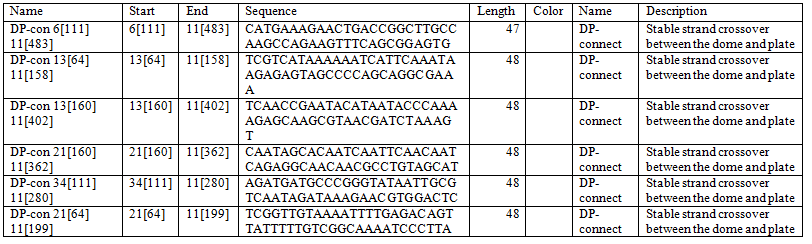
| 09:51, 23 October 2013 | Suppl dome plate connectors.png (file) |  |
29 KB | Staple strands for the plate-dome connection. |
| 09:44, 23 October 2013 | Suppl dome plate connecters.png (file) |  |
29 KB | |
| 21:26, 22 October 2013 | Syst act dome.png (file) |  |
12 KB | |
| 21:23, 22 October 2013 | Syst act 1.png (file) |  |
12 KB | |
| 20:29, 22 October 2013 | Dansk tennis.jpg (file) | 7 KB | Dansk Tennis Fond | |
| 20:25, 22 October 2013 | Kementec.png (file) |  |
9 KB | Kem-En-Tec |
| 20:20, 22 October 2013 | Promega.png (file) |  |
20 KB | |
| 20:15, 22 October 2013 | Sigmaaldrich-logo(transparant).png (file) | 187 KB | ||
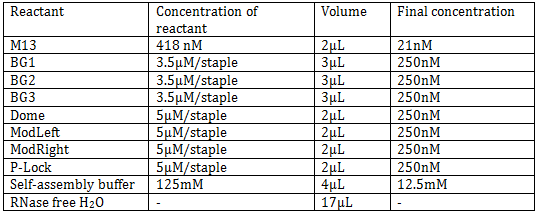
| 18:37, 22 October 2013 | Conf.png (file) |  |
525 KB | Confocal microscopy images of origami baseplate +/- cholesterol - A: Cells untreated. B: Cells treated with Origami + Cy3 + Cy5 + Lipofectamine (positive control). C: Cells treated with Origami + Cy3 + Cy5, Well 4: Cells treated with Origami + Cy3 + Cy5 + |
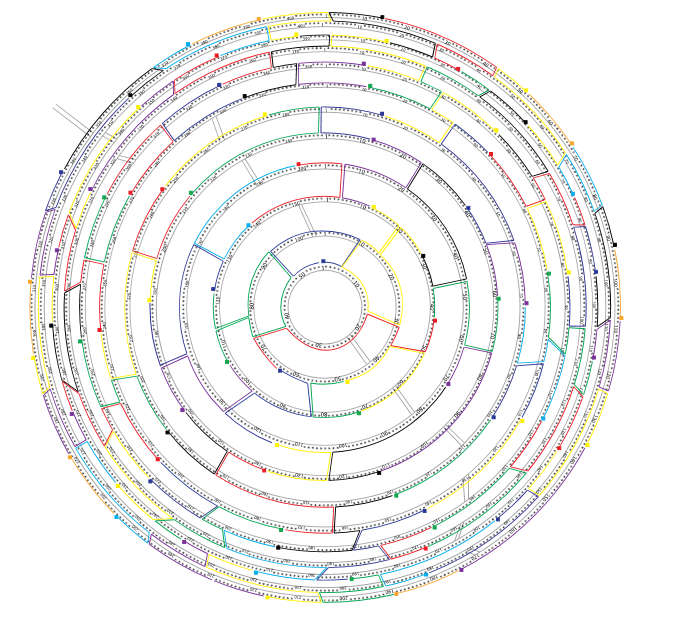
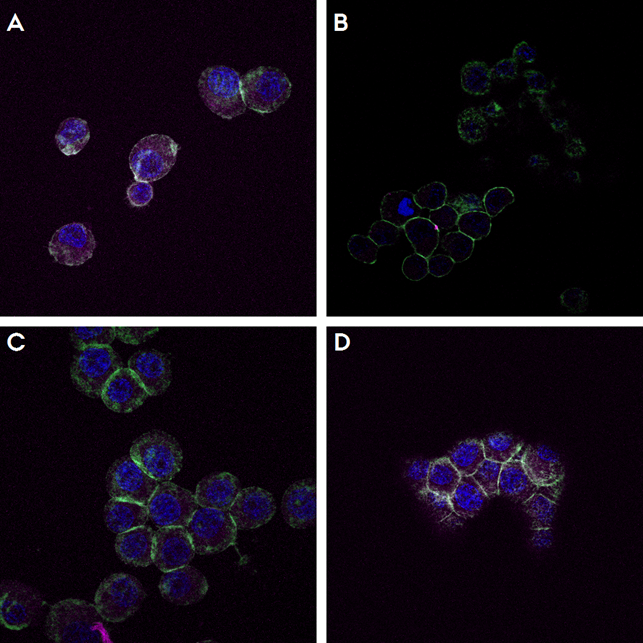
| 14:14, 22 October 2013 | Achievements.png (file) |  |
161 KB | A: AFM images of the origami plate. B: TEM image of the origami dome. |
| 13:55, 22 October 2013 | Tabel 1.png (file) |  |
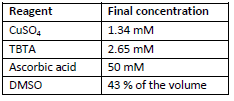
4 KB | Contents of the click buffer. |
| 10:36, 22 October 2013 | Sisi supp 5.png (file) |  |
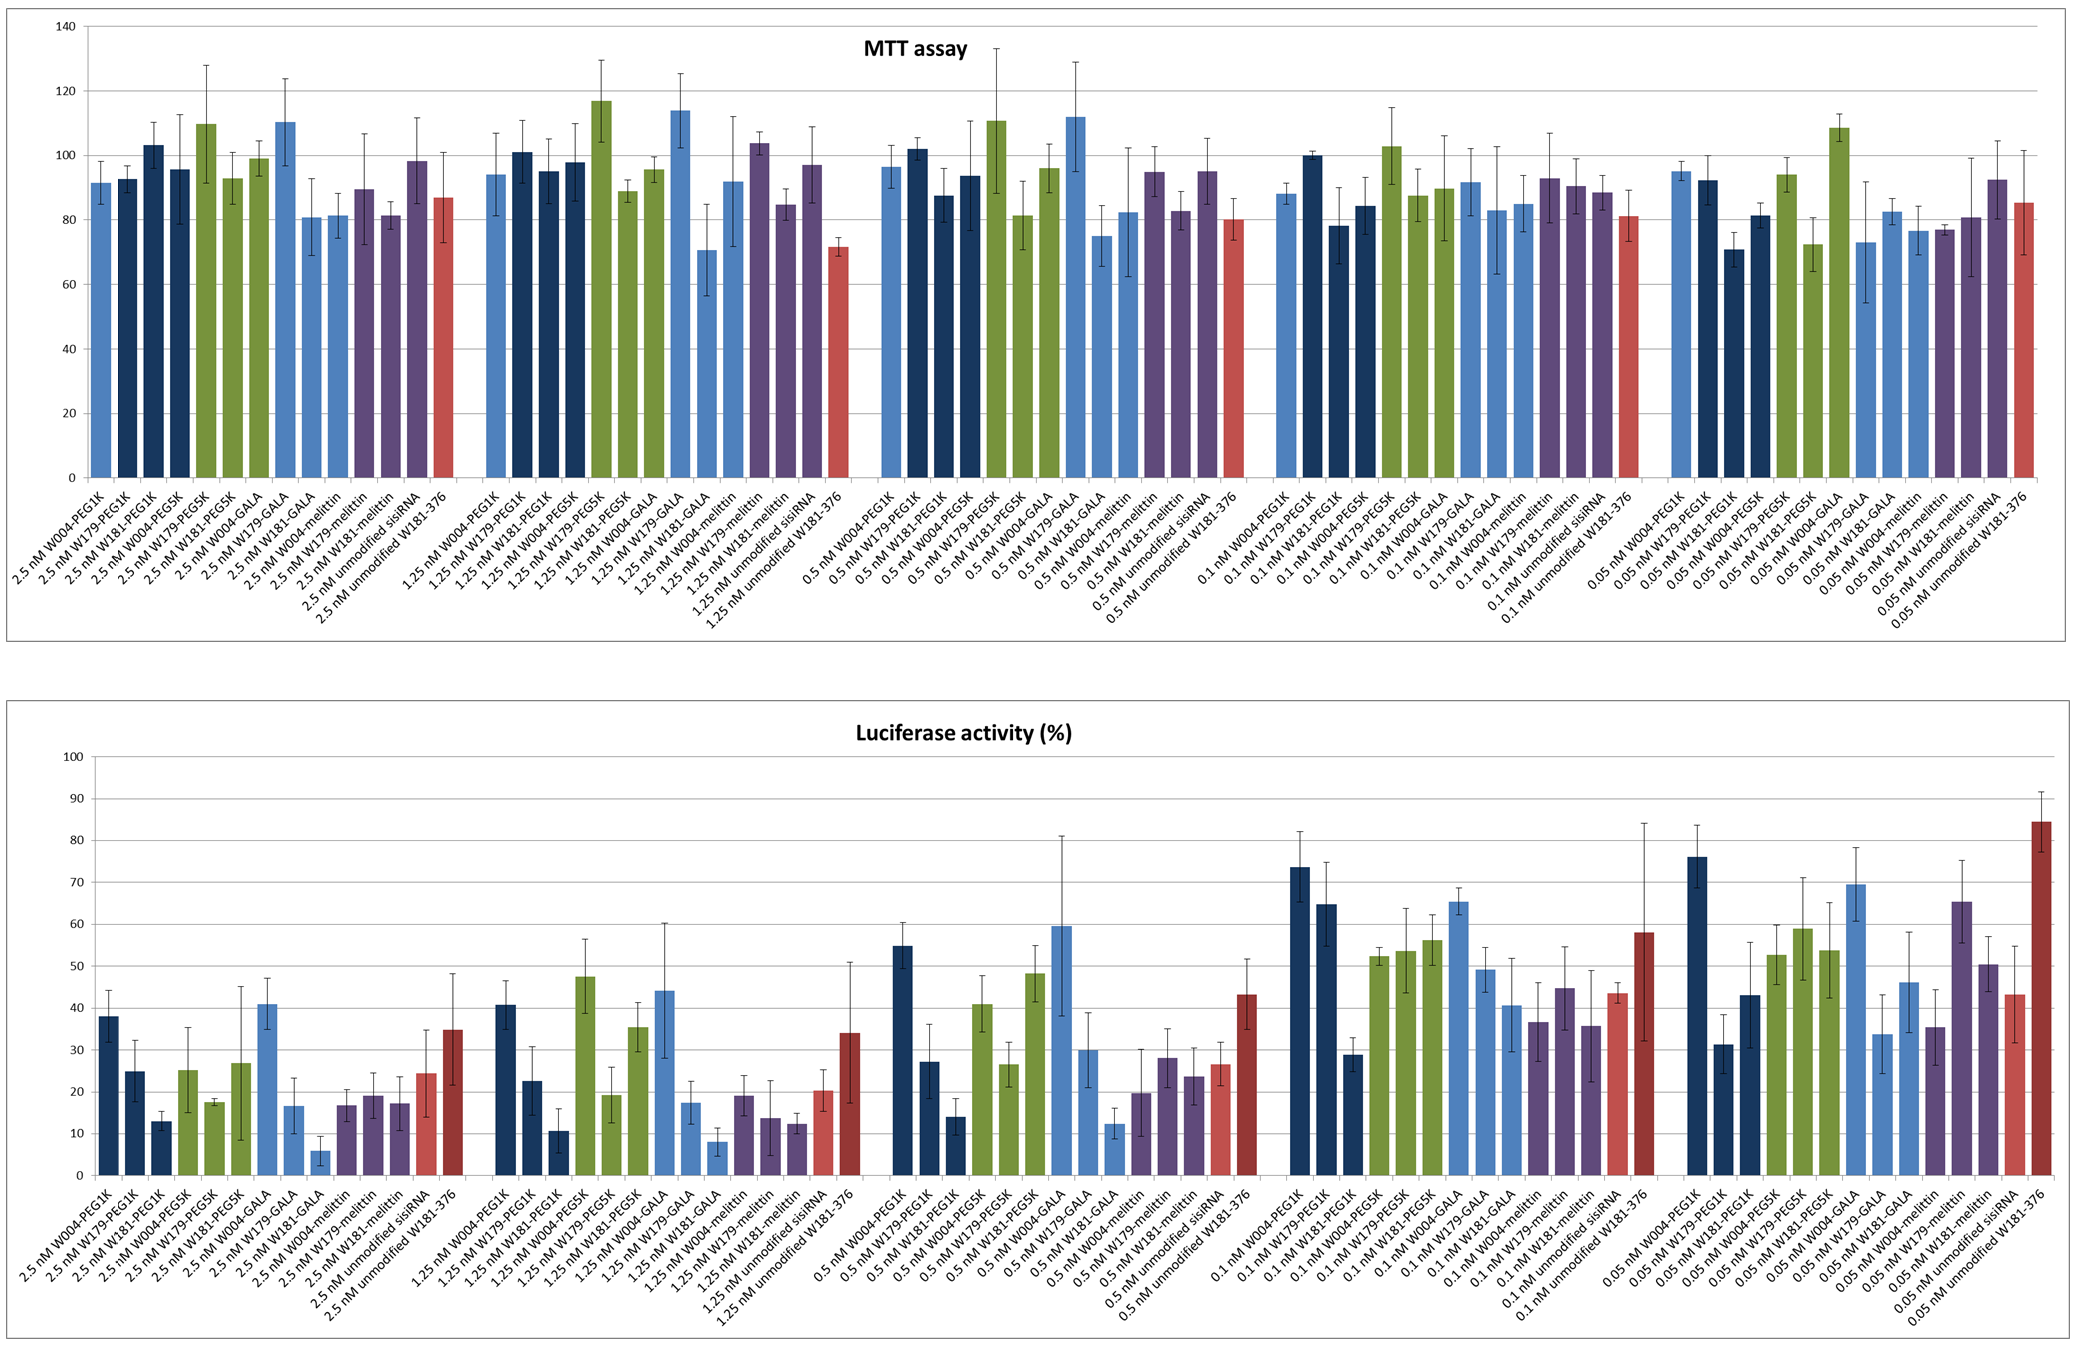
425 KB | Luciferase and MTT measuremetns of all knockdown experiments with singly modified duplexes using Lipofectamine. |
| 09:38, 22 October 2013 | Sisi supp 4.png (file) |  |
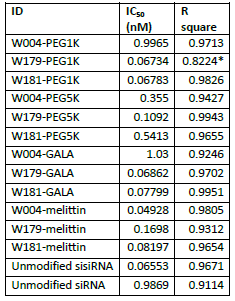
12 KB | Best fit IC50 values of all knockdown experiments using singly modified duplexes using Lipofectamine.The IC50 value for W179-PEG1K was calculated with a low R2 value and is not conclusive. |
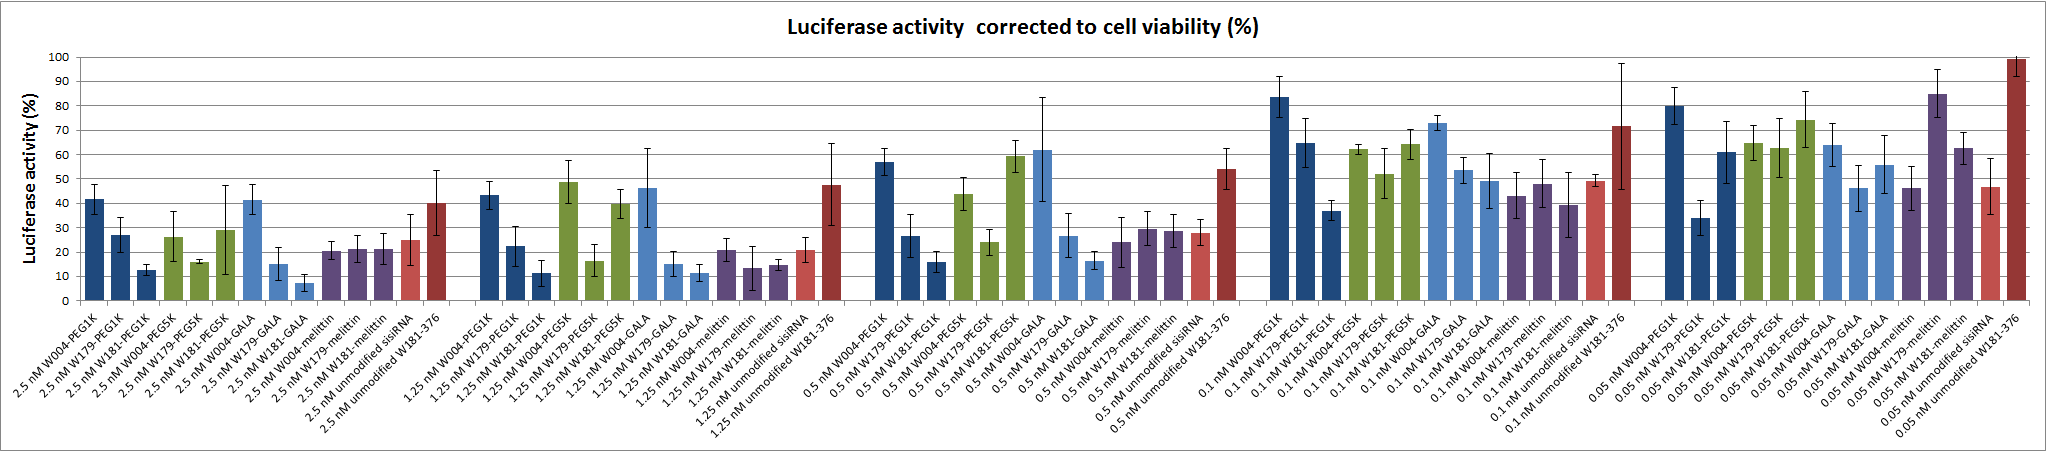
| 21:31, 21 October 2013 | Sisi sup 3.png (file) | 117 KB | Cell viability corrected luciferase activities for all singly modified duplexes. | |
| 17:01, 20 October 2013 | Joergen.jpg (file) |  |
23 KB | |
| 16:15, 20 October 2013 | Sisi supp 2.png (file) |  |
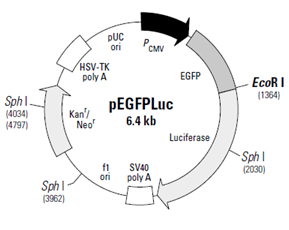
24 KB | Restriction map of pEGFPLuc vector. Derived from Clontech. |
| 16:10, 20 October 2013 | Sisi supp 1.png (file) |  |
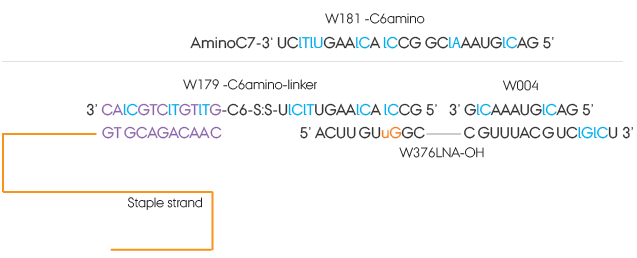
14 KB | Detailed structure and sequences of the sisiRNA. W179-C6amino and W004 comprises the sisiRNA sense strand and W376LNA-OH is the antisense strand. W181-C6amino shown topmost is the sense strand without the knick. Black colored letters marks nucleobases of |
| 10:42, 20 October 2013 | Veronical.jpg (file) |  |
40 KB | |
| 10:41, 20 October 2013 | Thomast.jpg (file) |  |
38 KB | |
| 10:40, 20 October 2013 | Steffen.JPG (file) |  |
40 KB | |
| 10:40, 20 October 2013 | Nadia.JPG (file) |  |
34 KB | |
| 10:39, 20 October 2013 | Minh.JPG (file) |  |
37 KB | |
| 10:39, 20 October 2013 | Mikkelb.JPG (file) |  |
38 KB | |
| 10:38, 20 October 2013 | Malthe.JPG (file) |  |
38 KB |

.png)