Uploads by Puja Mody
From OpenWetWare
Jump to navigationJump to search
This special page shows all uploaded files.
| Date | Name | Thumbnail | Size | Description |
|---|---|---|---|---|
| 17:45, 3 February 2015 | .8uM heme 32x.jpeg (file) |  |
3.52 MB | |
| 17:44, 3 February 2015 | .8uM heme 20x.jpeg (file) |  |
3.52 MB | |
| 17:44, 3 February 2015 | .8uM heme 10x.jpeg (file) |  |
3.52 MB | |
| 17:42, 3 February 2015 | 1uM heme 20x.jpeg (file) |  |
3.52 MB | |
| 17:41, 3 February 2015 | 1.2uM heme 20x.jpeg (file) |  |
3.52 MB | |
| 17:39, 3 February 2015 | 1.2uM heme 32x.jpeg (file) |  |
3.52 MB | |
| 17:37, 3 February 2015 | 1.2uM heme 10x.jpeg (file) |  |
3.52 MB | |
| 17:36, 3 February 2015 | 1.4uM heme 32x.jpeg (file) |  |
3.52 MB | |
| 17:34, 3 February 2015 | 1.6uM heme 32x.jpeg (file) |  |
3.52 MB | |
| 17:32, 3 February 2015 | 1.6uM 10x.jpeg (file) |  |
3.52 MB | |
| 17:28, 3 February 2015 | 4uM 10x.jpeg (file) |  |
3.52 MB | |
| 17:25, 3 February 2015 | 4uM 32x.jpeg (file) |  |
3.52 MB | |
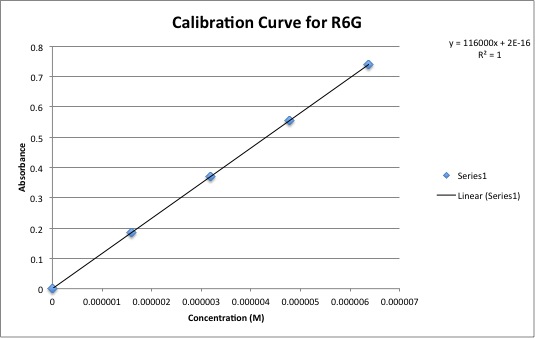
| 22:55, 23 September 2014 | R6G calibration curve.jpg (file) |  |
31 KB | |
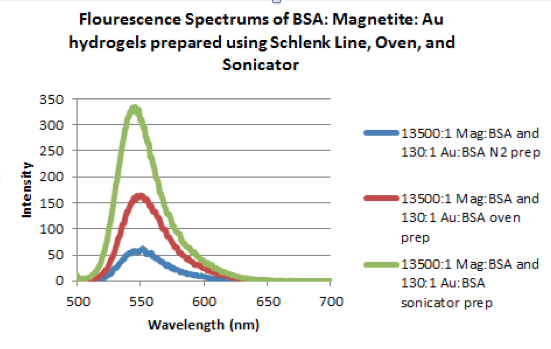
| 01:00, 29 April 2014 | Screen Shot 2014-04-28 at 8.59.12 PM.png (file) |  |
74 KB | flurorescence spectra |
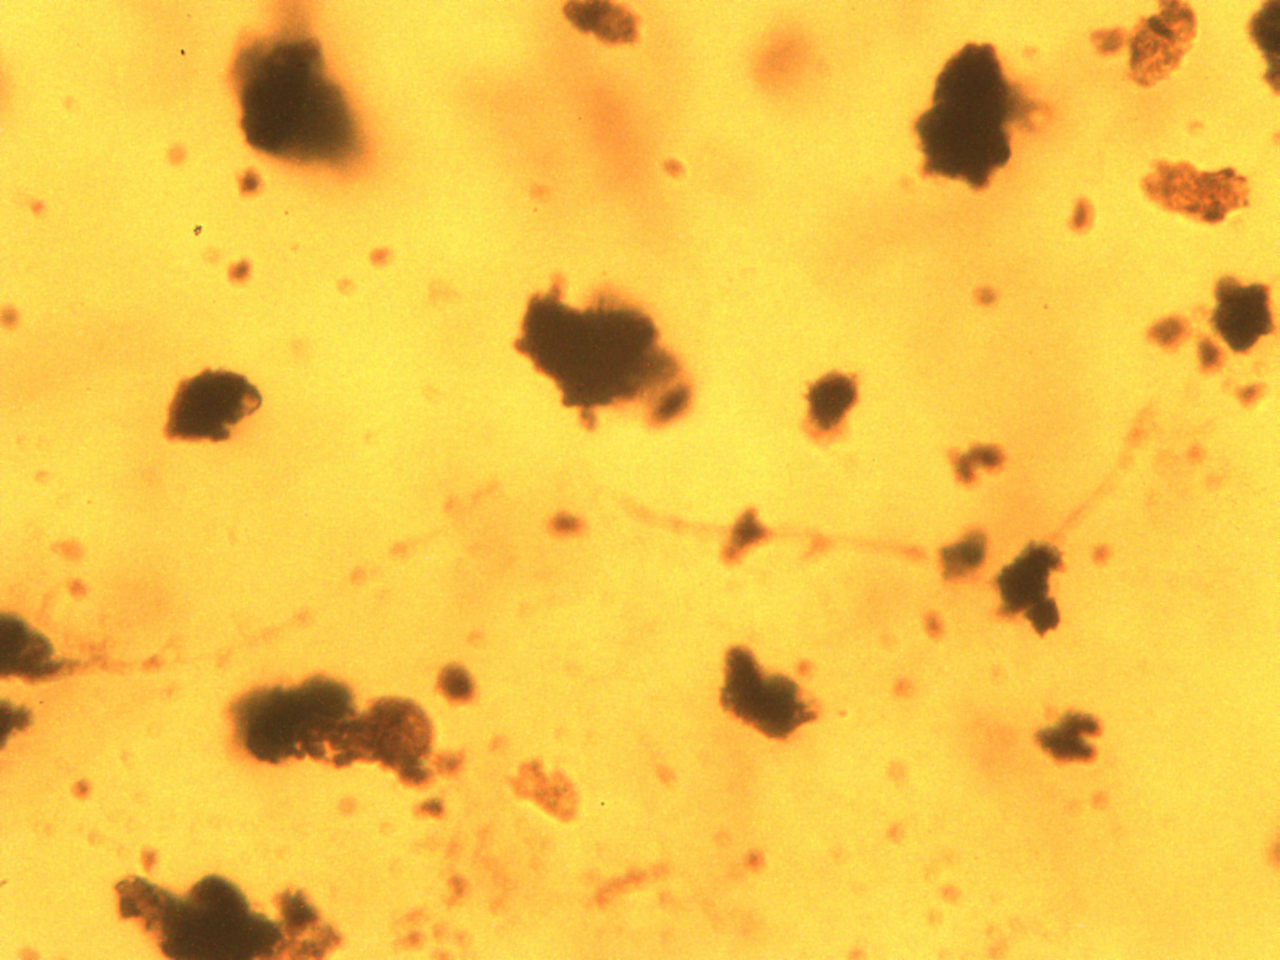
| 15:35, 24 March 2014 | 13000 BSA-Mag solocation 3-4.jpg (file) |  |
3.52 MB | |
| 15:34, 24 March 2014 | 13000 BSA-Mag solocation 3-4 10x.jpg (file) |  |
3.52 MB | |
| 15:32, 24 March 2014 | 32x 13000 bsa-mag solocation 3-4.jpg (file) |  |
3.52 MB | |
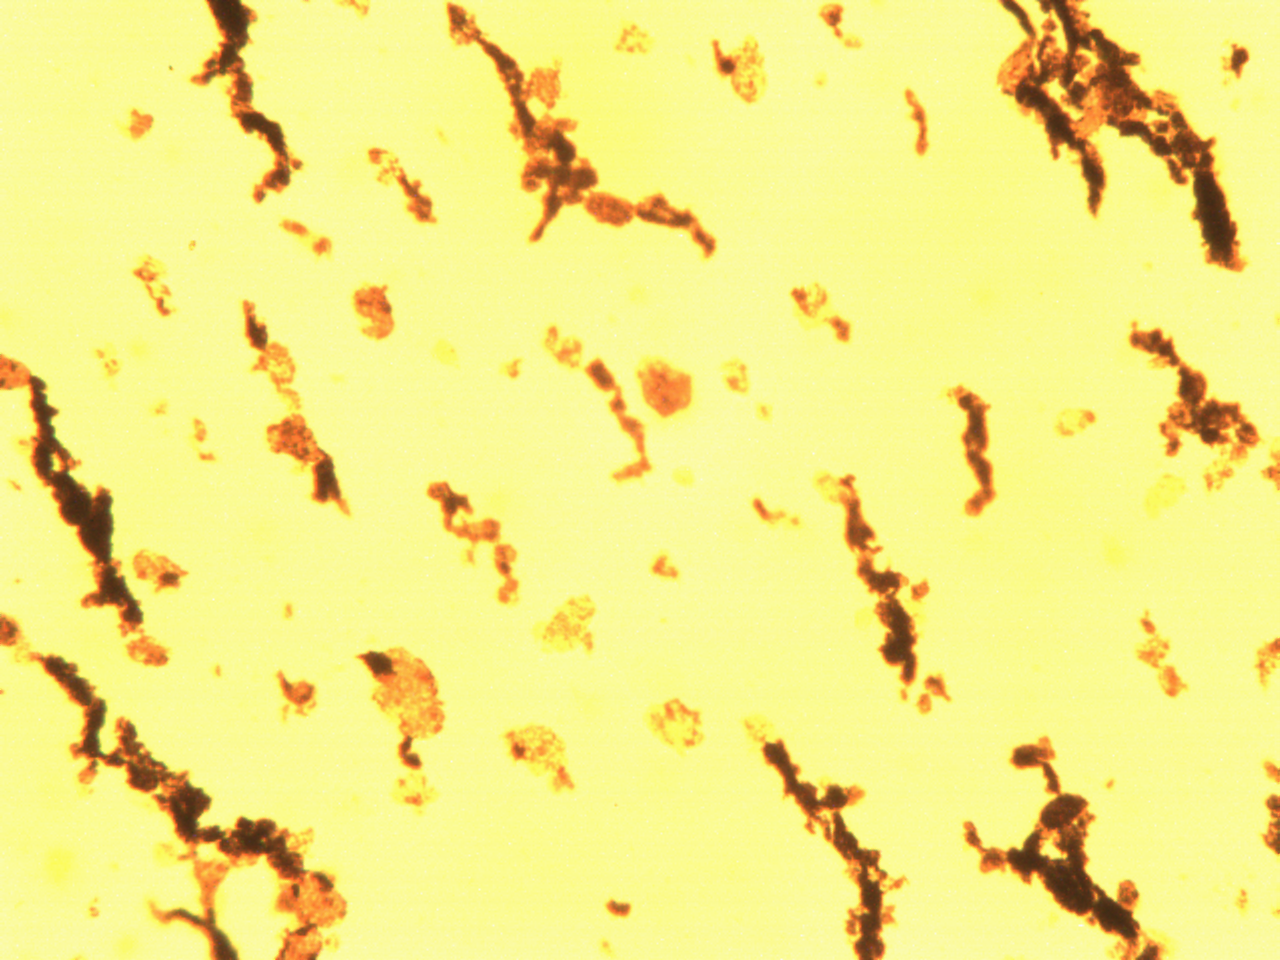
| 15:30, 24 March 2014 | 16500 heme mag solocation 3-4 20x.jpg (file) |  |
3.52 MB | |
| 15:28, 24 March 2014 | 16500 heme mag solocation 3-4 32x.jpg (file) |  |
3.52 MB | |
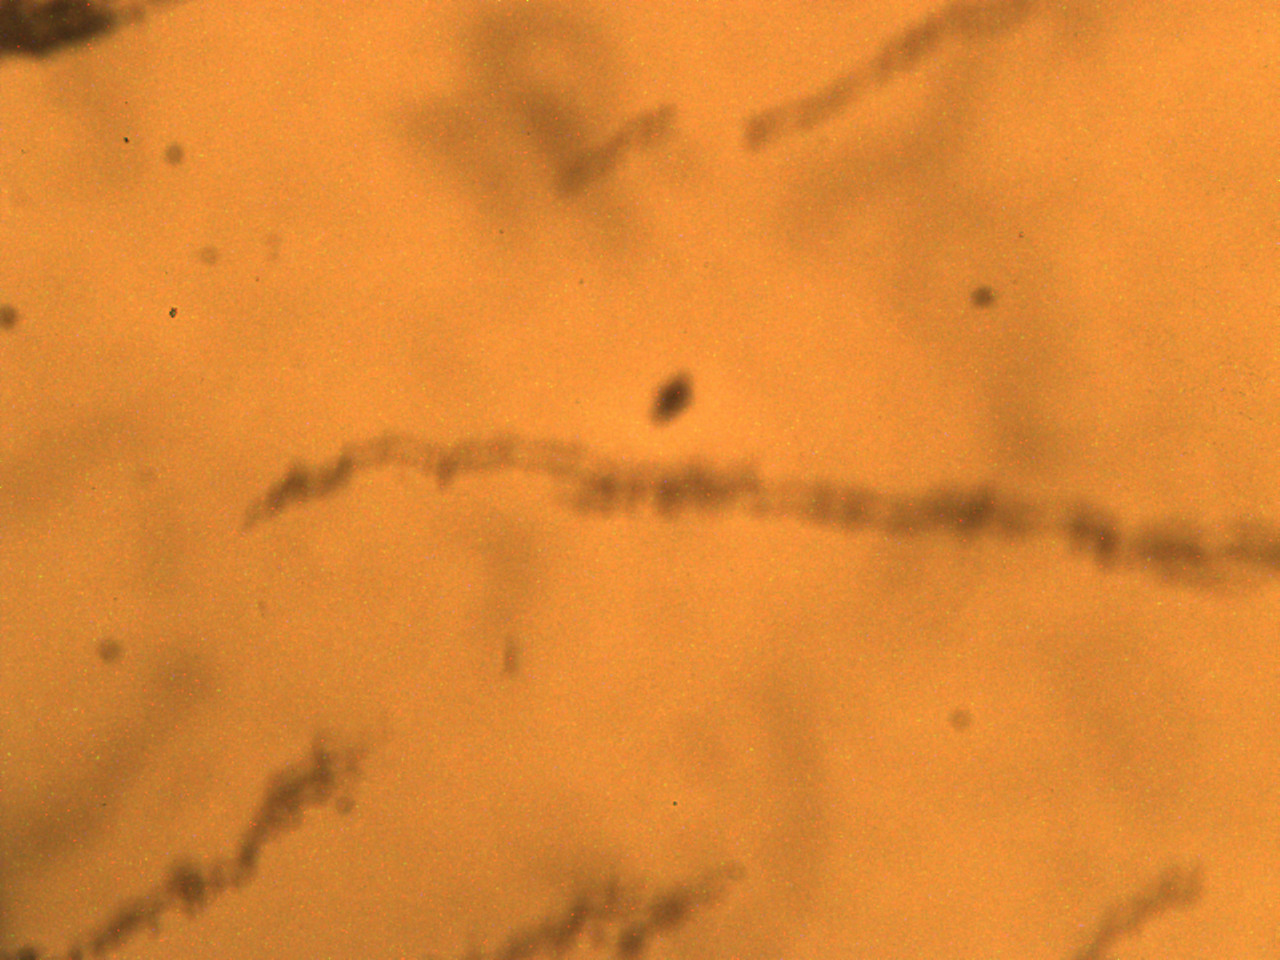
| 15:25, 24 March 2014 | 14500 heme-mag-au 3-4 2.5x.jpg (file) |  |
3.52 MB | |
| 15:23, 24 March 2014 | 14500 heme-mag-au 3-4 10x .jpg (file) |  |
3.52 MB | |
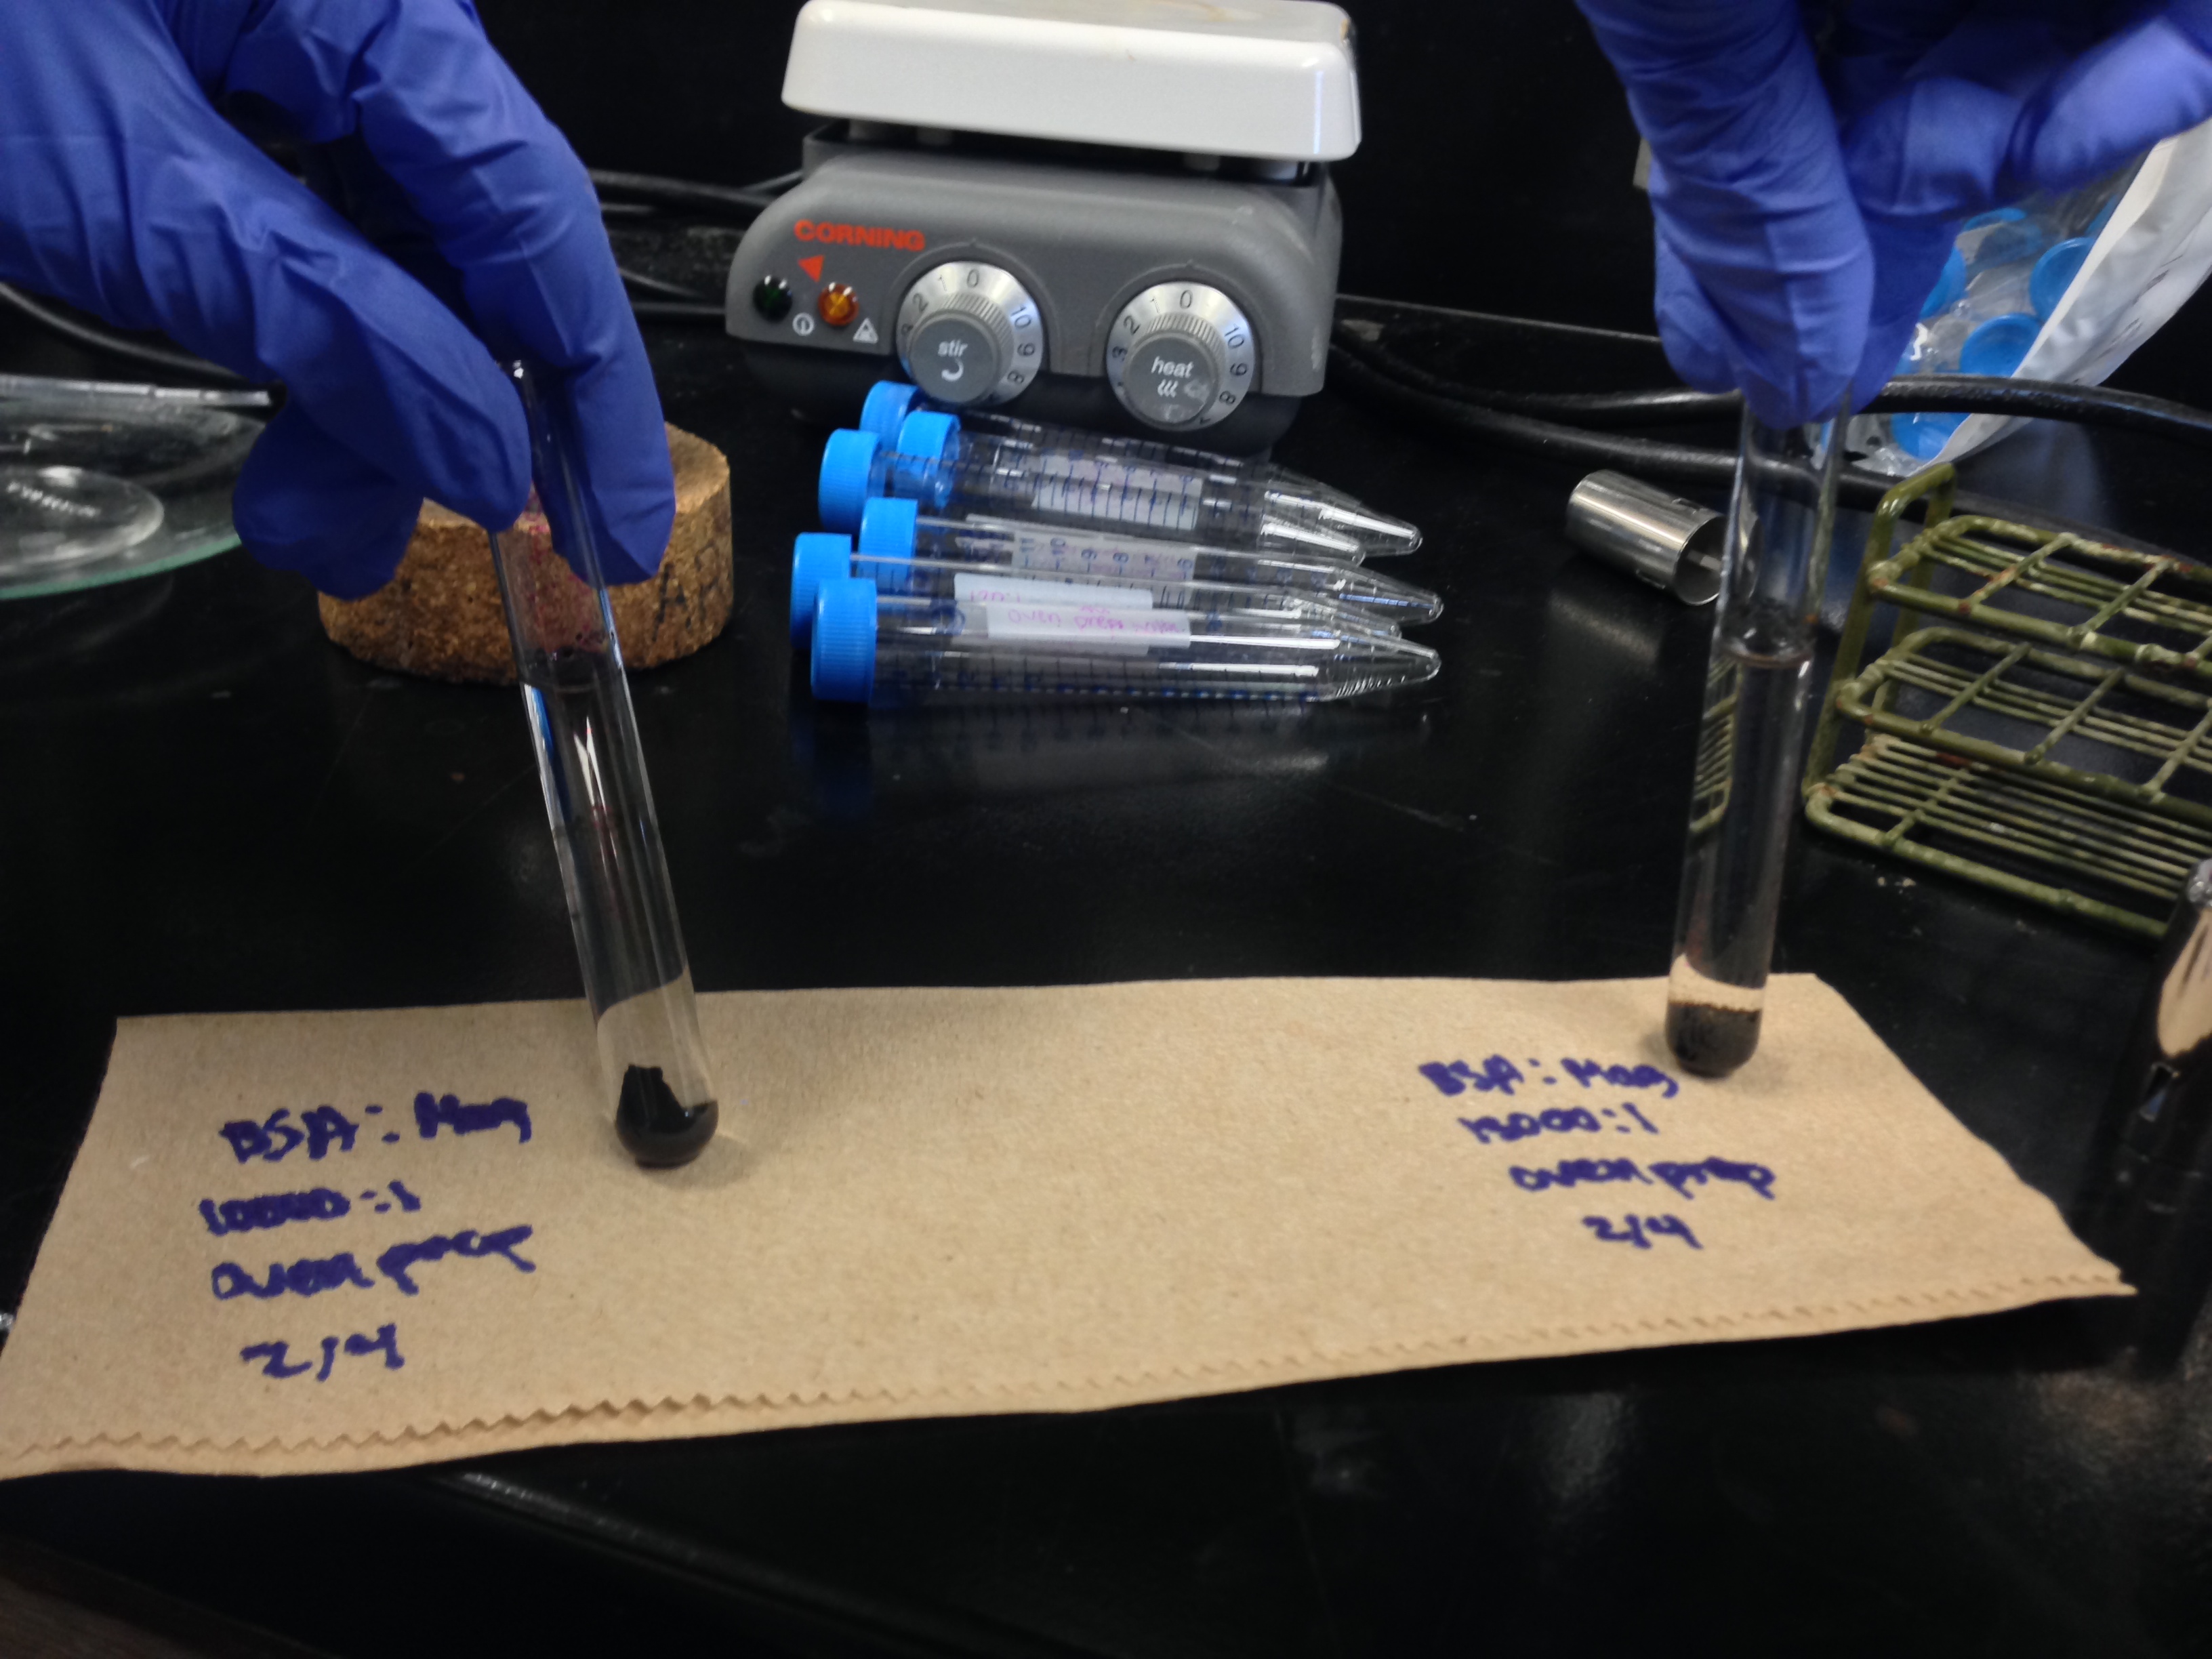
| 18:19, 19 March 2014 | BSA mag 2-4.jpeg (file) |  |
1.33 MB | |
| 23:29, 21 November 2012 | AASRound1.png (file) |  |
75 KB | |
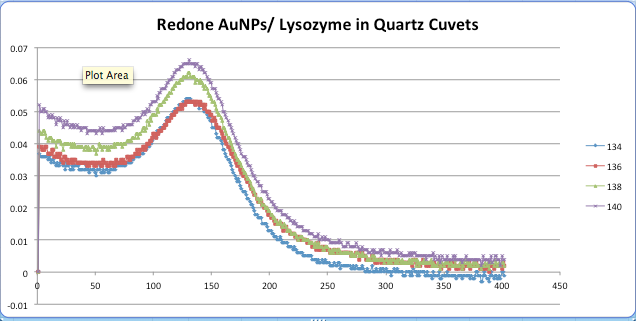
| 17:57, 15 November 2012 | Redone quartz cuvets.png (file) |  |
49 KB | |
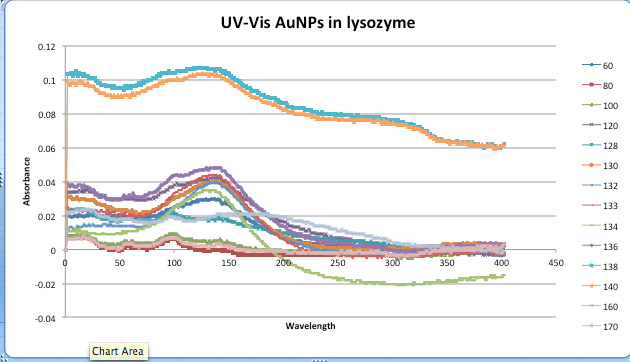
| 17:54, 15 November 2012 | UV-Vis AuNP in lysozyme.png (file) |  |
59 KB | |
| 19:18, 24 October 2012 | AAS data.xlsx (file) | 52 KB | ||
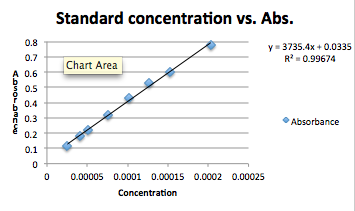
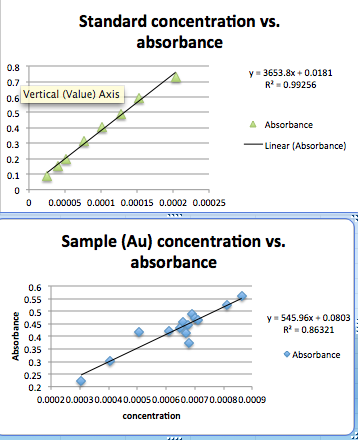
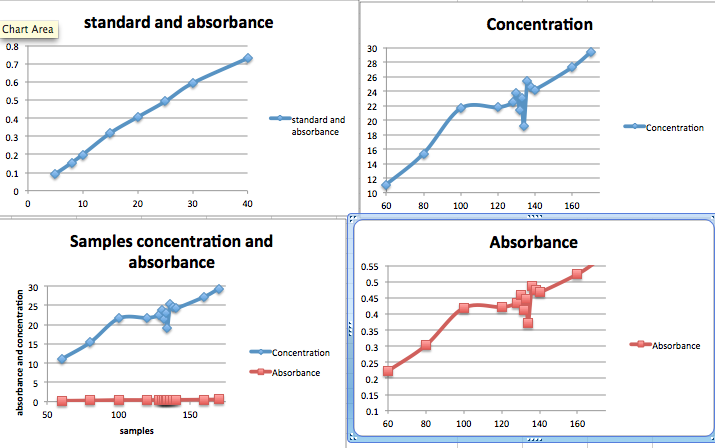
| 19:16, 24 October 2012 | AA standard.png (file) |  |
23 KB | |
| 19:00, 24 October 2012 | AA calibration cuve.png (file) |  |
43 KB | |
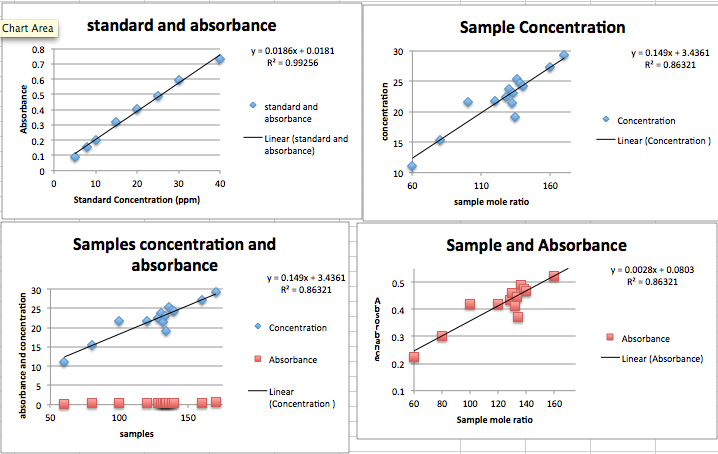
| 17:56, 24 October 2012 | AA first round.png (file) |  |
62 KB | |
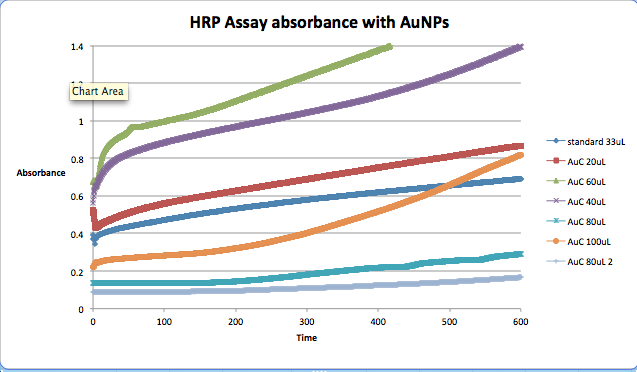
| 17:46, 5 October 2012 | HRP with AuNPs.png (file) |  |
39 KB | HRP with AuNPs |
| 16:04, 5 October 2012 | HRPruns.xlsx (file) | 112 KB | HRP and gold nanoparticle absorbance vs. time runs. | |
| 07:40, 3 October 2012 | 3760-Protocol HRP AbsorbanceAssay.pdf (file) | 125 KB | ||
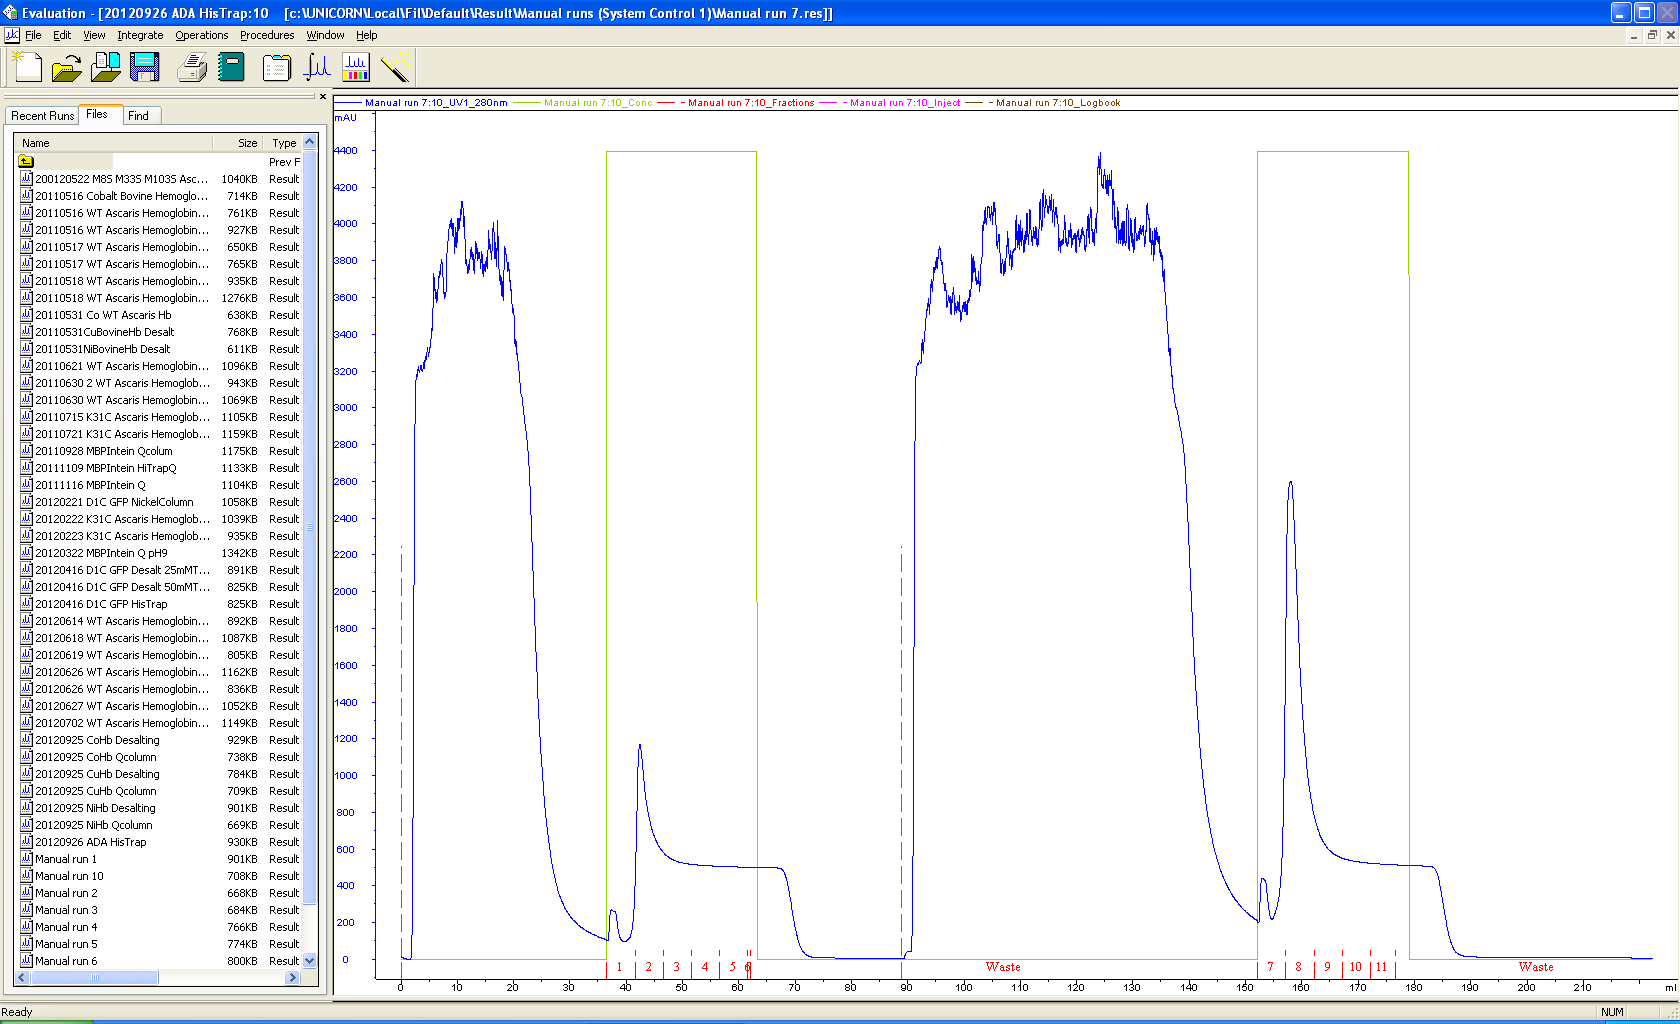
| 07:33, 3 October 2012 | ADA HisTrap.PNG (file) |  |
118 KB | Image: ADA_HisTrap.PNG |
| 06:50, 3 October 2012 | TrisvaryingmolarUVVis.xlsx (file) | 233 KB | ||
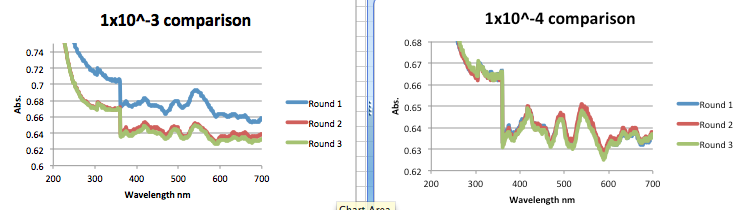
| 05:42, 3 October 2012 | 1x10^-3 compared to 1x10^-4.png (file) | 47 KB | 1x10^-3 compared to 1x10^-4 | |
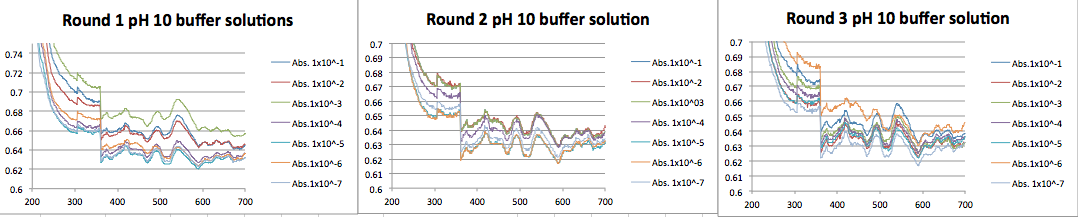
| 05:35, 3 October 2012 | AuNP in Tris buffer pH 10.png (file) | 81 KB | AuNP in Tris buffer pH 10 | |
| 05:03, 3 October 2012 | Tris Buffer AuNP pH 8.png (file) | 128 KB | Tris Buffer AuNP pH 8.png | |
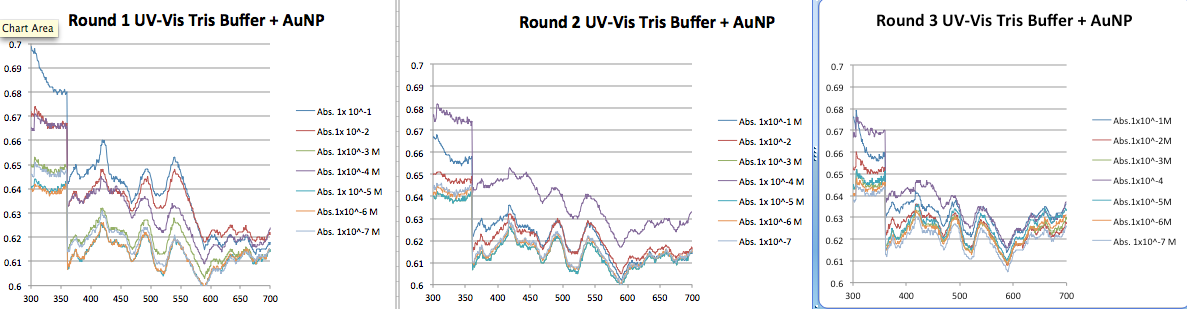
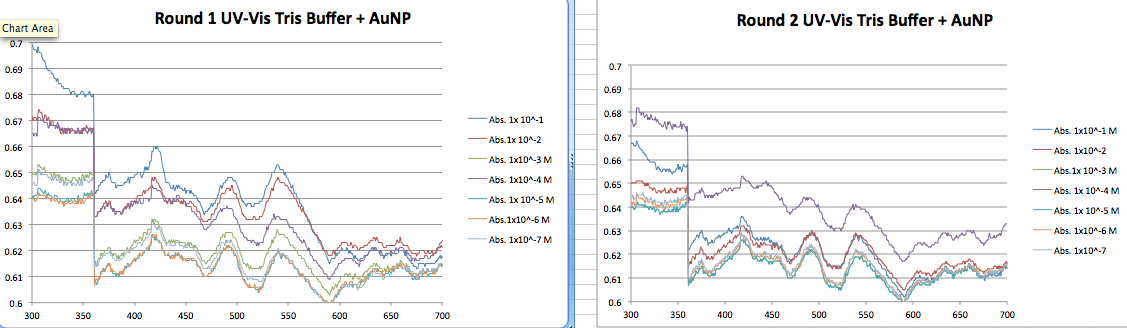
| 04:48, 3 October 2012 | Runs 1 and 2 AuNP and Tris buffer.png (file) |  |
109 KB | Runs 1 and 2 AuNP and Tris buffer |
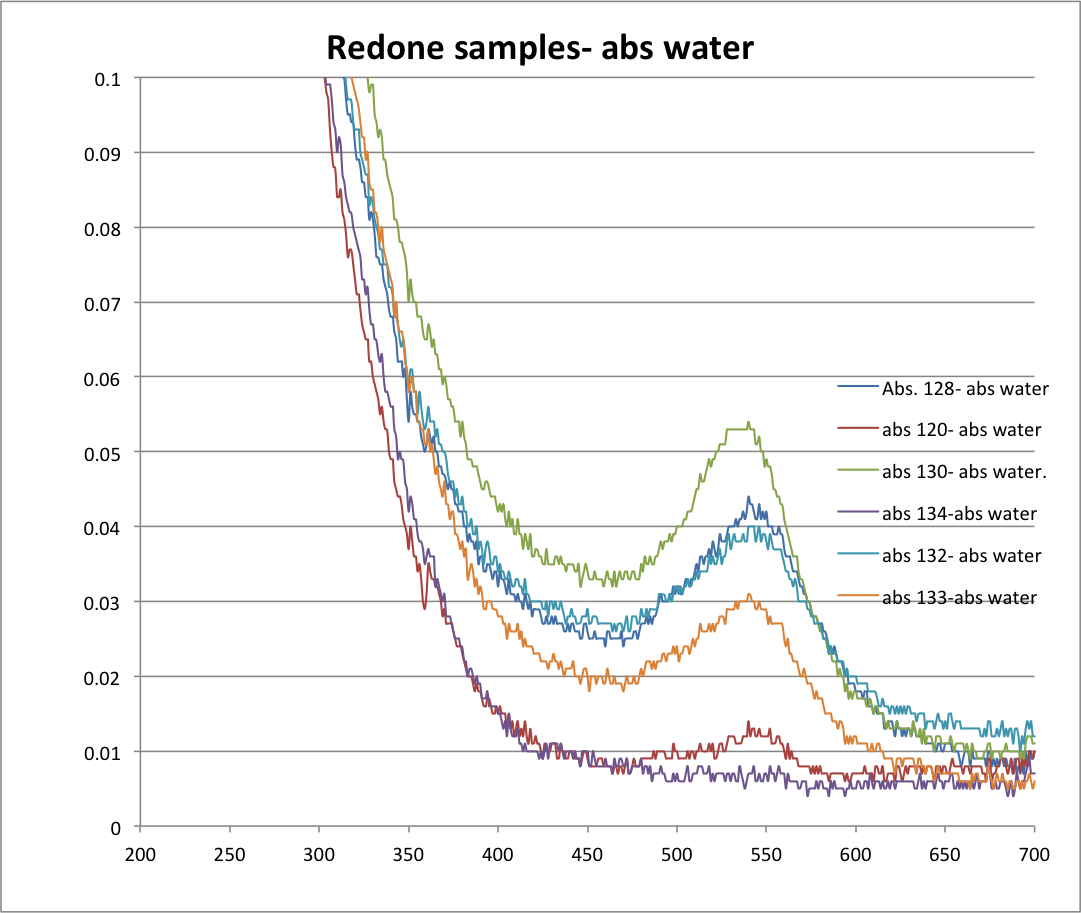
| 04:33, 3 October 2012 | Redone-abs water.png (file) |  |
172 KB | Image:Redone-abs_water.png |
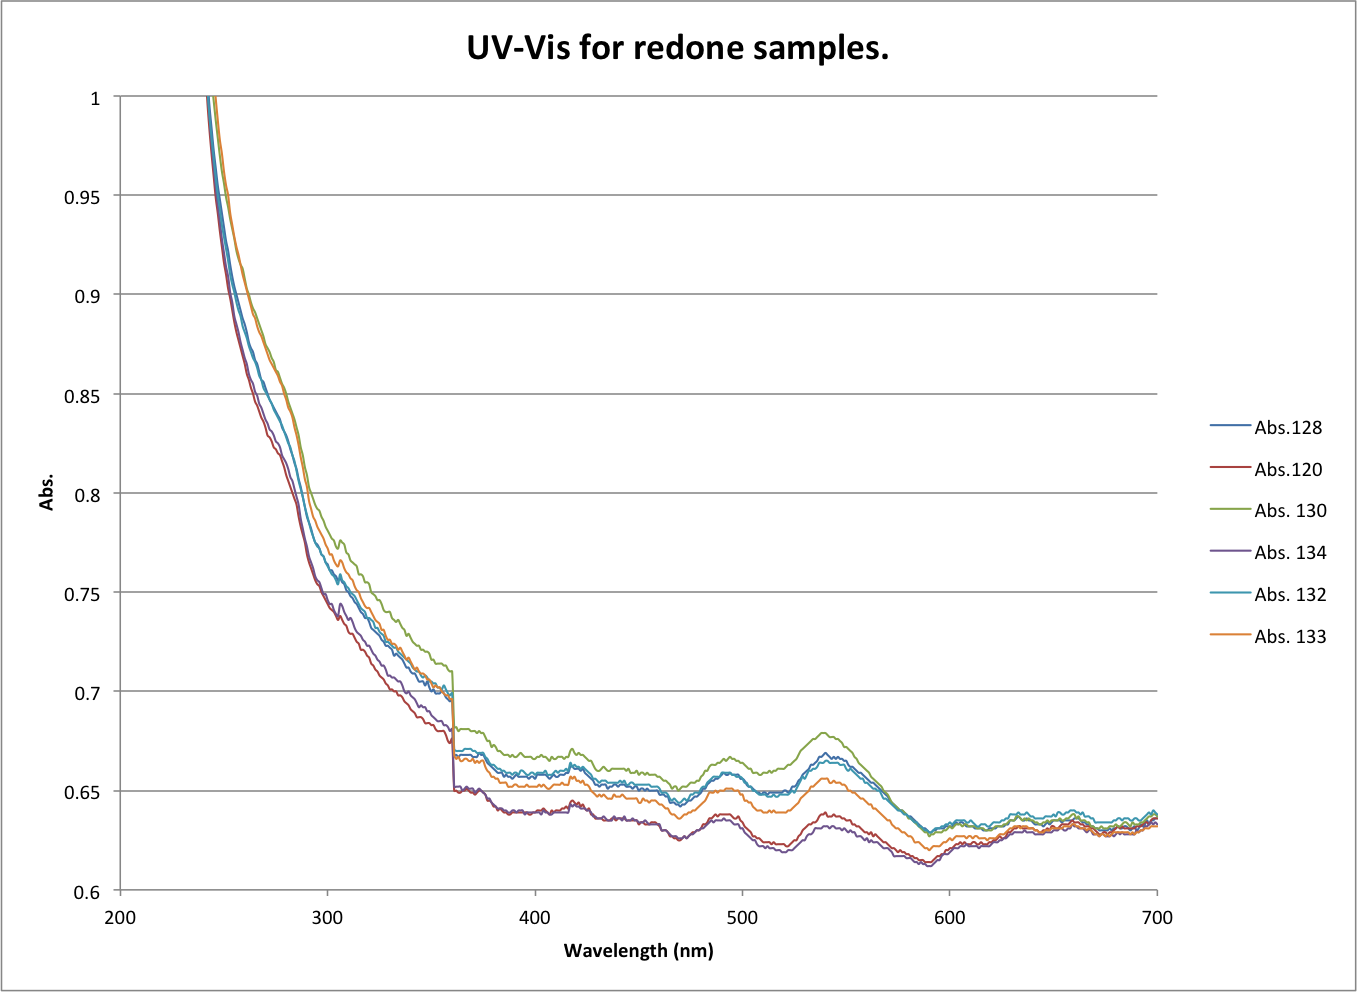
| 04:27, 3 October 2012 | Uv vis redone.png (file) |  |
140 KB | UV-Vis redone |
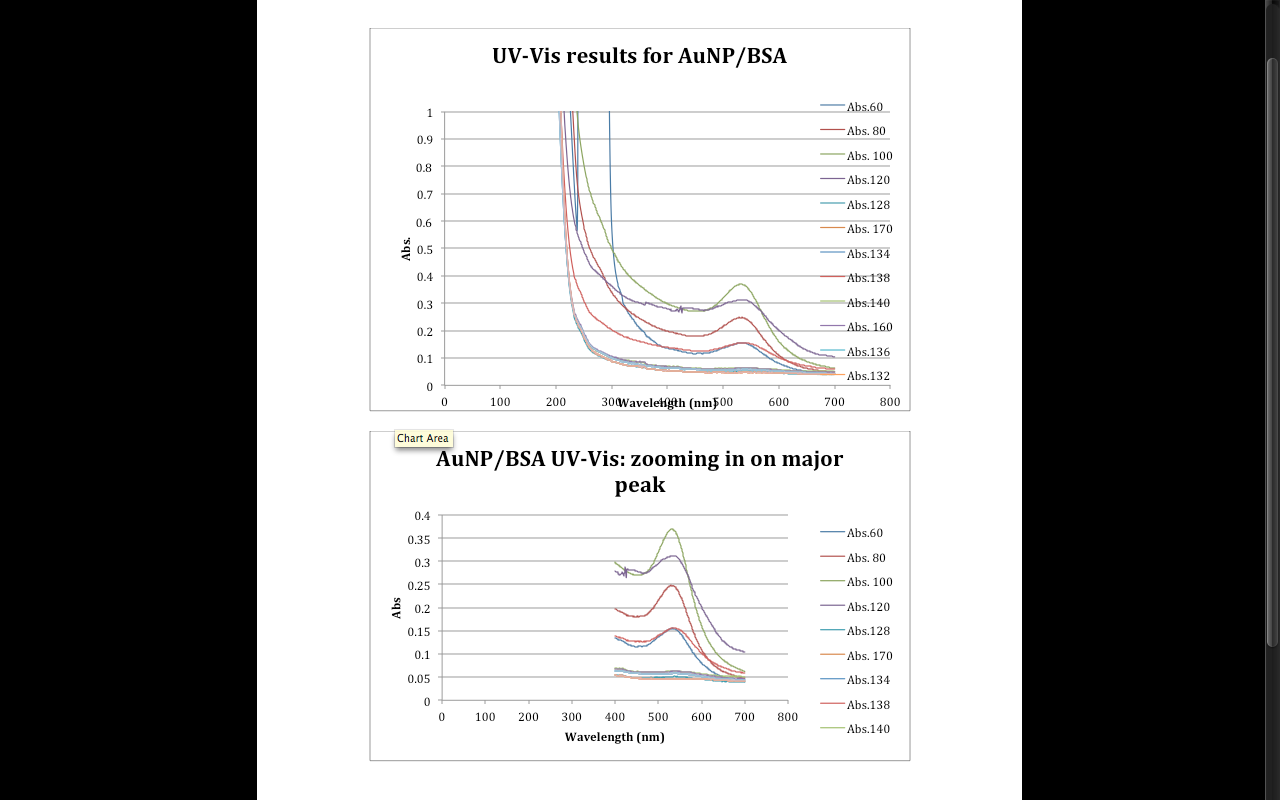
| 03:58, 3 October 2012 | AuNP UV-Vis.png (file) |  |
97 KB | BSa/AuNP UV-Vis |
| 03:35, 3 October 2012 | Screen Shot 2012-10-02 at 11.35.35 PM.png (file) |  |
356 KB | |
| 22:04, 12 September 2012 | AuNP in tris buffer pH 10.xlsx (file) | 375 KB | ||
| 18:43, 12 September 2012 | Tris buffer AuNP UV-Vis pH 8.xlsx (file) | 360 KB | ||
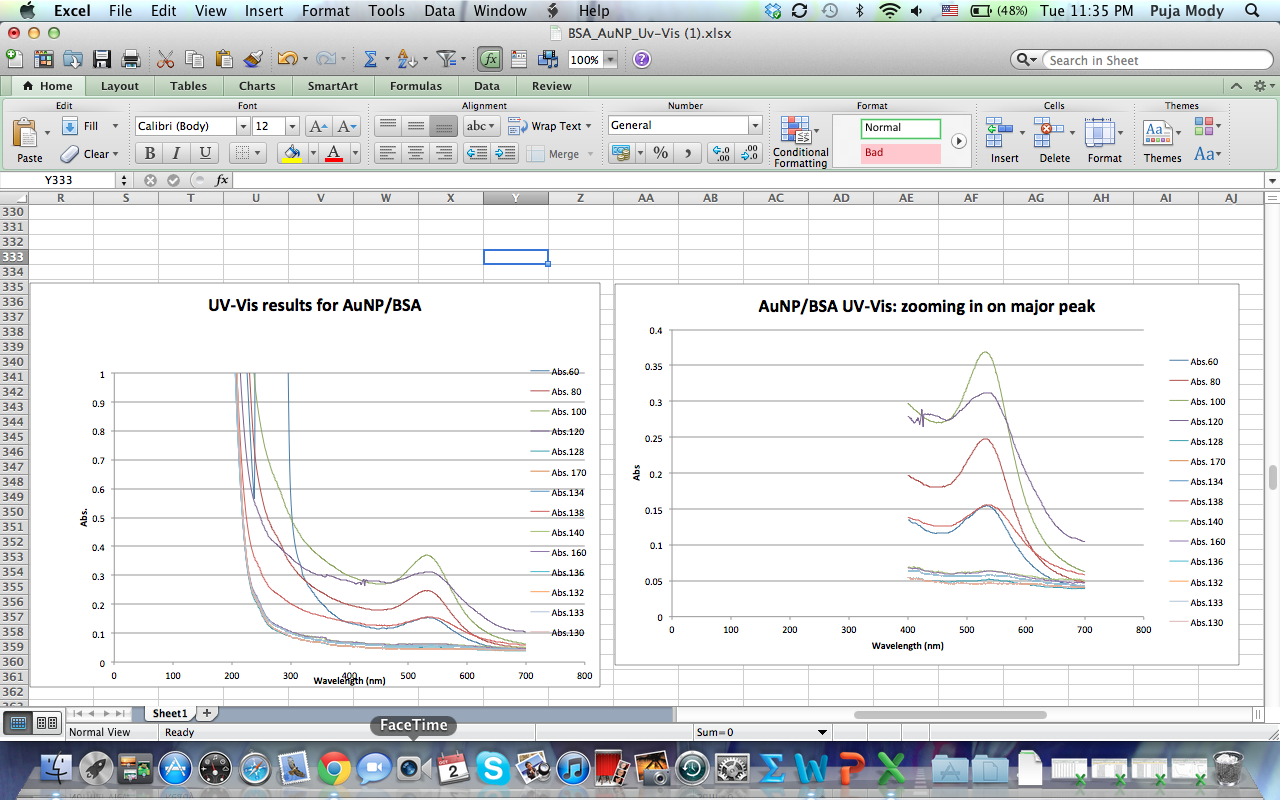
| 17:39, 12 September 2012 | Chem- Redone AuNP-BSA.xlsx (file) | 14.19 MB | ||
| 17:00, 12 September 2012 | BSA AuNP Uv-Vis.xlsx (file) | 223 KB | This spreadsheet shows the abs values between wavelengths 200nm-700nm of the AuNP/BSA solution. The two graphs at the bottom show the obvious peak at approximately 550nm. | |
| 02:35, 10 September 2012 | BSA AuNP concentrations.xlsx (file) | 40 KB | amounts of BSA and AuNP stock solution combined with water to get the desired concentration solution. |
