Uploads by Noah Benjamin
From OpenWetWare
Jump to navigationJump to search
This special page shows all uploaded files.
| Date | Name | Thumbnail | Size | Description |
|---|---|---|---|---|
| 02:04, 22 September 2012 | Cross-Linking PVA.docx (file) | 121 KB | ||
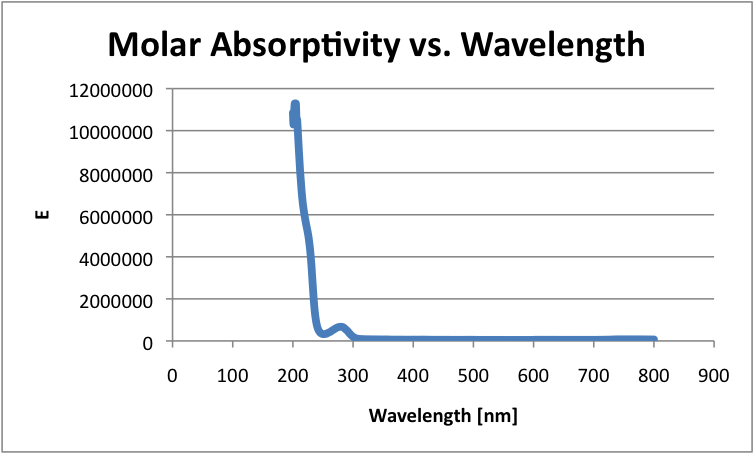
| 11:53, 11 October 2011 | Oct5MolarAbsorbtivity.png (file) |  |
38 KB | |
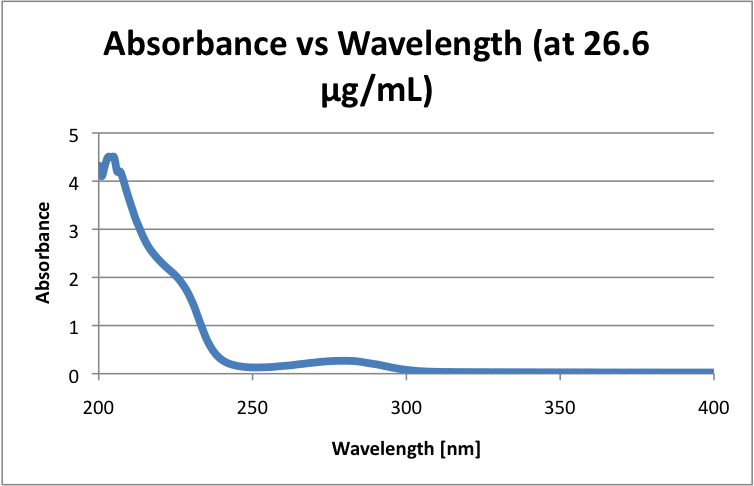
| 11:52, 11 October 2011 | Oct5UVSpec.png (file) |  |
39 KB | |
| 14:15, 5 October 2011 | GoldNPsCorrectConcentration500nm.png (file) |  |
41 KB | |
| 14:15, 5 October 2011 | GoldNPsCorrectConcentration.png (file) |  |
50 KB | |
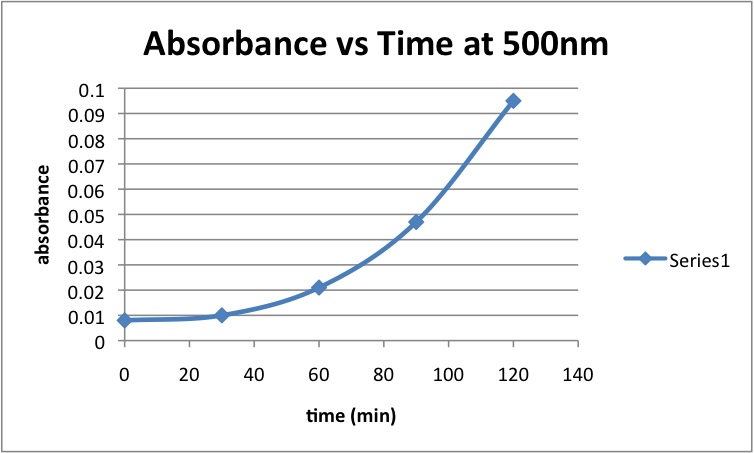
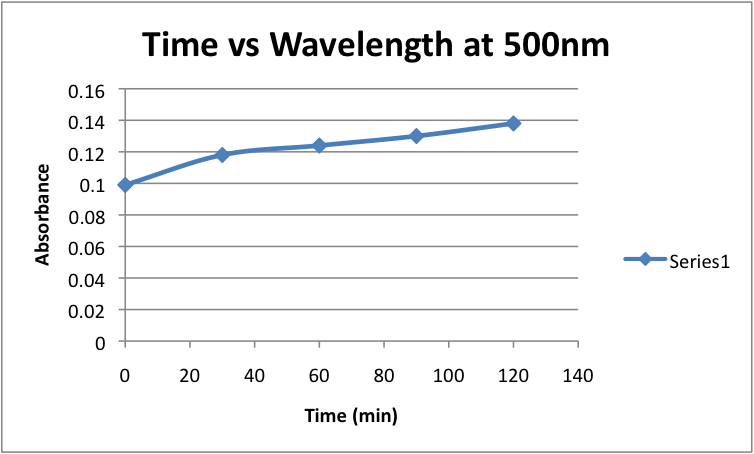
| 13:46, 5 October 2011 | GoldNPsControlledTemp500nm.png (file) |  |
36 KB | |
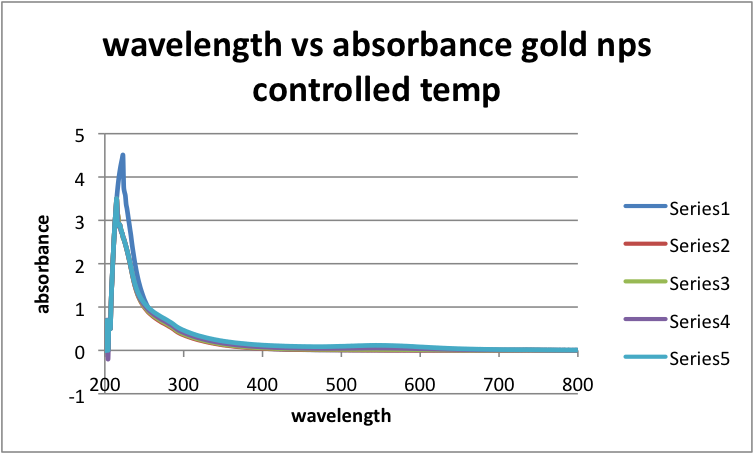
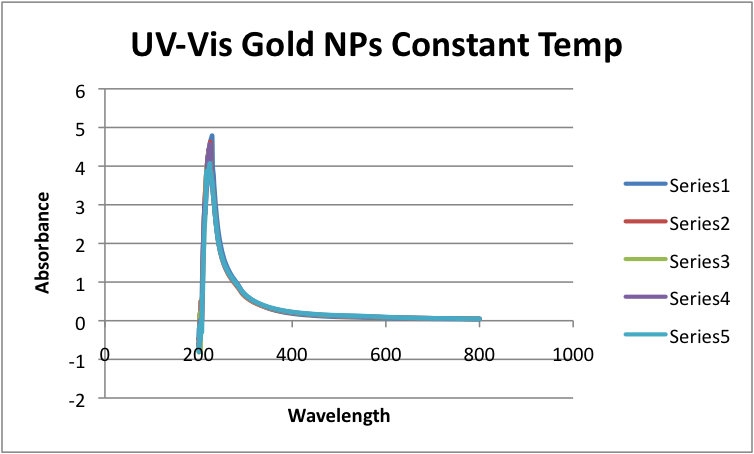
| 13:45, 5 October 2011 | GoldNPsControlledTemp.png (file) |  |
45 KB | |
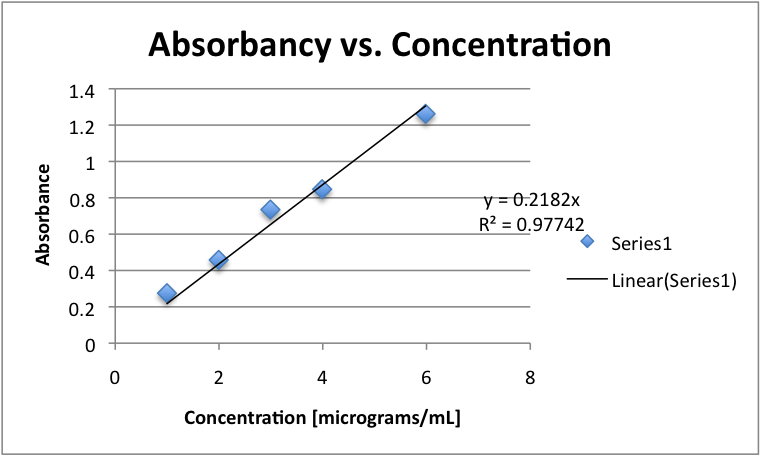
| 18:34, 21 September 2011 | AdjustedCalibrationCurve.png (file) |  |
46 KB | |
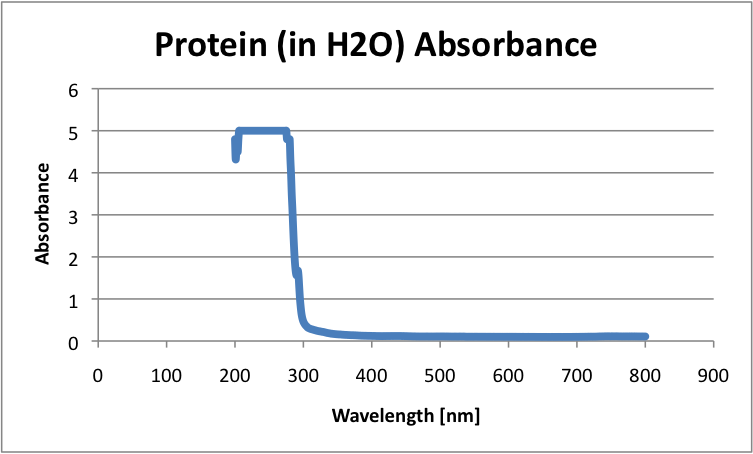
| 18:34, 21 September 2011 | Protein"Blank"Absorbance.png (file) | 34 KB | ||
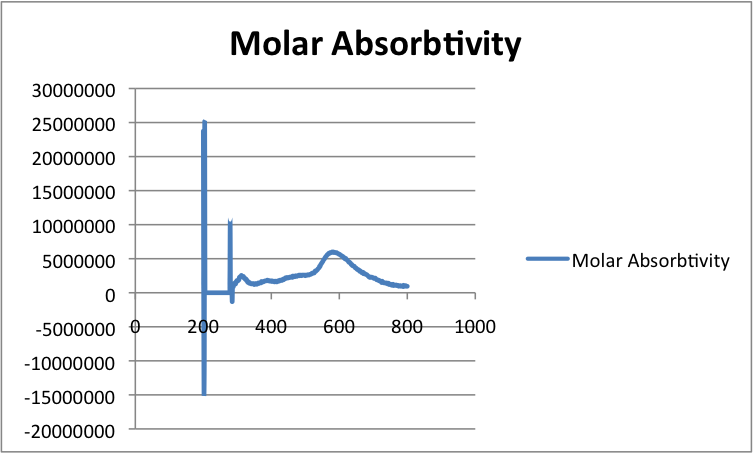
| 18:33, 21 September 2011 | Protein"Blank"MolarAbsorbtivity.png (file) | 38 KB | ||
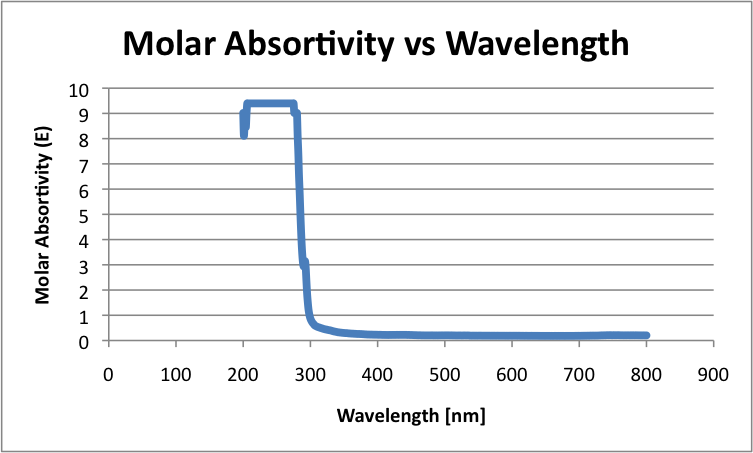
| 12:51, 20 September 2011 | MolarAbsorbtivity.png (file) |  |
39 KB | |
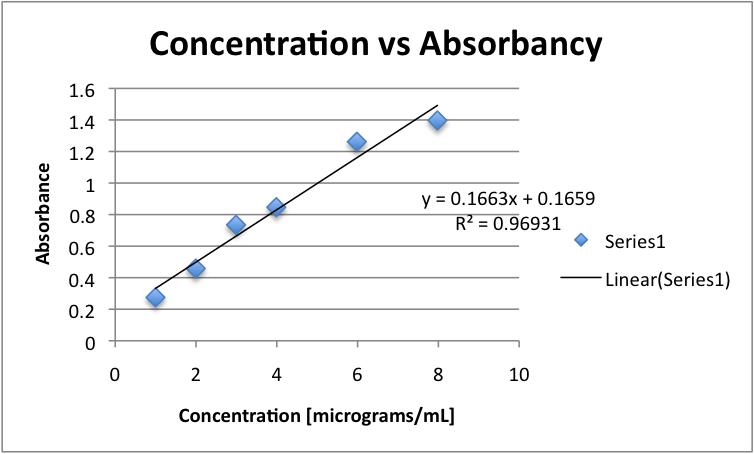
| 12:32, 20 September 2011 | CvsAbs.png (file) |  |
49 KB | |
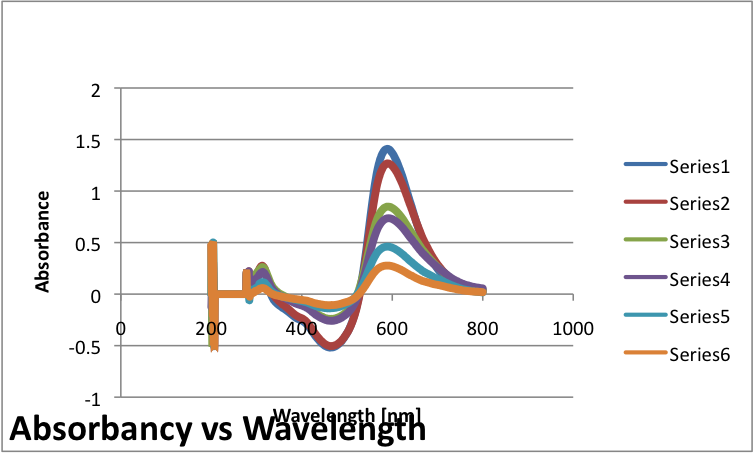
| 12:32, 20 September 2011 | AbsvsWavelength.png (file) |  |
56 KB | |
| 12:31, 20 September 2011 | Proteinabs.png (file) |  |
34 KB | |
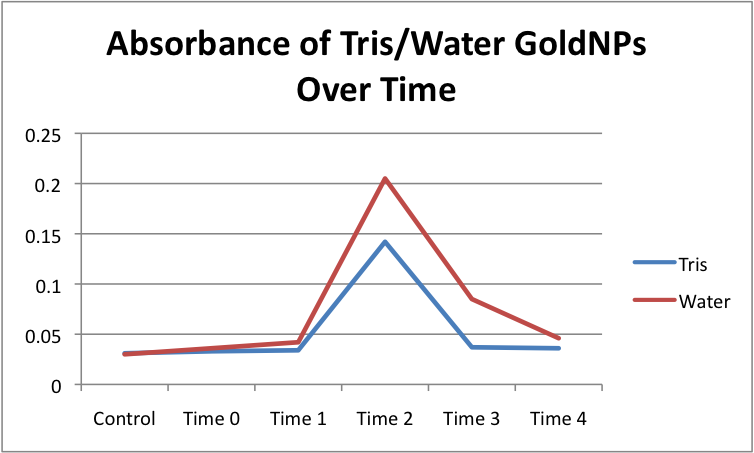
| 06:09, 13 September 2011 | AbsorbanceOverTime.png (file) |  |
45 KB | Graph from 9/7 |
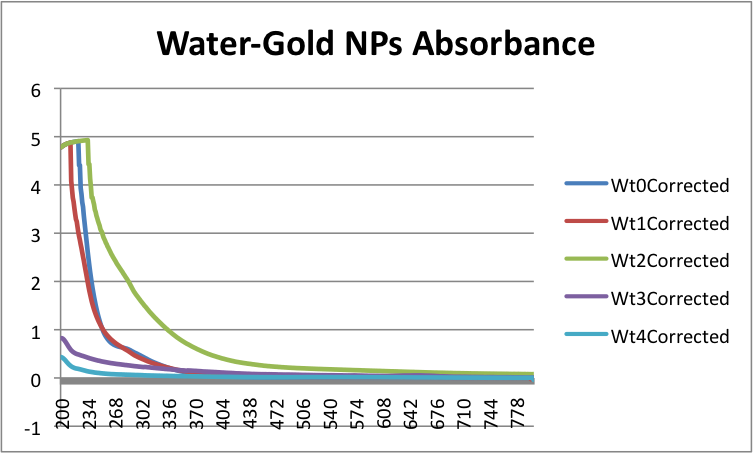
| 06:08, 13 September 2011 | Water-GoldNPsAbsorbance.png (file) |  |
57 KB | Graph from 9/7 |
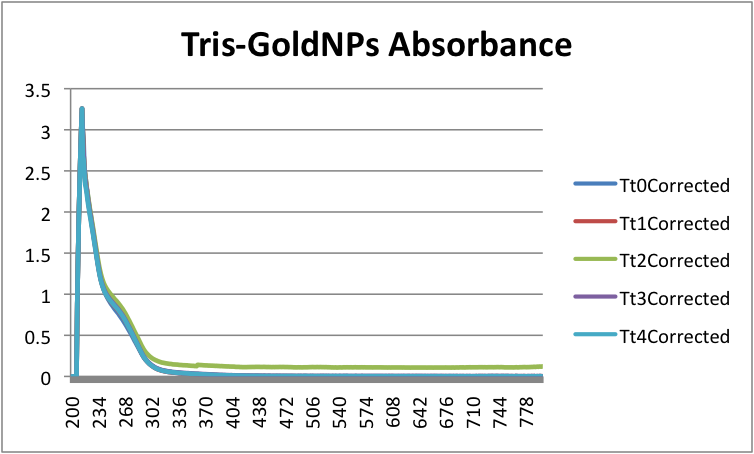
| 06:07, 13 September 2011 | Tris-GoldNPsAbsorbance.png (file) |  |
50 KB | Graph from 9/7 |
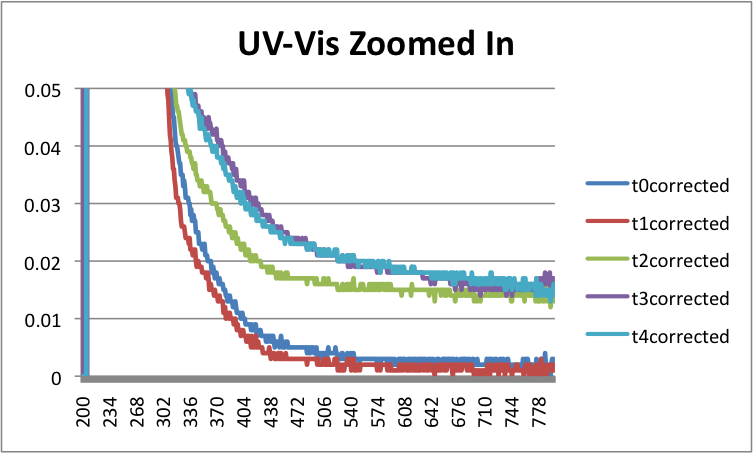
| 14:39, 7 September 2011 | GoldNPsZoomed.png (file) |  |
67 KB | zoomed in UV Spec of gold nanoparticle |
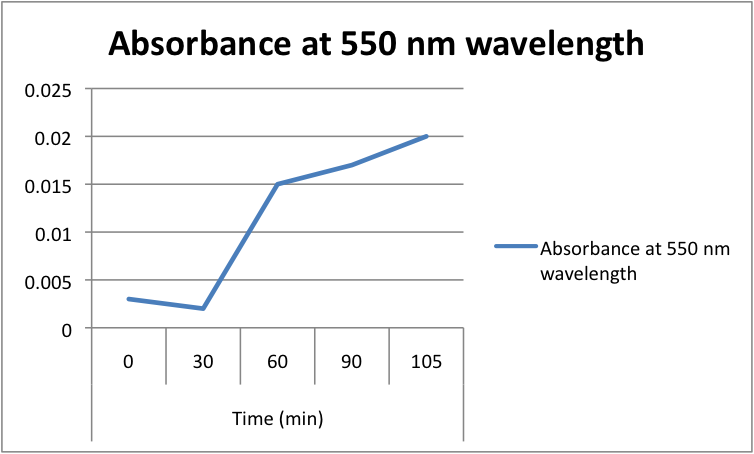
| 04:32, 6 September 2011 | GoldNPsGraphWavelength550.png (file) |  |
37 KB | Graph of UV Spec. at wavelength 550nm for 0.0013 grams of BSA and 0.0007 grams of HAuCl4 in 10 mL of 7.55 pH 50 mM Tris Solution measured at intervals of 30 minutes. Graph data is corrected for a control. |
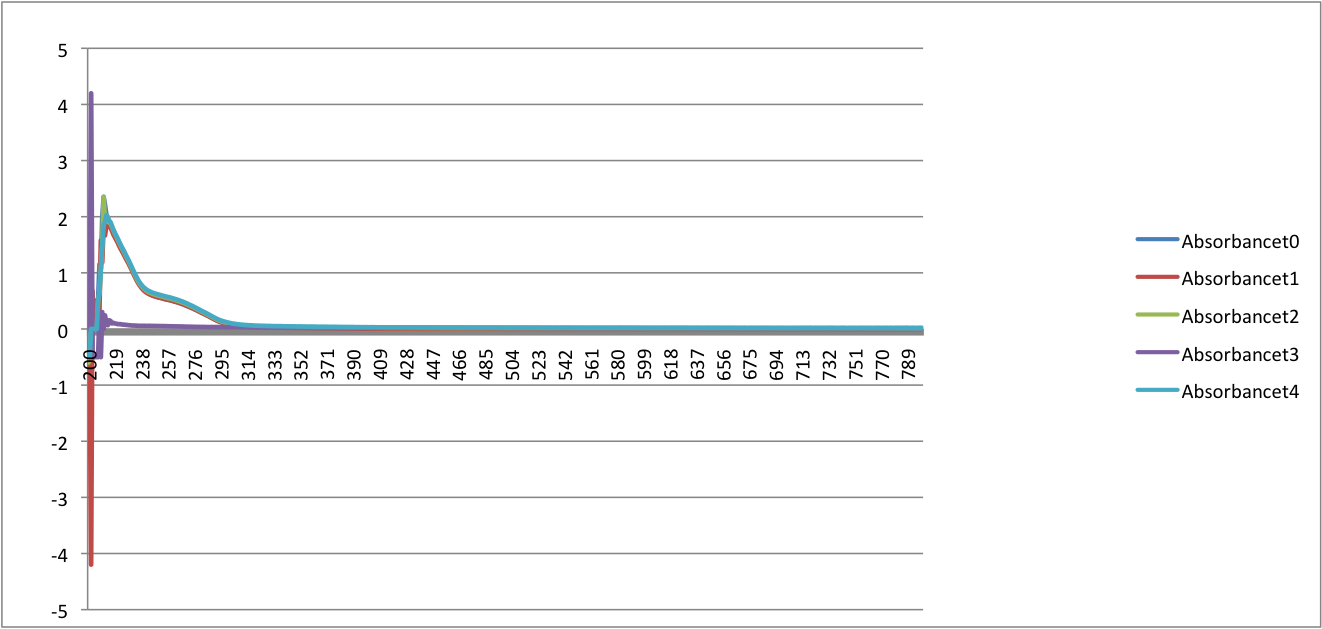
| 04:27, 6 September 2011 | GoldNanoparticleUVSpec.png (file) |  |
65 KB | Graph of UV Spec. for 0.0013 grams of BSA and 0.0007 grams of HAuCl4 in 10 mL of 7.55 pH 50 mM Tris Solution measured at intervals of 30 minutes. Graph data is corrected for a control. |
