Help
Uploads by Melvin Colorado Escobar
From OpenWetWare
Jump to navigation
Jump to search
This special page shows all uploaded files.
File list
Items per page:
20
50
100
250
500
Username:
Include old versions of files
Show file list
Date
Name
Thumbnail
Size
Description
18:06, 12 December 2015
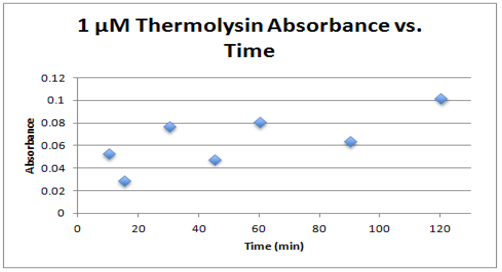
1 um thermolysin absorbance vs time.PNG
(
file
)
27 KB
18:05, 12 December 2015
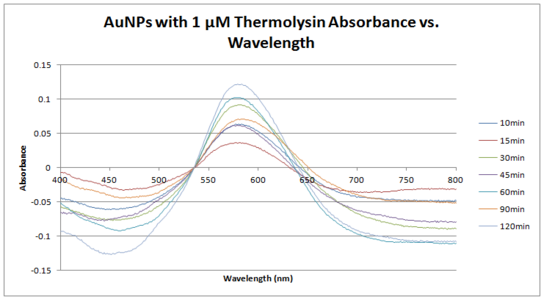
1um thermolysin absorbance vs wavelength.PNG
(
file
)
52 KB
18:04, 12 December 2015
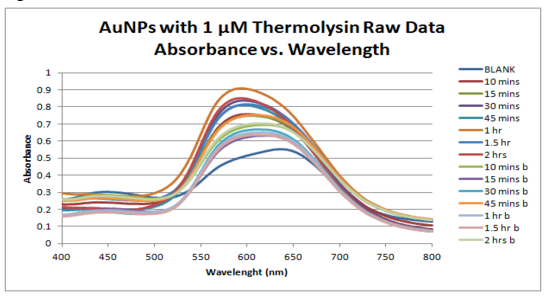
Raw Data AuNPs with 1 uM Thermolysin Absorbance vs. Wavelength.PNG
(
file
)
76 KB
17:57, 12 December 2015
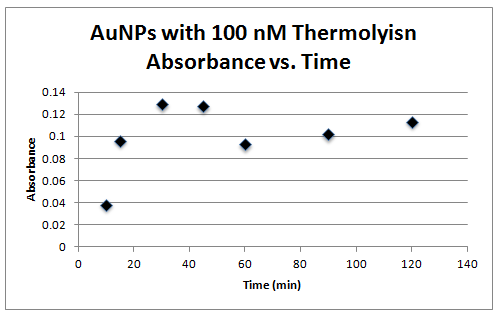
100 nm thermolysin absorbance vs time.PNG
(
file
)
9 KB
17:57, 12 December 2015
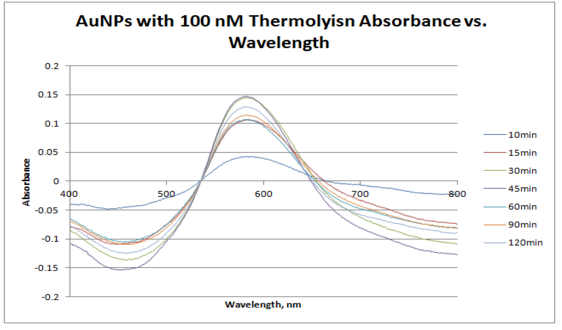
100 nM thermolysin absorbance vs wavelength.PNG
(
file
)
55 KB
17:56, 12 December 2015
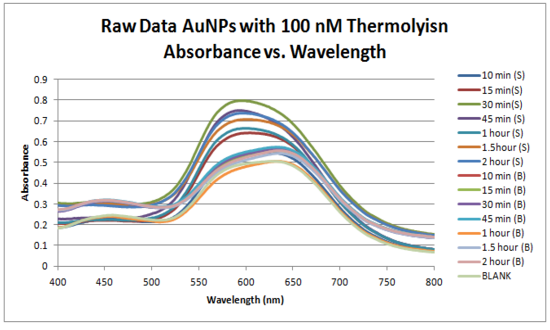
Raw Data AuNPs with 100 nM Thermolysin Absorbance vs. Wavelength.PNG
(
file
)
87 KB
17:38, 12 December 2015
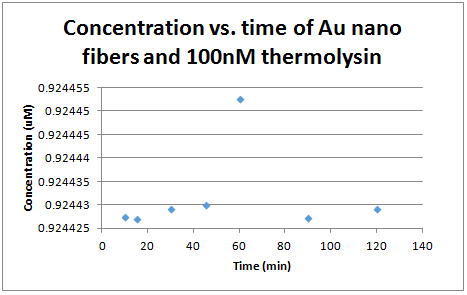
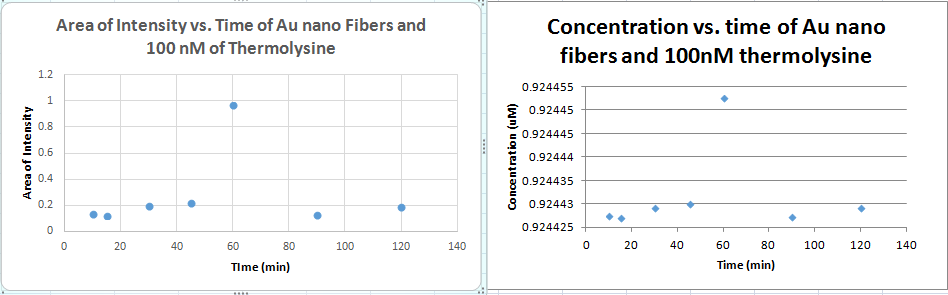
100 nm thermolysin concetration vs. time.PNG
(
file
)
8 KB
17:38, 12 December 2015
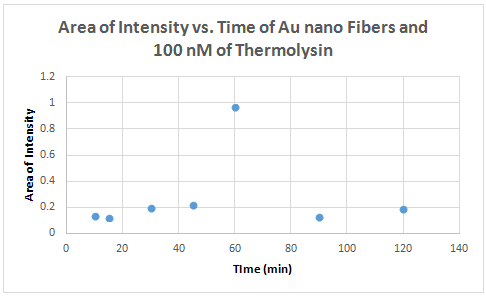
100 nM thermolysin area of intensity vs time.PNG
(
file
)
8 KB
17:37, 12 December 2015
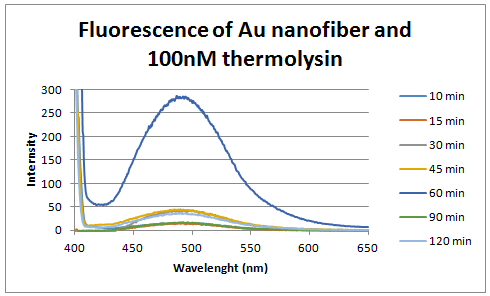
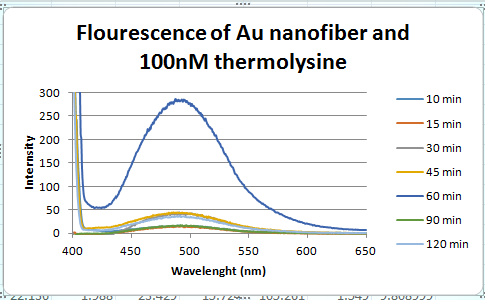
100 nM thermolysin intensity vs wavelength.PNG
(
file
)
17 KB
17:36, 12 December 2015
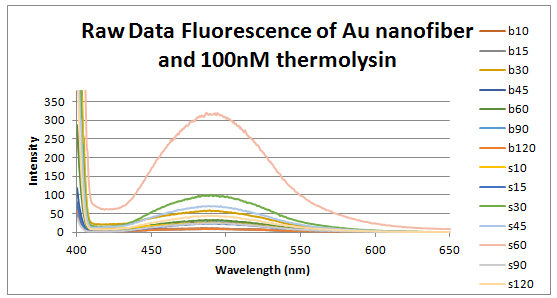
Raw data 100 nm thermolysin intensity vs wavelength.PNG
(
file
)
24 KB
17:15, 12 December 2015
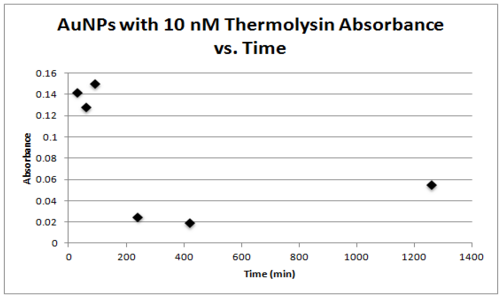
10 nm thermolysin absorbance vs time.PNG
(
file
)
28 KB
17:14, 12 December 2015
10 nM thermolysin absorbance vs wavelength 1.PNG
(
file
)
51 KB
17:13, 12 December 2015
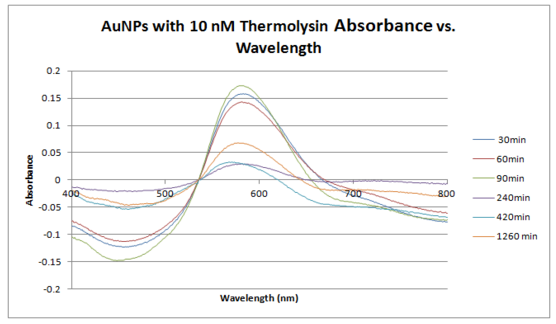
10 nM thermolysin absorbance vs wavelength.PNG
(
file
)
51 KB
17:12, 12 December 2015
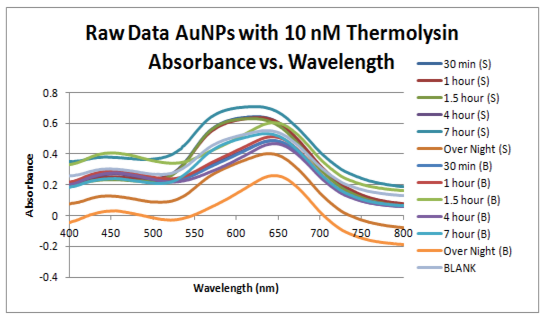
Raw Data AuNPs with 10 nM Thermolysin Absorbance vs. Wavelength.PNG
(
file
)
89 KB
17:07, 12 December 2015
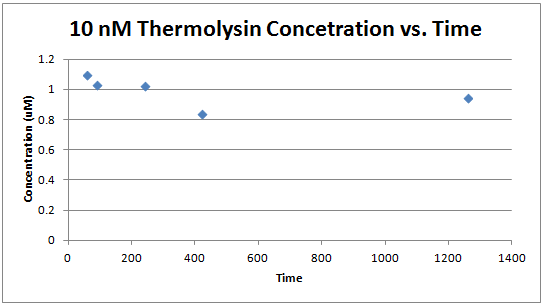
10 nm thermolysin concetration vs. time.PNG
(
file
)
6 KB
17:06, 12 December 2015
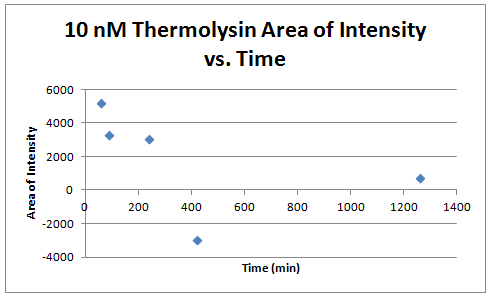
10 nm thermolysin area vs. time.PNG
(
file
)
7 KB
17:06, 12 December 2015
10 nm thermolysin intensity vs. time.PNG
(
file
)
21 KB
17:05, 12 December 2015
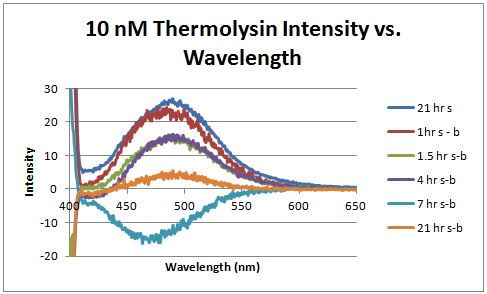
Raw data 10 nm thermolysin intensity vs wavelength.PNG
(
file
)
22 KB
16:54, 12 December 2015
1 nm thermolysin concetration vs. time.PNG
(
file
)
9 KB
16:54, 12 December 2015
1 nm thermolysin area vs. time.PNG
(
file
)
7 KB
16:53, 12 December 2015
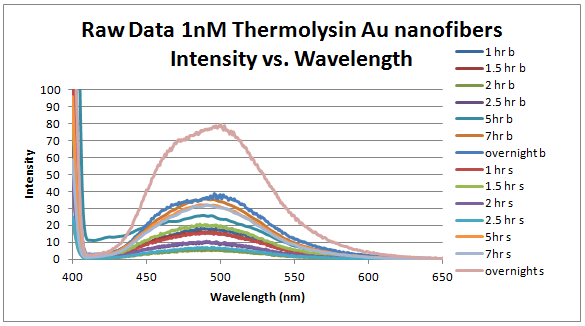
1 nm thermolysin intensity vs wavelength.PNG
(
file
)
62 KB
16:48, 12 December 2015
Raw data 1 nm thermolysin intensity vs wavelength.PNG
(
file
)
30 KB
16:27, 12 December 2015
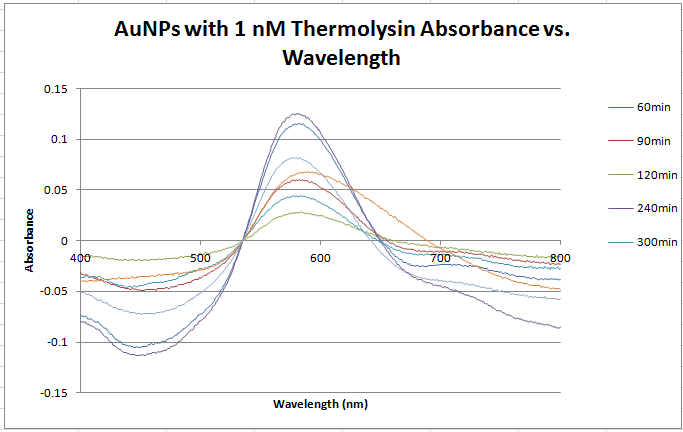
Corrected data 1nM thermolysin absorbancne vs wavelength.PNG
(
file
)
29 KB
16:26, 12 December 2015
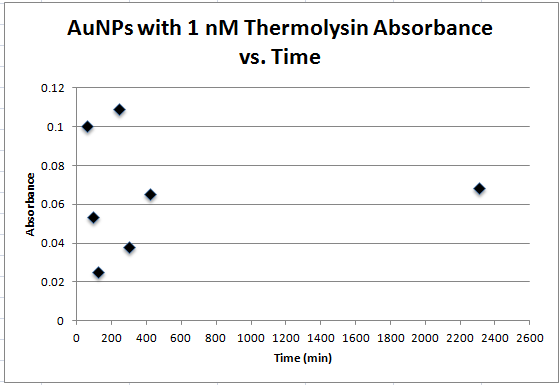
Absorbance vs time 1nm Thermolysin.PNG
(
file
)
12 KB
16:25, 12 December 2015
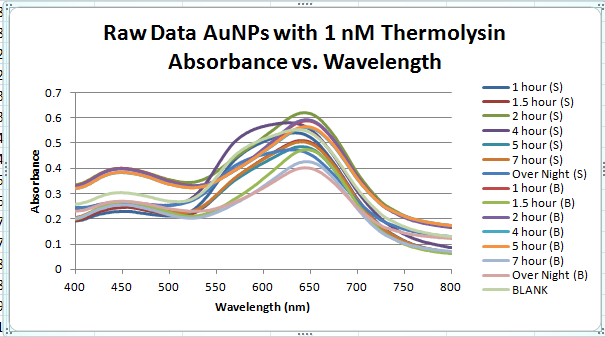
Raw Data AuNPs with 1 nM Thermolysin Absorbance vs. Wavelength.PNG
(
file
)
41 KB
19:11, 27 November 2015
Flourescence of 100 nm concetrations.PNG
(
file
)
19 KB
19:08, 27 November 2015
Flourescence of 100 nm.PNG
(
file
)
20 KB
19:04, 27 November 2015
Flourescence of 1um concentrations.PNG
(
file
)
16 KB
19:01, 27 November 2015
Flourescence of 1um.PNG
(
file
)
14 KB
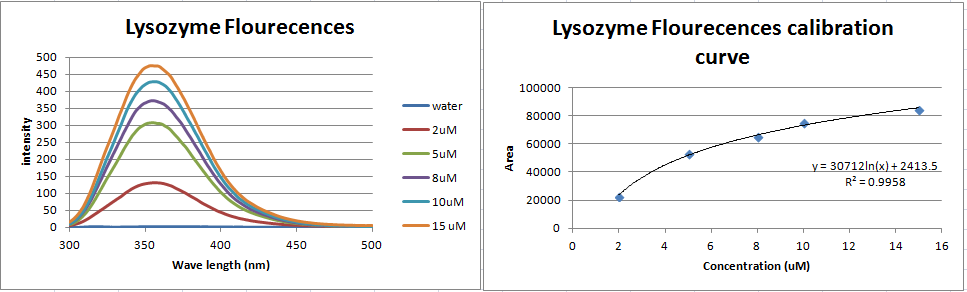
16:10, 26 November 2015
Lysozyme flourescences calobration curve.PNG
(
file
)
27 KB
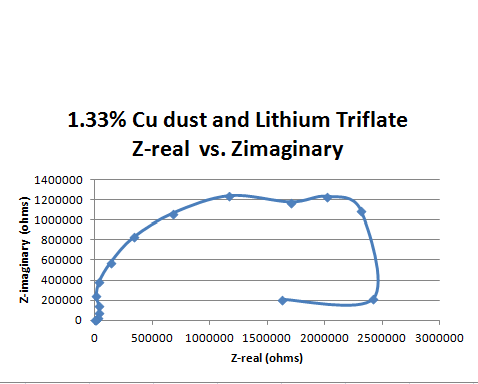
01:04, 2 May 2015
Cu film graph 1.PNG
(
file
)
11 KB
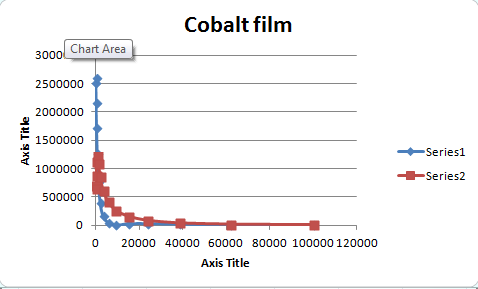
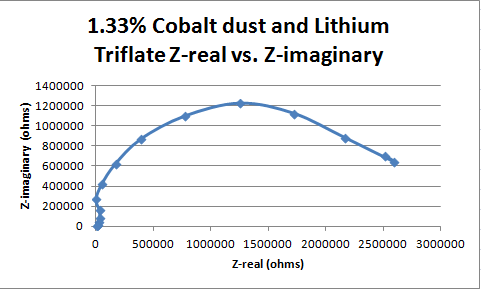
00:57, 2 May 2015
Co film graph 2.PNG
(
file
)
9 KB
00:48, 2 May 2015
Co film graph 1.PNG
(
file
)
10 KB
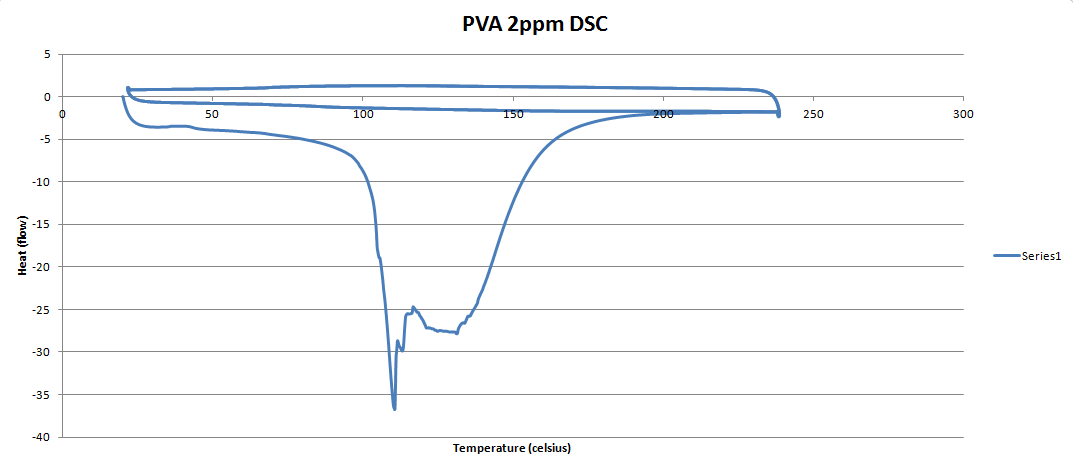
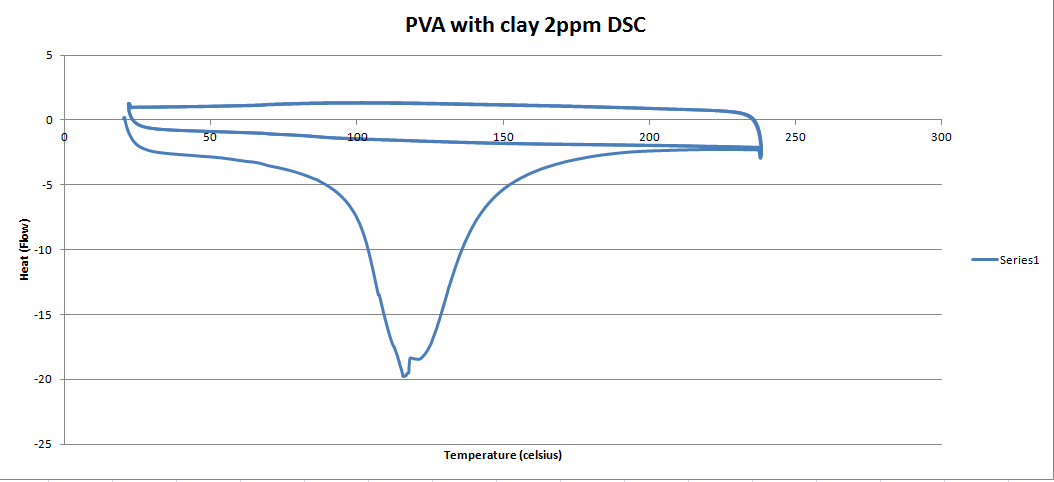
04:10, 1 October 2014
PVA 2ppm DSC graph.PNG
(
file
)
17 KB
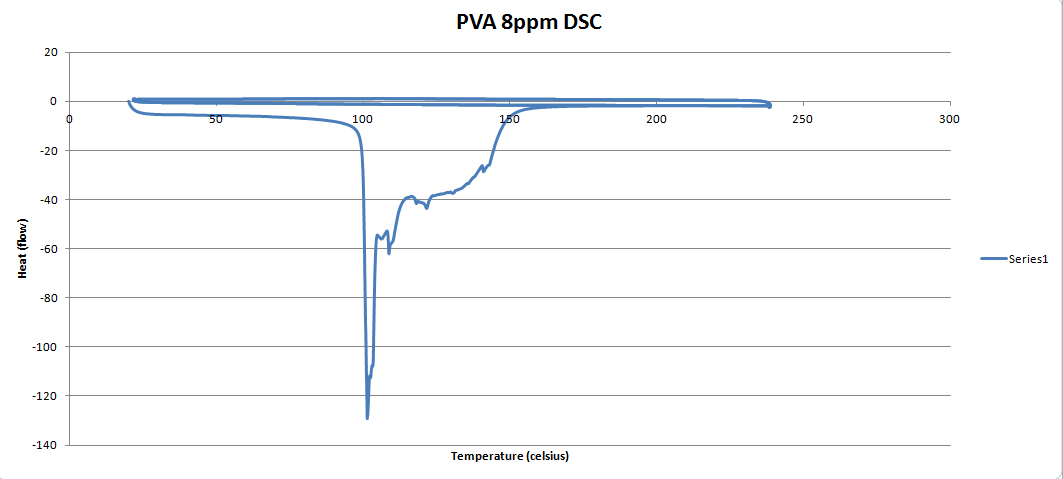
04:09, 1 October 2014
PVA 8ppm DSC graph.PNG
(
file
)
15 KB
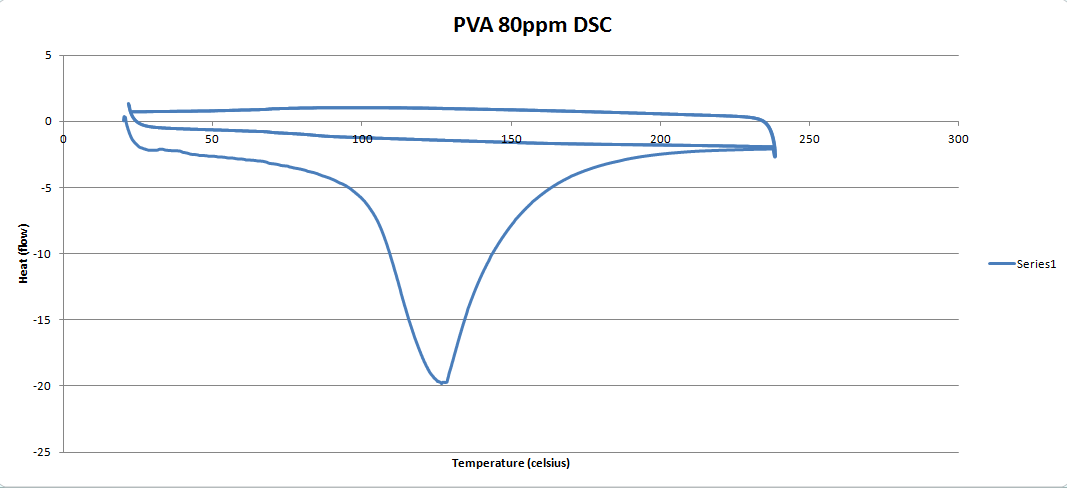
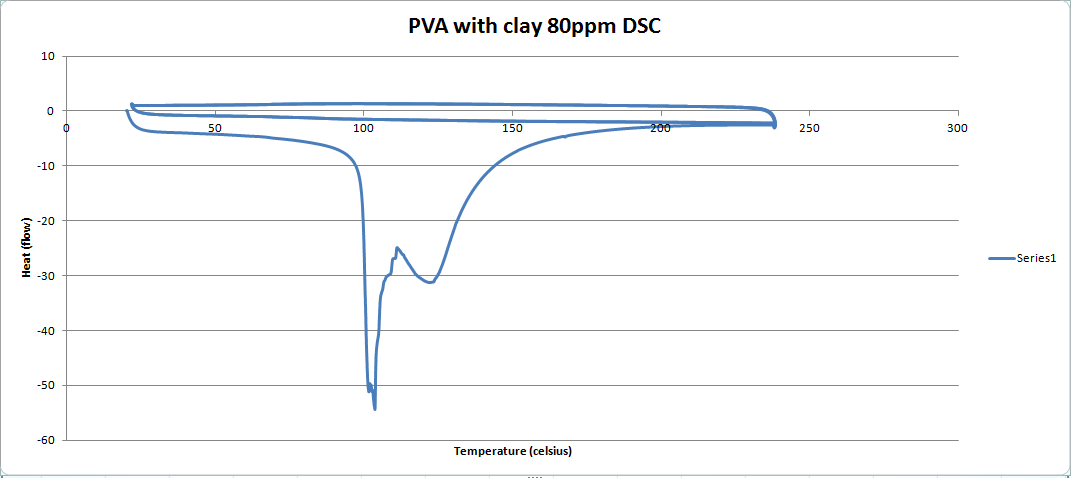
04:08, 1 October 2014
PVA 80ppm DSC graph.PNG
(
file
)
17 KB
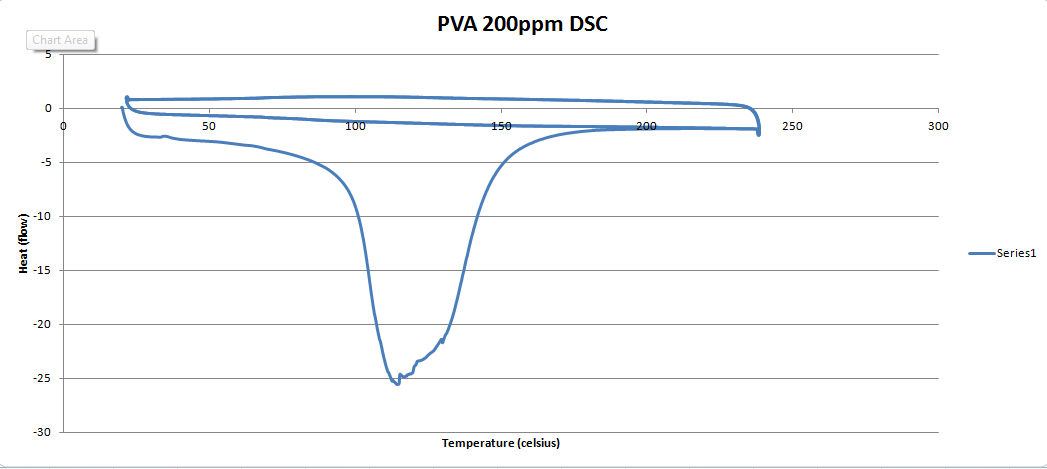
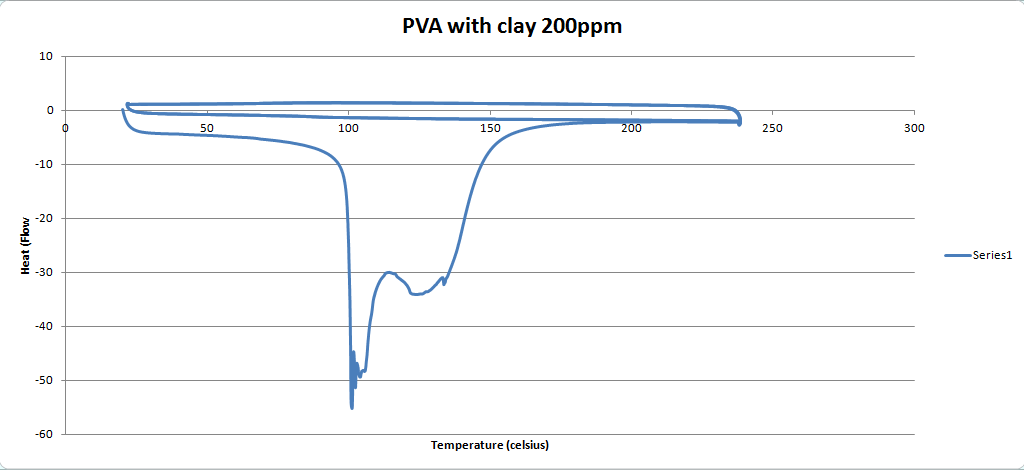
04:07, 1 October 2014
PVA 200ppm DSC graph.PNG
(
file
)
17 KB
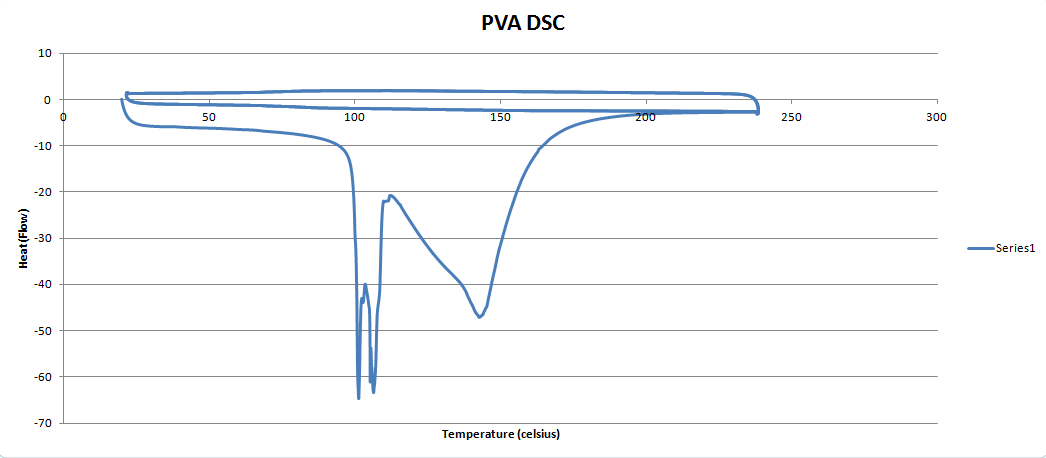
04:06, 1 October 2014
PVA DSC graph.PNG
(
file
)
16 KB
04:04, 1 October 2014
PVAC 2ppm DSC Graph.PNG
(
file
)
18 KB
04:03, 1 October 2014
PVAC 8ppm DSC graph.PNG
(
file
)
18 KB
04:03, 1 October 2014
PVAC 80ppm DSC graph.PNG
(
file
)
18 KB
04:02, 1 October 2014
PVAC 200ppm DSC graph.PNG
(
file
)
16 KB
04:00, 1 October 2014
PVAC DSC graph.PNG
(
file
)
18 KB
14:18, 17 September 2014
PVAC film FTIR graphs.PNG
(
file
)
49 KB
14:16, 17 September 2014
PVA film FTIR graph.PNG
(
file
)
41 KB
14:12, 17 September 2014
PVA film FTIR graphs.PNG
(
file
)
41 KB
Navigation menu
Page actions
Special page
Refresh
Page actions
Special page
Tools
Personal tools
Log in
Request account
Navigation
Main Page
Recent changes
Help
Contact OWW
Add a Lab Notebook
Special pages
Search
research
Materials
Protocols
Resources
Tools
User contributions
Logs
View user groups
Printable version


