Uploads by Melissa Novy
From OpenWetWare
Jump to navigationJump to search
This special page shows all uploaded files.
| Date | Name | Thumbnail | Size | Description |
|---|---|---|---|---|
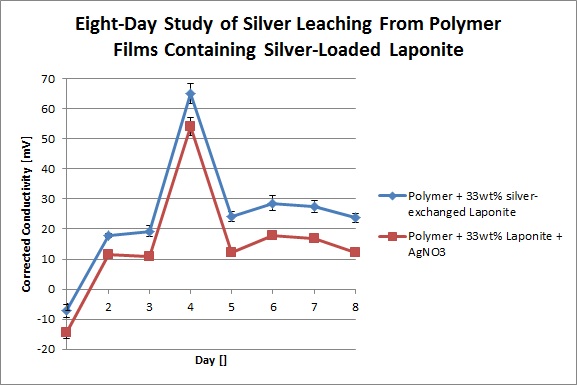
| 00:24, 25 April 2013 | 8 Day ISE Study.jpg (file) |  |
52 KB | |
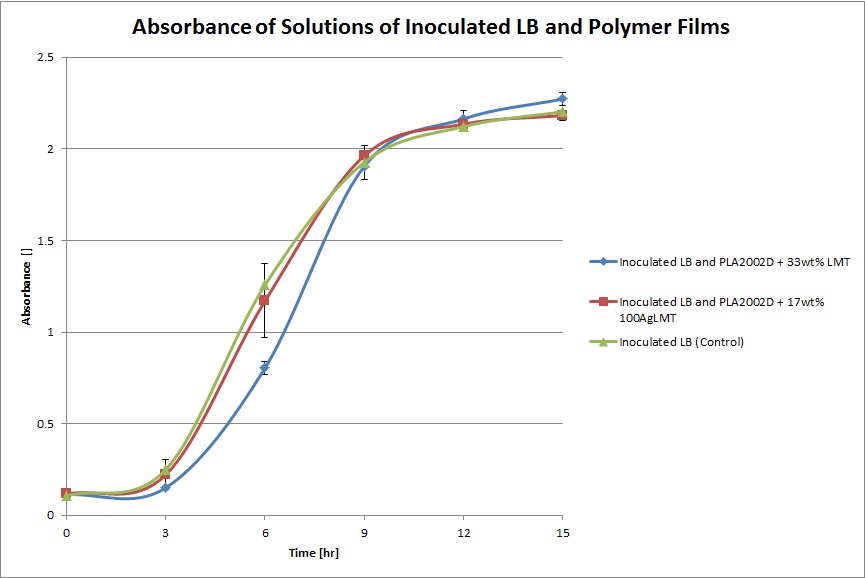
| 22:02, 10 April 2013 | 04-07-2013.jpg (file) |  |
66 KB | |
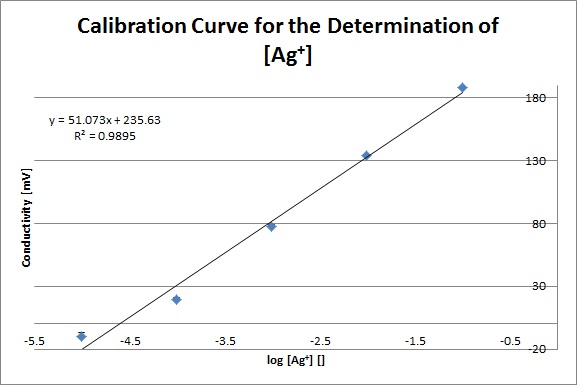
| 04:02, 27 March 2013 | Ag+ Calibration Curve 3-26-2013.jpg (file) |  |
39 KB | Calibration curve of AgNO3 made in polypropylene containers. |
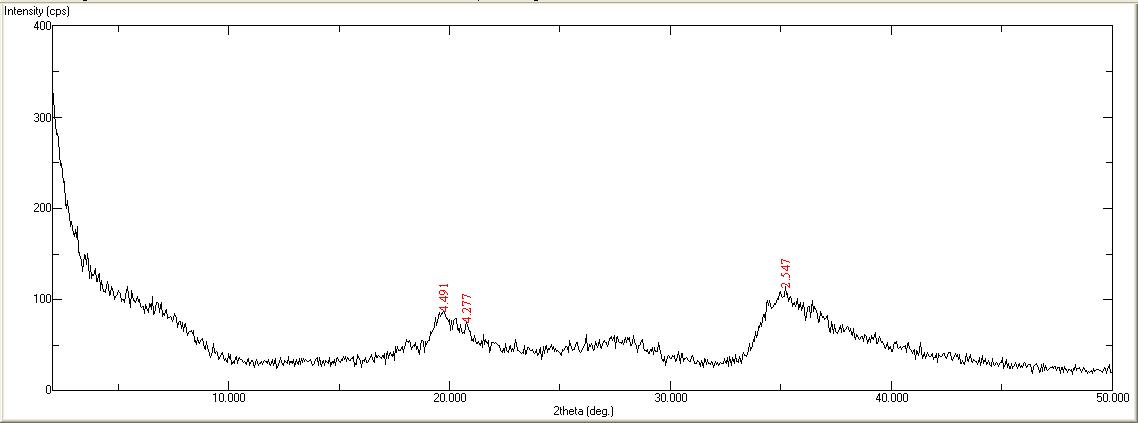
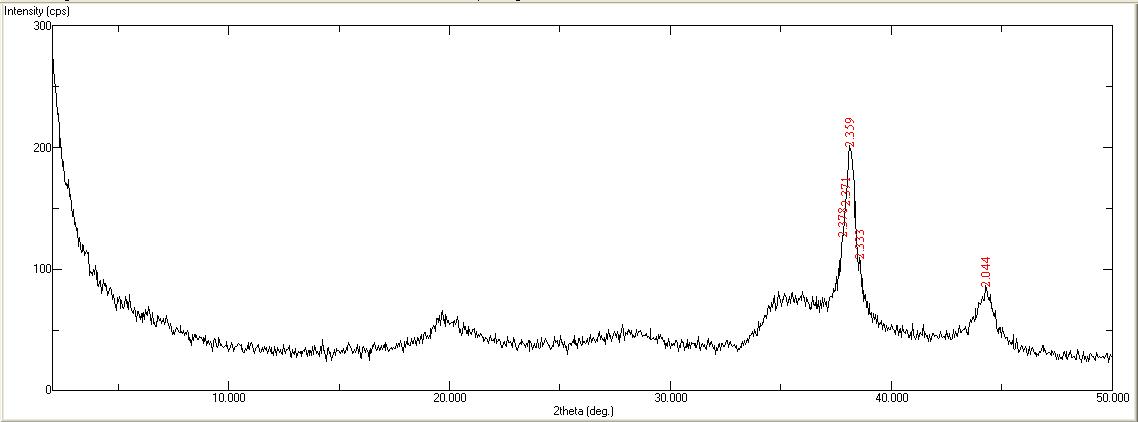
| 21:54, 18 March 2013 | 100AgLMT.JPG (file) |  |
35 KB | X-ray diffraction pattern of 100Ag-LMT, made on 2013/02/05. |
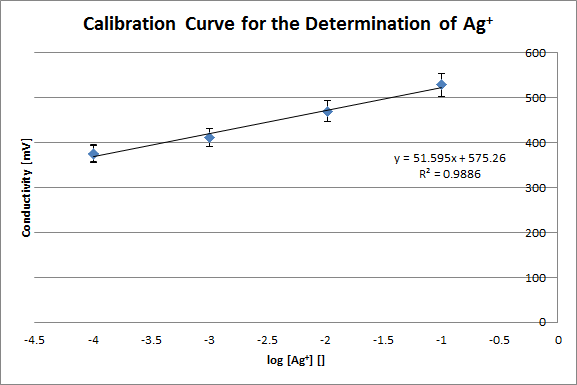
| 21:31, 13 February 2013 | AgCC.png (file) |  |
11 KB | Calibration curve for the determination of Ag ions in solution using solutions of AgNO3. |
| 19:11, 12 February 2013 | AgLMT 24h 2-6-13.JPG (file) |  |
37 KB | 95AgLMT XRD from 2° to 50° at 0.5°/min. |
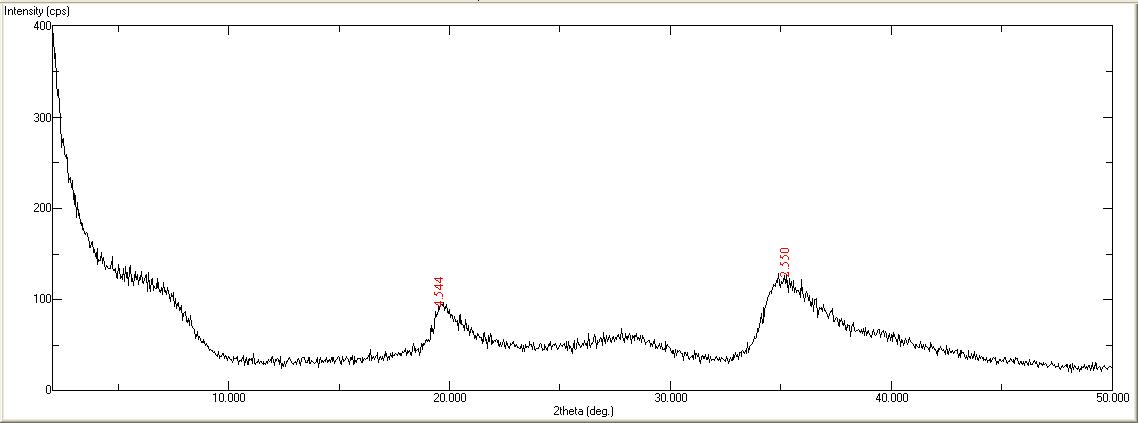
| 19:10, 12 February 2013 | LMT 2-6-13.JPG (file) |  |
35 KB | Laponite XRD from 2° to 50° at 0.5°/min. |
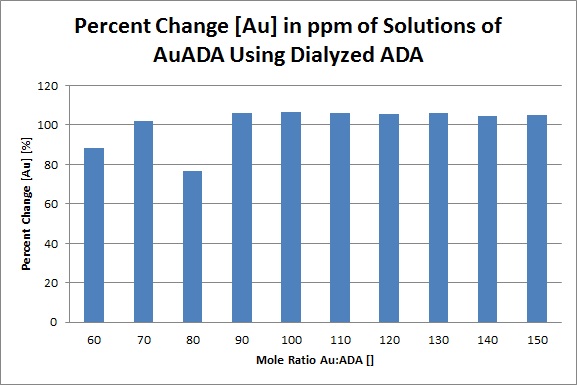
| 04:29, 8 December 2012 | AuADA AAS Percent.jpg (file) |  |
53 KB | |
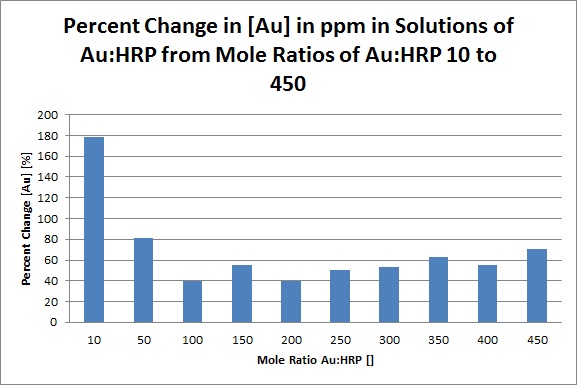
| 04:07, 8 December 2012 | AAS AuHRP Percent.jpg (file) |  |
56 KB | |
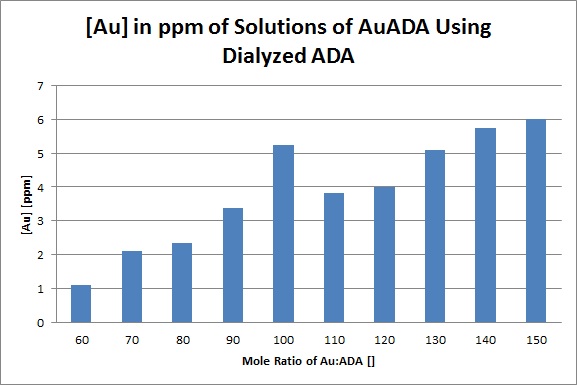
| 03:15, 8 December 2012 | AAS AuADA.jpg (file) |  |
46 KB | |
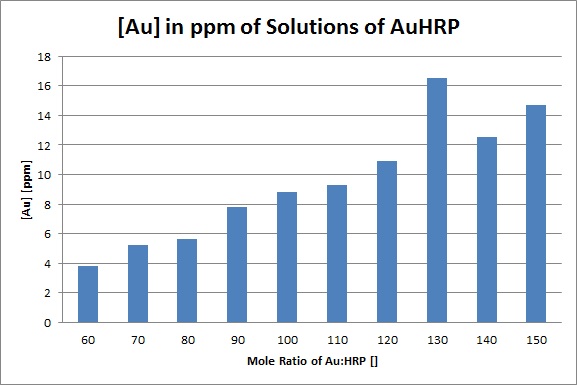
| 03:12, 8 December 2012 | AAS AuHRP.jpg (file) |  |
47 KB | |
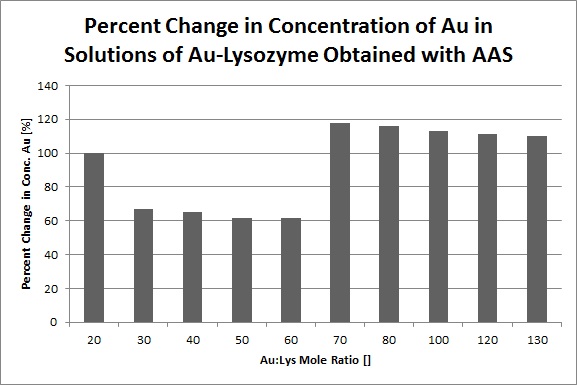
| 03:02, 8 December 2012 | AAS Percent Change Au.jpg (file) |  |
52 KB | Percent change of Au in ppm in solutions of AuLys at mole ratios from 20 to 130. |
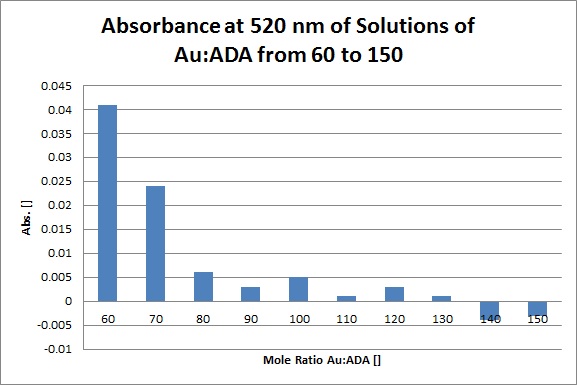
| 01:39, 7 December 2012 | AuADA Abs at 520nm.jpg (file) |  |
50 KB | Absorbance at 520 nm of solutions of AuADA at mole ratios from 60 to 150. |
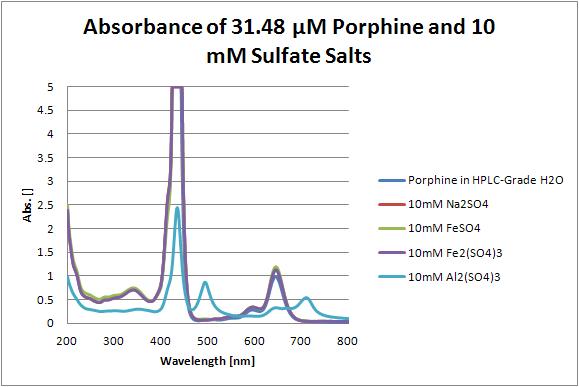
| 18:37, 30 November 2012 | 31.48 uM Porphine.JPG (file) |  |
31 KB | Absorbance spectra of 31.48 uM porphine and 10 mM sulfate salts. |
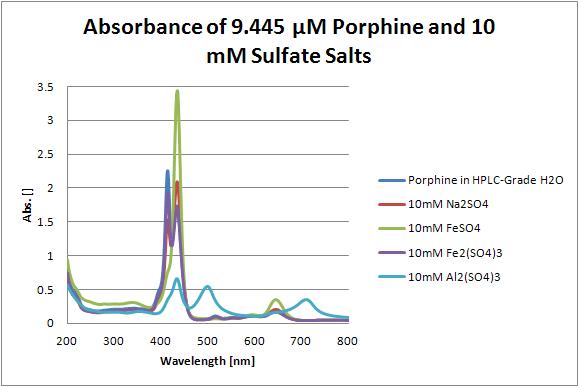
| 18:37, 30 November 2012 | 9.445 uM Porphine.JPG (file) |  |
29 KB | Absorbance spectra of 9.445 uM porphine and 10 mM sulfate salts. |
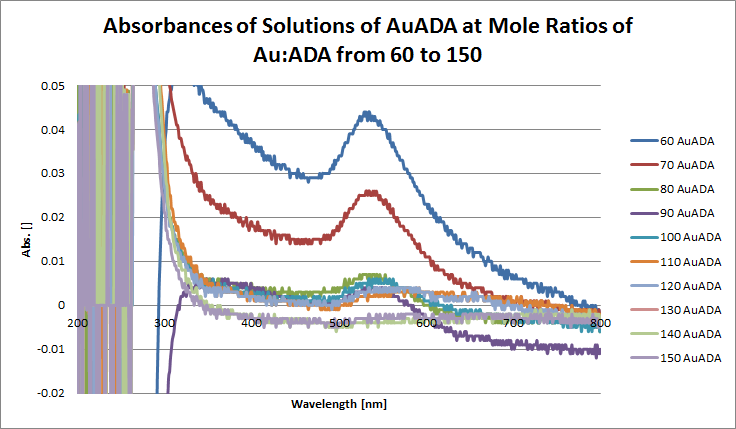
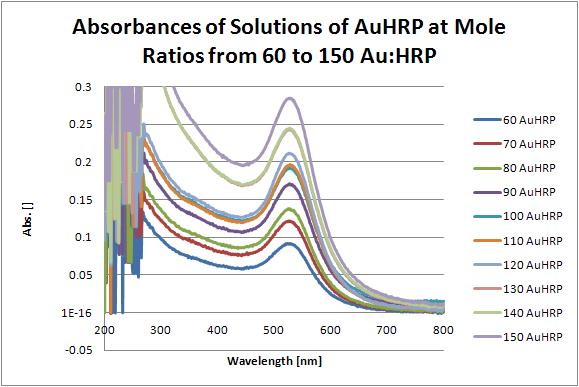
| 00:43, 30 November 2012 | AuADA 11272012.png (file) |  |
50 KB | Absorbance of solutions of AuADA at mole ratios of Au:ADA from 60 to 150. The solutions were made on 2012/11/27. |
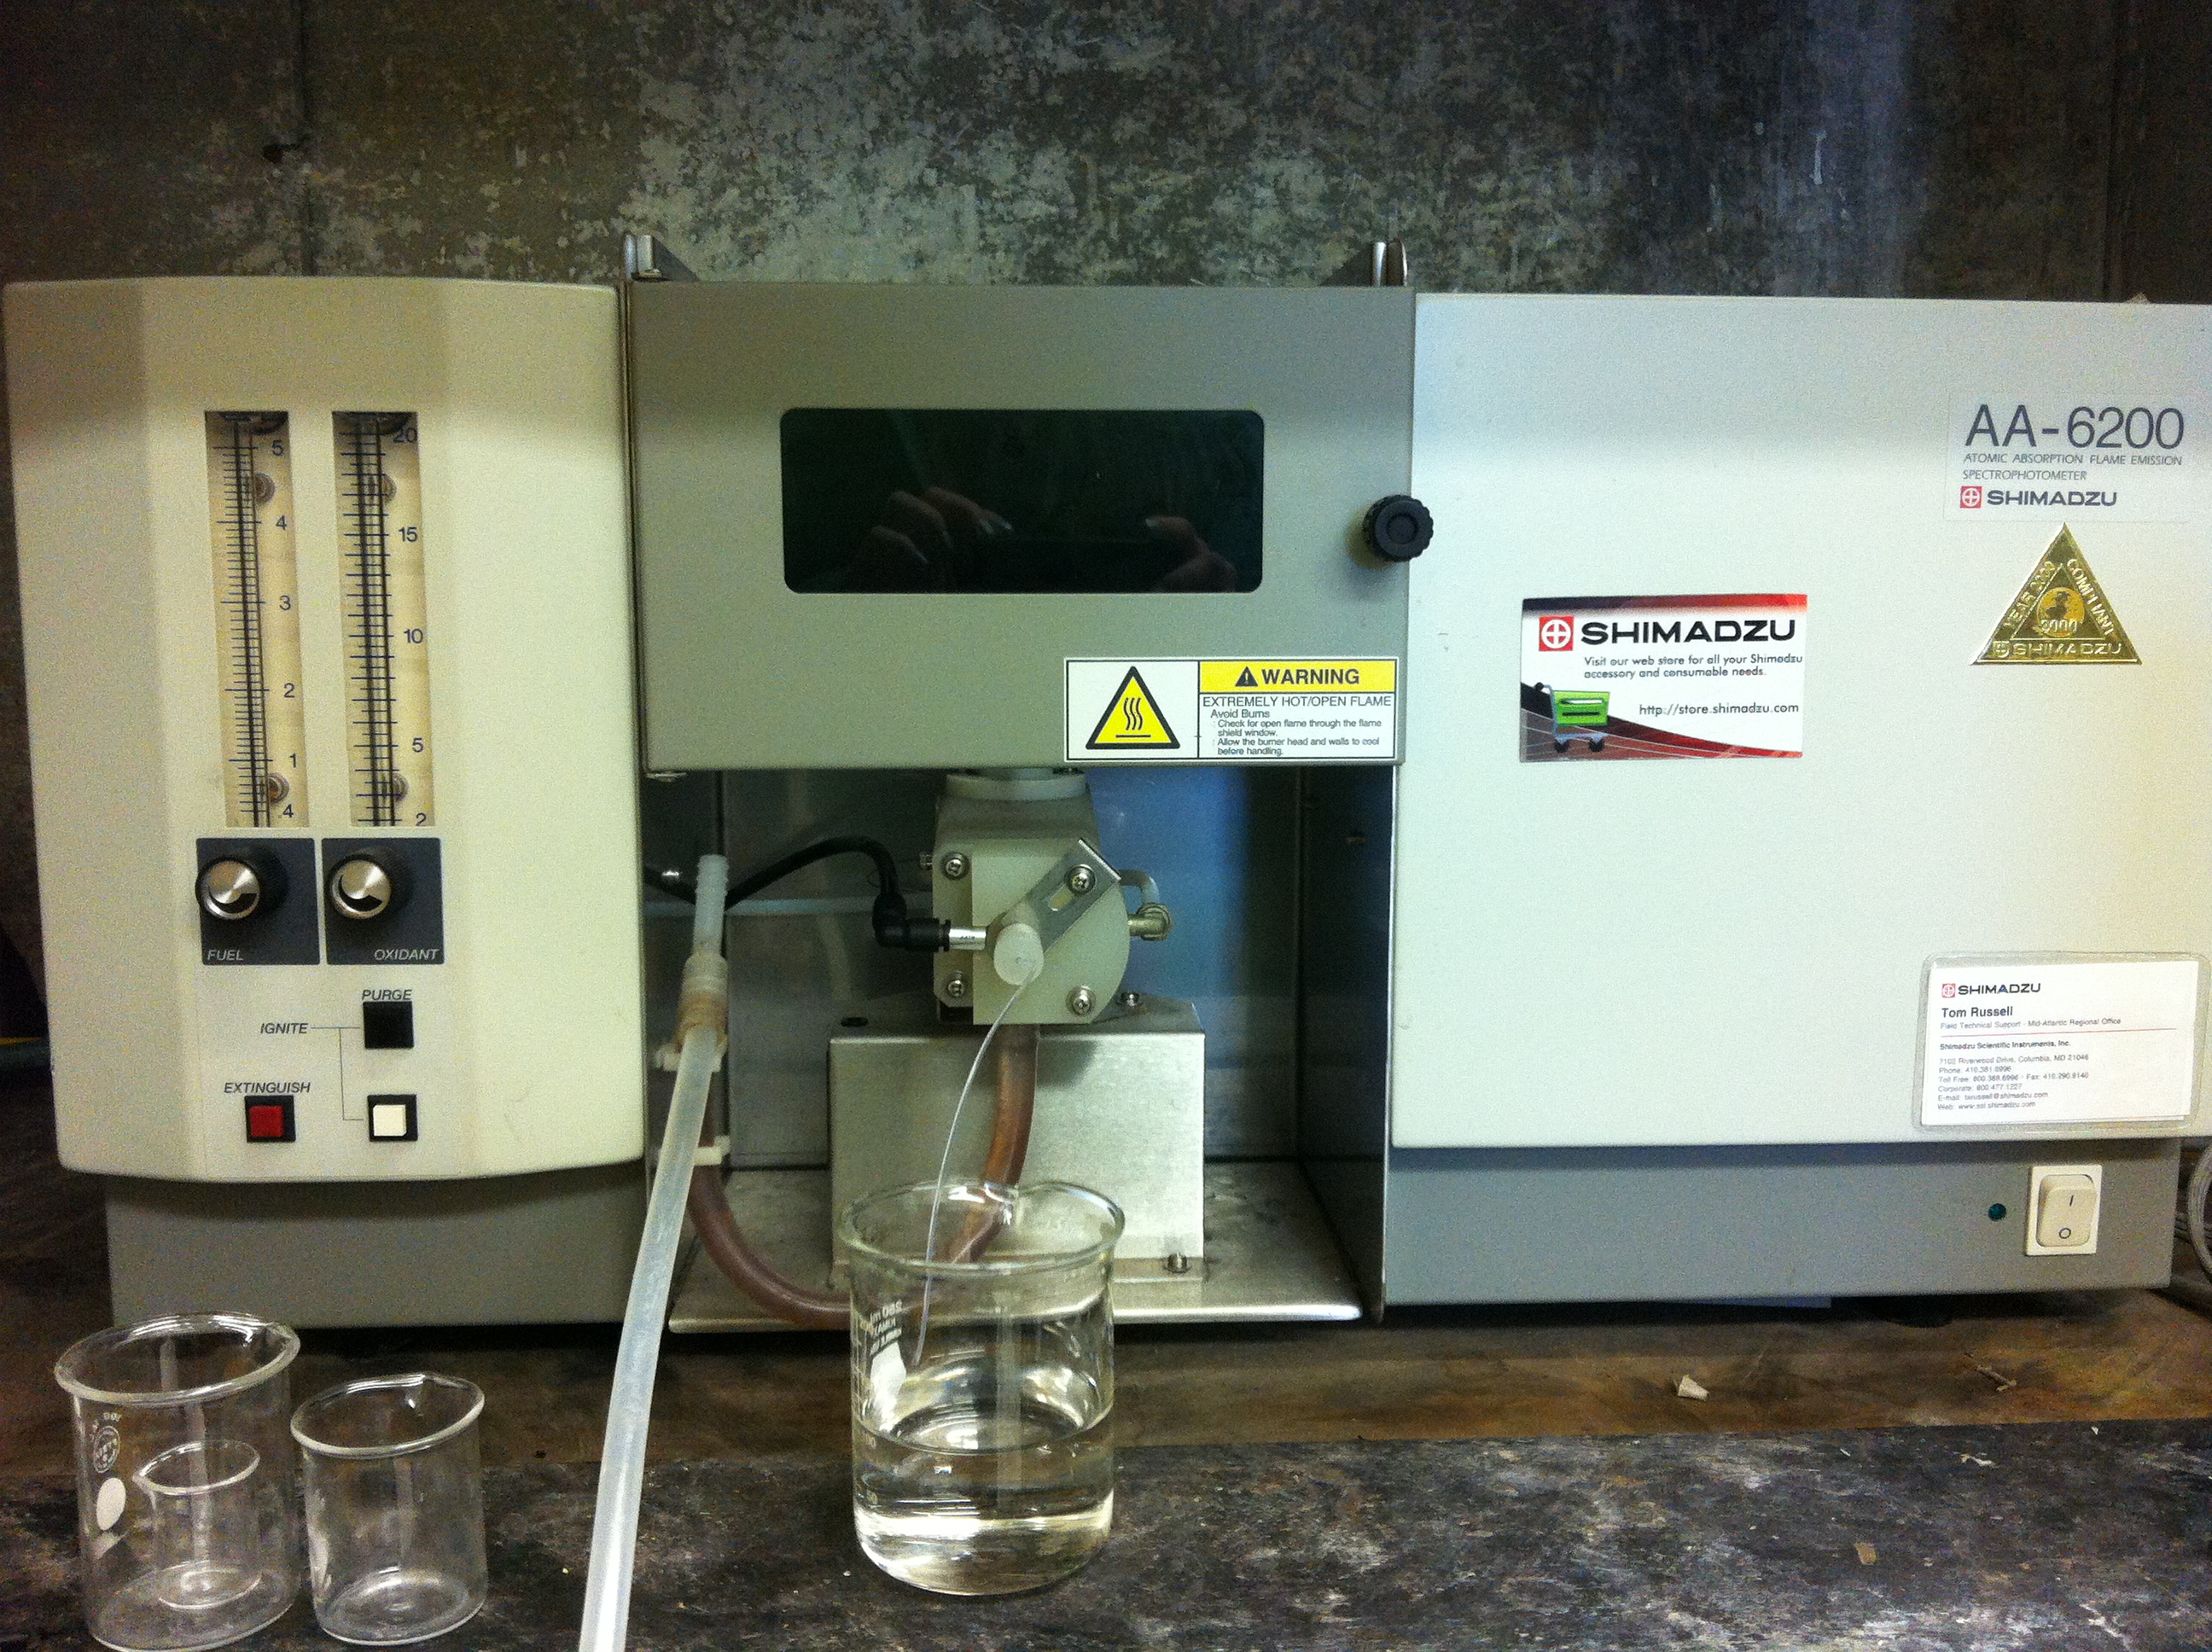
| 20:23, 28 November 2012 | AA-6200.JPG (file) |  |
2.13 MB | Shimadzu AA-6200 atomic absorption spectrometer. |
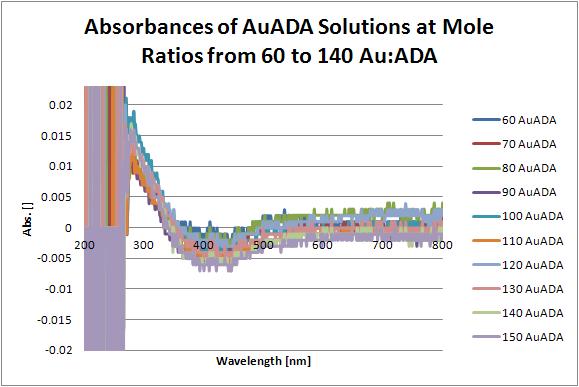
| 20:07, 27 November 2012 | UV-Vis Spectra of AuADA.JPG (file) |  |
37 KB | UV-vis spectra of solutions of AuADA from ratios of 60 to 150 Au:ADA. |
| 19:12, 27 November 2012 | UV-Vis Spectra of AuADA 11142012.JPG (file) |  |
41 KB | UV-vis spectra of solutions of AuADA at mole ratios of Au:ADA from 60 to 150. |
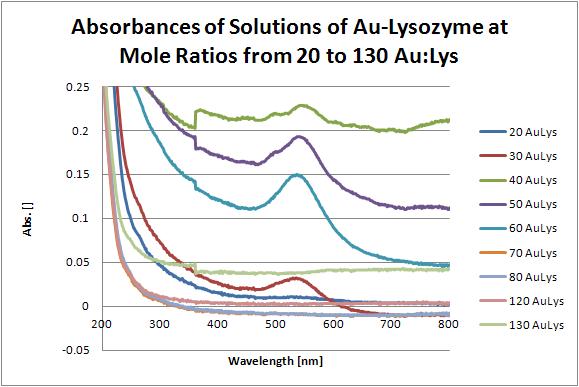
| 19:00, 27 November 2012 | UV-Vis Spectra of AuLys.JPG (file) |  |
38 KB | UV-vis spectra of solutions of Au-lysozyme at mole ratios of Au:lys from 20 to 130. |
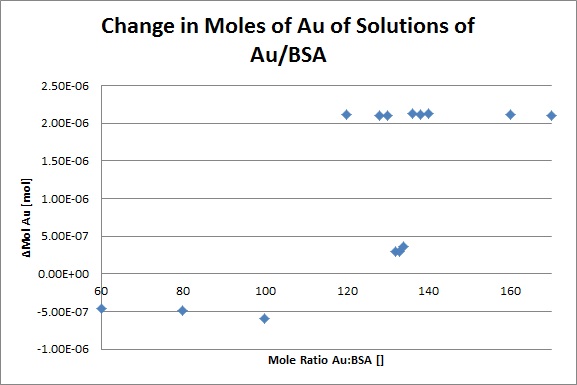
| 21:07, 26 November 2012 | Change in Mol Au.jpg (file) |  |
40 KB | Change in moles of Au in solutions of Au/BSA from initial concentration to final concentration after reaction with BSA. Data was obtained with atomic absorption spectroscopy. |
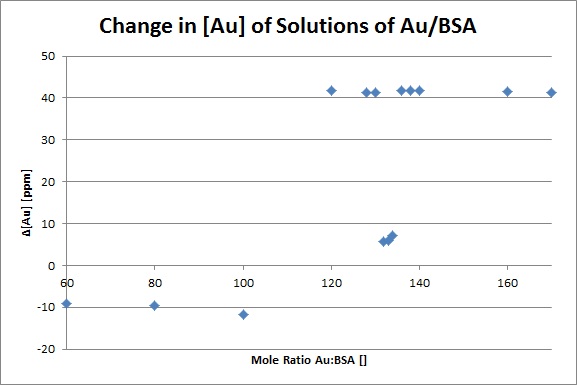
| 21:06, 26 November 2012 | Change in Au ppm.jpg (file) |  |
35 KB | Change in Au ppm from initial concentration to final concentration after reaction with BSA obtained with atomic absorption. |
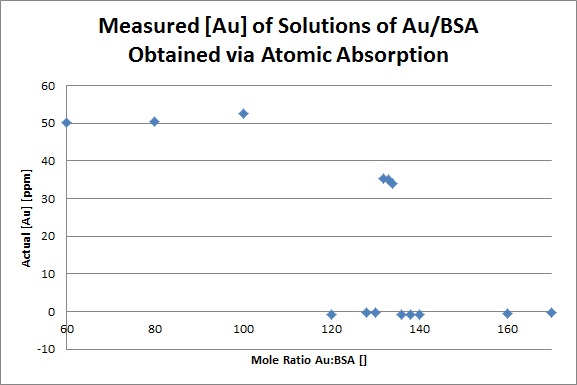
| 21:05, 26 November 2012 | Measured Au ppm.jpg (file) |  |
41 KB | Actual ppm of Au in solutions of Au/BSA obtained with atomic absorption spectroscopy. |
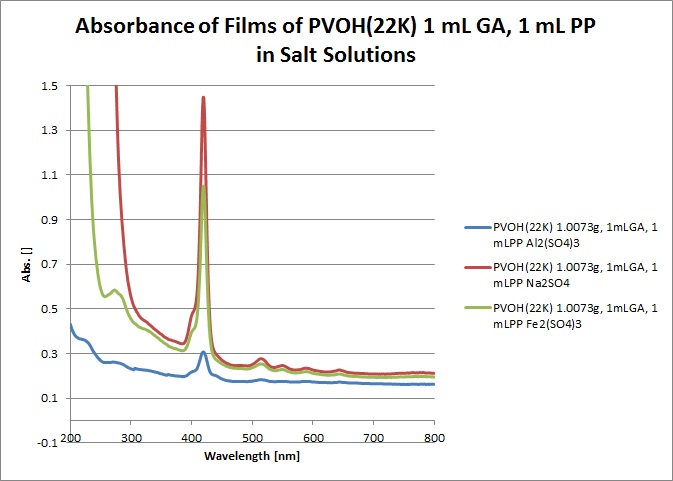
| 02:13, 26 November 2012 | PVOH(22K) 1mLGA, 1mLPP.jpg (file) | _1mLGA,_1mLPP.jpg) |
64 KB | Absorbance of films of PVOH(22K) 1 mL GA, 1 mL PP after soaking in various salt solutions. |
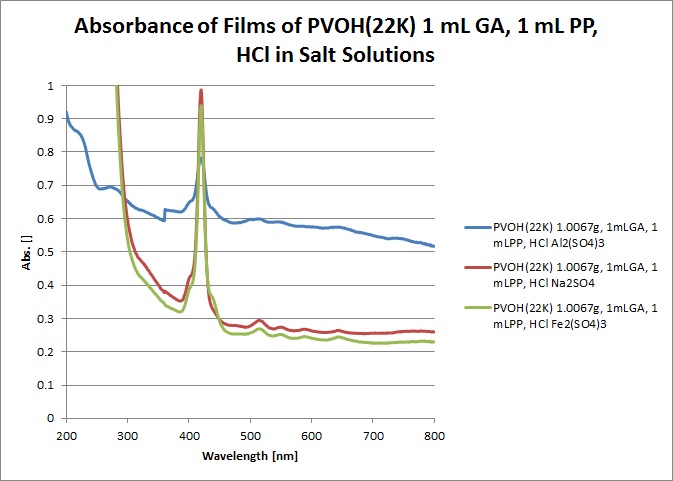
| 02:12, 26 November 2012 | PVOH(22K) 1mLGA, 1mLPP, HCl.jpg (file) | _1mLGA,_1mLPP,_HCl.jpg) |
67 KB | Absorbance of films of PVOH(22K) 1 mL GA, 1 mL PP, HCl after soaking in various salt solutions. |
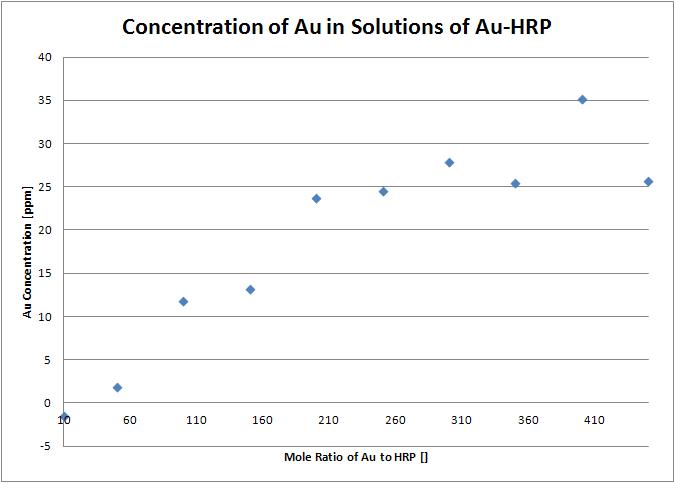
| 19:19, 13 November 2012 | AAS AuHRP.JPG (file) |  |
30 KB | Graph of mole ratio of Au to HRP versus Au concentration (ppm) in the solutions obtained with atomic absorption spectroscopy. |
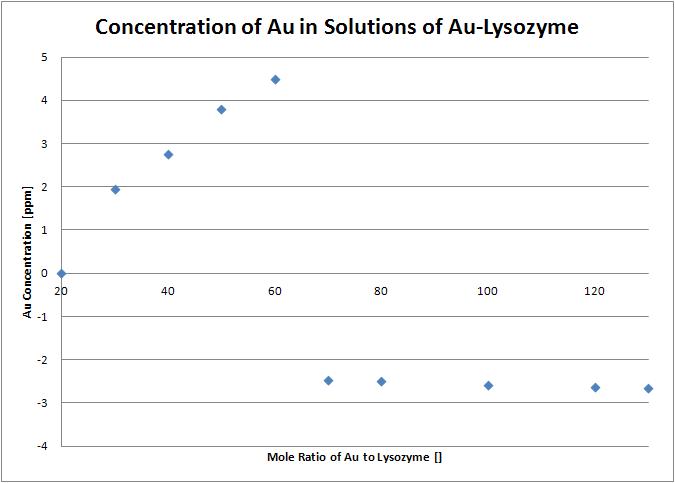
| 19:18, 13 November 2012 | AAS AuLys.JPG (file) |  |
31 KB | Graph of mole ratio of Au to lysozyme versus Au concentration (ppm) in the solutions obtained with atomic absorption spectroscopy. |
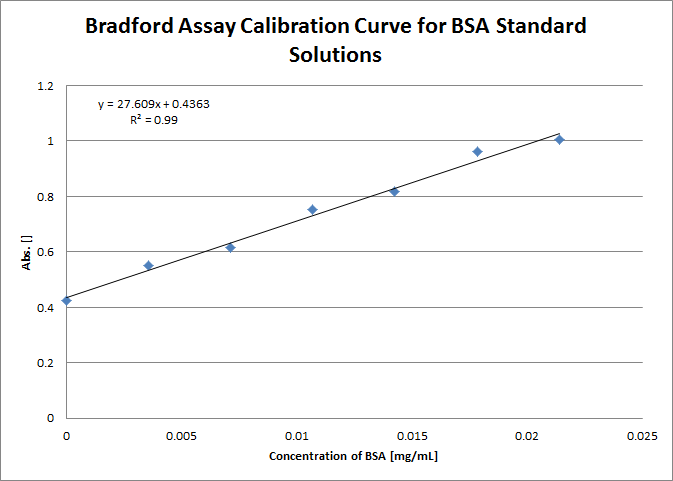
| 18:04, 8 November 2012 | Bradford assay.png (file) |  |
13 KB | Calibration curve for Bradford assay of BSA standard solutions. |
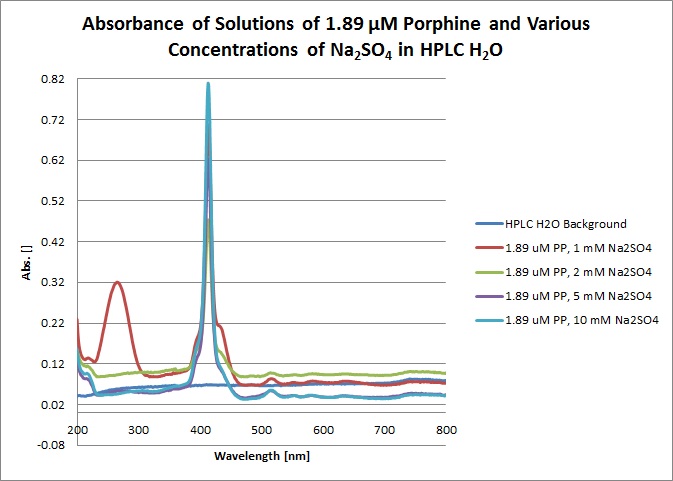
| 16:12, 7 November 2012 | Na2SO4.jpg (file) |  |
70 KB | |
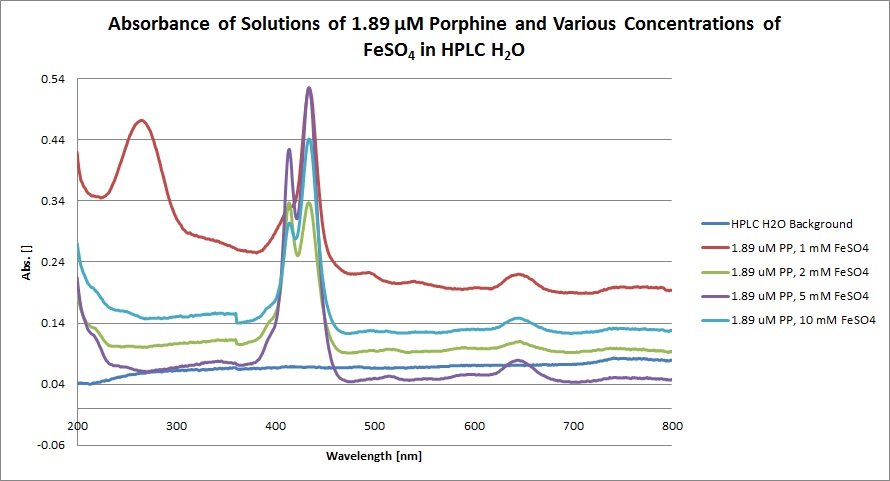
| 16:11, 7 November 2012 | FeSO4.jpg (file) |  |
89 KB | |
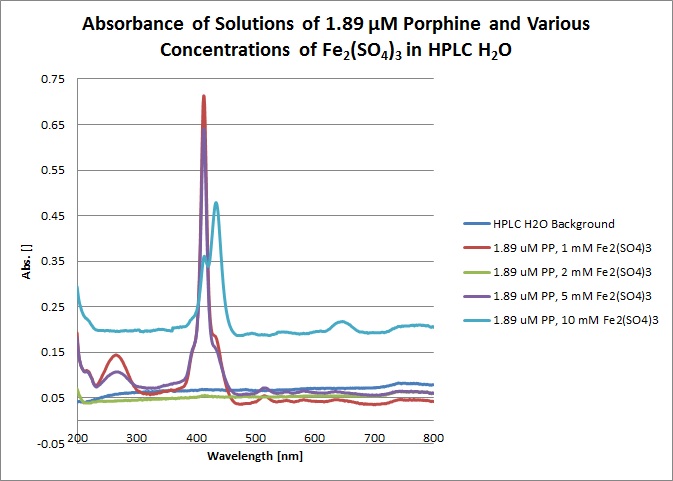
| 16:11, 7 November 2012 | Fe2(SO4)3.jpg (file) | 3.jpg) |
71 KB | |
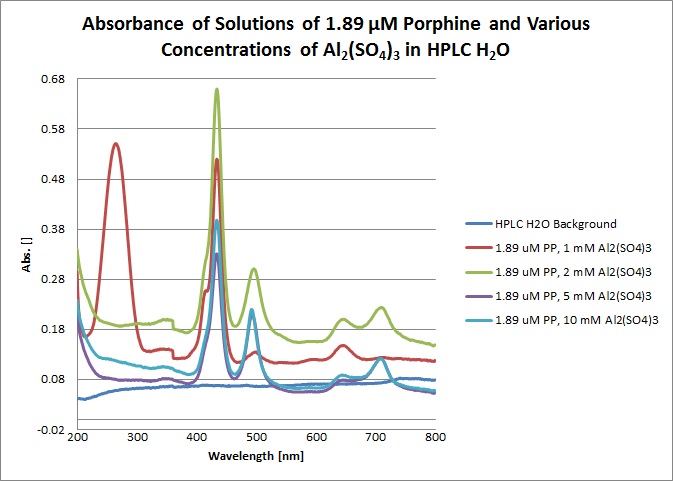
| 16:11, 7 November 2012 | Al2(SO4)3.jpg (file) | 3.jpg) |
76 KB | |
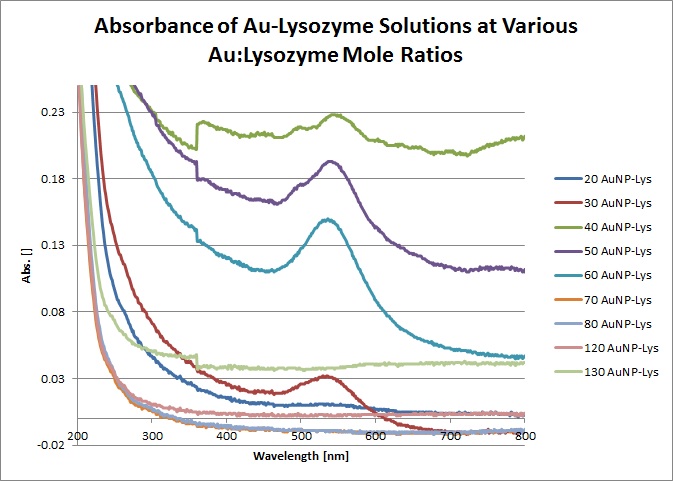
| 04:54, 7 November 2012 | AuNP-Lysozyme Absorbance.jpg (file) |  |
85 KB | Absorbance of solutions at Au:lysozyme mole ratios of 20, 30, 40, 50, 60, 70, 80, 100, 120, and 130. |
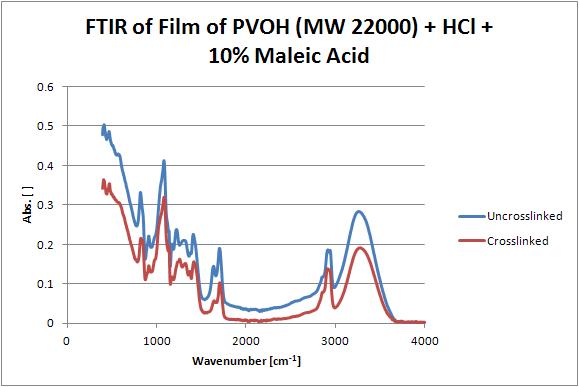
| 18:57, 2 November 2012 | FTIR.JPG (file) |  |
29 KB | FTIR of crosslinked and uncrosslinked films of PVOH (MW 22000) with HCl and 10% maleic acid. |
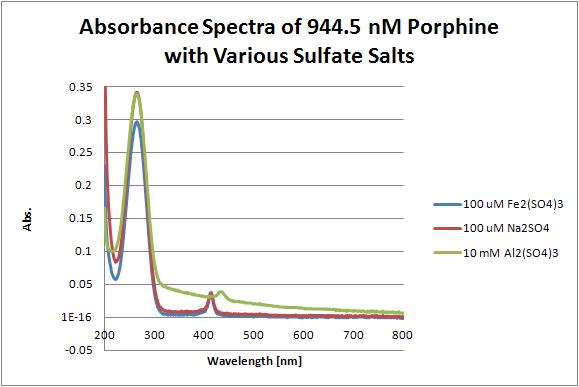
| 17:58, 26 October 2012 | 944.5 nM porphine and sulfate salts spectra.JPG (file) |  |
30 KB | |
| 05:41, 26 October 2012 | Varying H2O2.jpg (file) |  |
48 KB | |
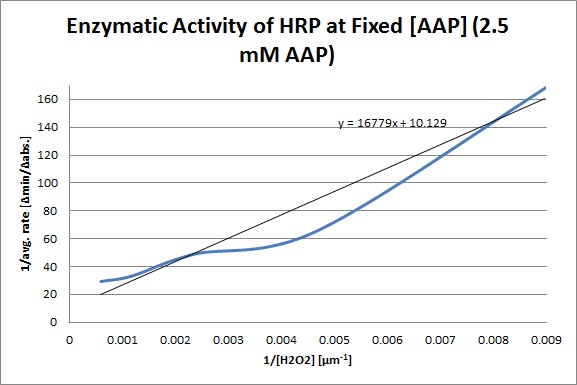
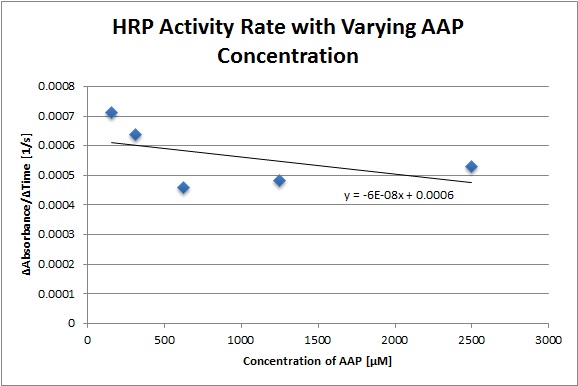
| 05:41, 26 October 2012 | Varying AAP.jpg (file) |  |
47 KB | |
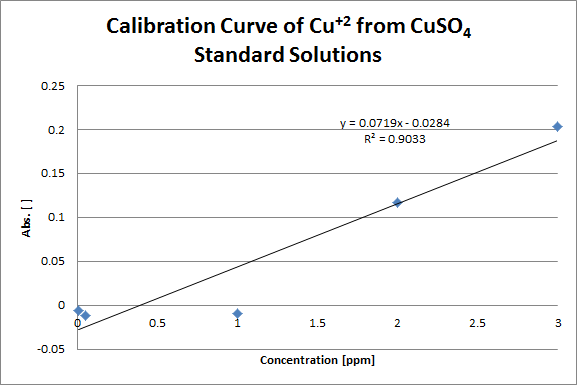
| 00:30, 20 October 2012 | Cu+2 AAS Calibration Curve.png (file) |  |
12 KB | Atomic absorption calibration curve of Cu<sup>+2</sup> standard solutions from CuSO<sub>4</sub> at the following concentrations: 0.01, 0.05, 1, 2, and 3 ppm. |
| 16:58, 18 October 2012 | AAS Au Standards.jpg (file) |  |
44 KB | Calibration curve obtained from standard solutions of Au in 1 M HCl at the following concentrations: 5, 8, 10, 15, 20, 25, 30, and 40 ppm. The AAS was blanked with 1 M HCl. |
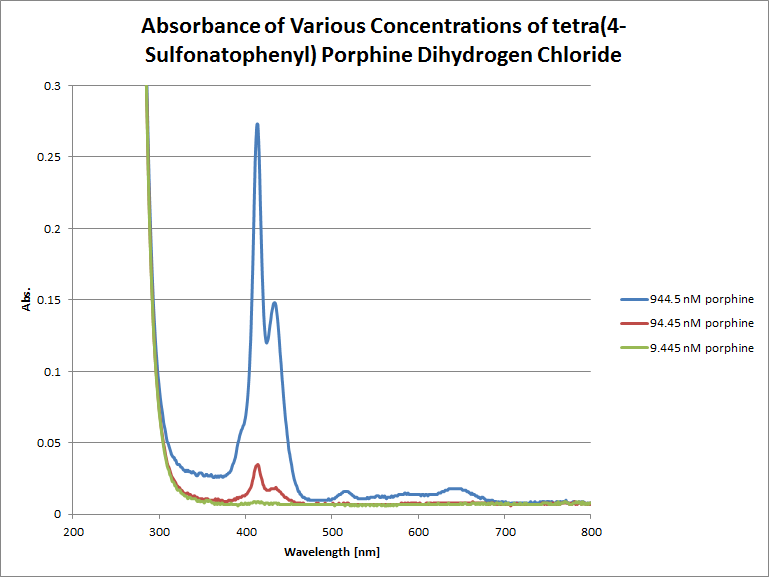
| 15:44, 18 October 2012 | Porphine Absorbance.png (file) |  |
30 KB | Graph of absorbance versus wavelength (nm) of tetra(4-sulfonatophenyl) porphine dihydrogen chloride at concentrations of 9.445 nM, 94.45 nM, and 944.5 nM in water. Data was obtained with a Shimadzu UV-2550 spectrophotometer with medium scan speed and a s |
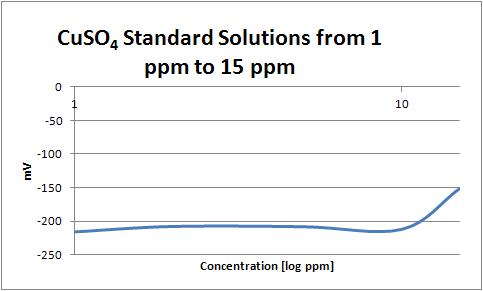
| 16:24, 5 October 2012 | CuSO4 ISE Standards.JPG (file) |  |
19 KB | Graph of mV versus log concentration (ppm) of CuSO<sub>4</sub> standards in H<sub>2</sub>O for sodium electrode. |
| 19:22, 27 September 2012 | HRP Assays.pdf (file) | 661 KB | ||
| 19:36, 26 September 2012 | HRP Chemiluminescence Assay.JPG (file) |  |
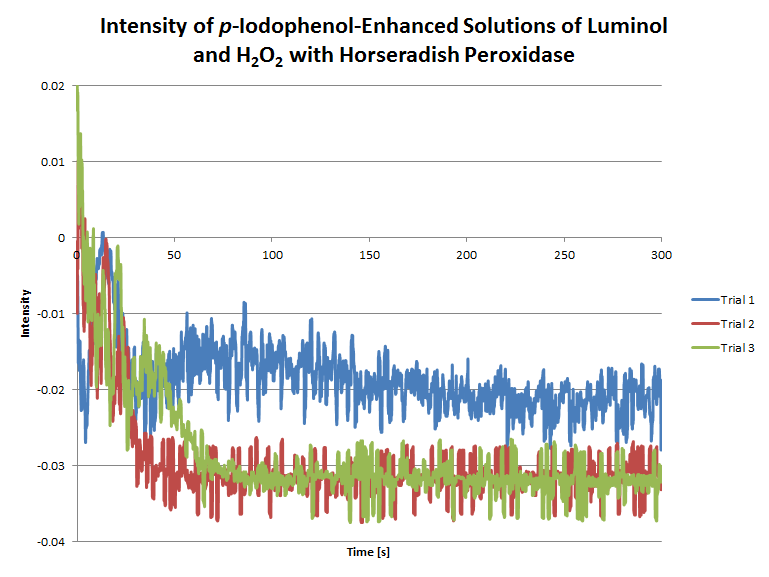
58 KB | Graph of intensity versus time of 4-iodophenol-enhanced solutions of hydrogen peroxide, luminol, and HRP. |
| 18:43, 26 September 2012 | Tris Buffer Absorbance.JPG (file) |  |
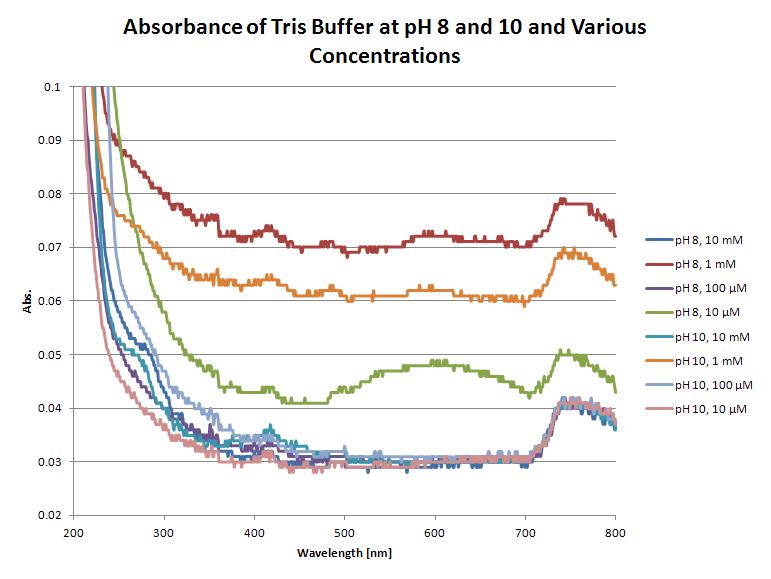
54 KB | Graph of absorbance versus wavelength of Tris buffer in H<sub>2</sub>OH2O at pH 8 and 10 and at concentrations ranging from 10 μM to 10 mM. |
| 02:39, 26 September 2012 | HRP Assay 2012-09-25.png (file) |  |
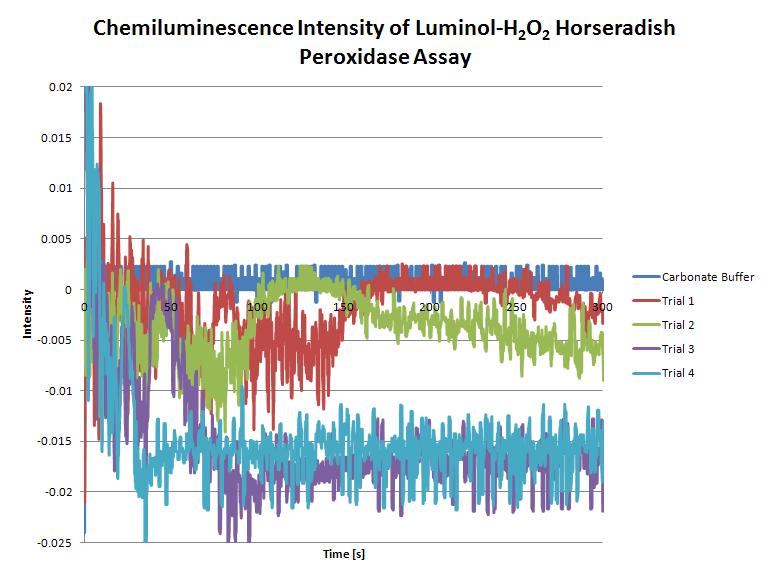
52 KB | Graph of intensity versus time of <i>p</i>-iodophenol-enhanced solutions of luminol, H<sub>2</sub>O<sub>2</sub>, and horseradish peroxidase. |
| 19:52, 21 September 2012 | PVOH (22K).pdf (file) | 86 KB | Graph of heat flow versus temperature obtained via DSC for uncrosslinked PVOH (MW 22000). | |
| 19:50, 21 September 2012 | CL PVOH (22K).pdf (file) | 81 KB | Graph of heat flow versus temperature obtained via DSC of crosslinked PVOH (MW 22000). | |
| 19:49, 21 September 2012 | CL PVOH (22K).001.pdf (file) | 81 KB | Graph of heat flow versus temperature obtained via DSC of crosslinked PVOH (MW 22000). | |
| 19:34, 21 September 2012 | CL PVOH 22K 10%M HCl.pdf (file) | 79 KB | Graph of heat flow versus temperature obtained via DSC for crosslinked PVOH (MW 22000) + 10% maleic acid + HCl. | |
| 19:31, 21 September 2012 | PVOH(22K), 10%M, HCl.pdf (file) | 79 KB | Graph of heat flow versus temperature of uncrosslinked PVOH (MW 22000) + 10% maleic acid + HCl. |
