Uploads by Lucia I. Ramirez
From OpenWetWare
Jump to navigationJump to search
This special page shows all uploaded files.
| Date | Name | Thumbnail | Size | Description |
|---|---|---|---|---|
| 14:01, 7 May 2015 | BIOL398-04 S15 Lsquared Final.pptx (file) | 1.25 MB | update #2 | |
| 01:00, 6 May 2015 | Matlab results and weighted networks Lsquared.pptx (file) | 1.24 MB | reupload correct updated network weight graph | |
| 00:57, 6 May 2015 | Both sets of weights Lsquared.xlsx (file) | 14 KB | updated labeling and gene order listed | |
| 00:46, 6 May 2015 | Both sets of production rates Lsquared.xlsx (file) | 12 KB | upload of correct file after correction | |
| 16:44, 28 April 2015 | Value b Lsquared.xlsx (file) | 13 KB | value b compared after changing fix_b | |
| 16:31, 28 April 2015 | Estimated and fixed b results.pptx (file) | 1.16 MB | added weighted networks in powerpoint | |
| 05:46, 28 April 2015 | Input dhmo1 forward correct params Lsquared estimation output bEST.xlsx (file) | 44 KB | modified "network" worksheet for estimated b | |
| 05:45, 28 April 2015 | Input dhmo1 forward correct params Lsquared estimation output bFIX.xlsx (file) | 44 KB | modified "network" worksheet with appropriate weights | |
| 05:23, 28 April 2015 | Input dhmo1 forward correct params Lsquared estimation output bESTIMATE.xlsx (file) | 43 KB | dhmo1_Lsquared: output 2 estimated b | |
| 05:21, 28 April 2015 | Input dhmo1 forward correct params Lsquared estimation output bFIXED.xlsx (file) | 43 KB | dhmo1_Lsquared: output 1 fixed b | |
| 05:18, 28 April 2015 | Input dhmo1 forward correct params Lsquared bESTIMATE.xlsx (file) | 29 KB | dhmo1_Lsquared: input 2, estimated b | |
| 05:15, 28 April 2015 | Input dhmo1 forward correct params Lsquared bFIXED.xlsx (file) | 29 KB | dhmo1_Lsquared: input1_b is fixed | |
| 04:53, 28 April 2015 | Weighted networks slide Lsquared.pptx (file) | 300 KB | weights networks | |
| 01:17, 28 April 2015 | Input 4 gene forward correct params.xlsx (file) | 24 KB | Input Excel Workbook for the Model | |
| 21:07, 24 April 2015 | Before and after figures.pptx (file) | 845 KB | figures that show the comparison between first and second run | |
| 16:56, 23 April 2015 | Input 4 gene forward correct params Lsquared.xlsx (file) | 29 KB | input workbook | |
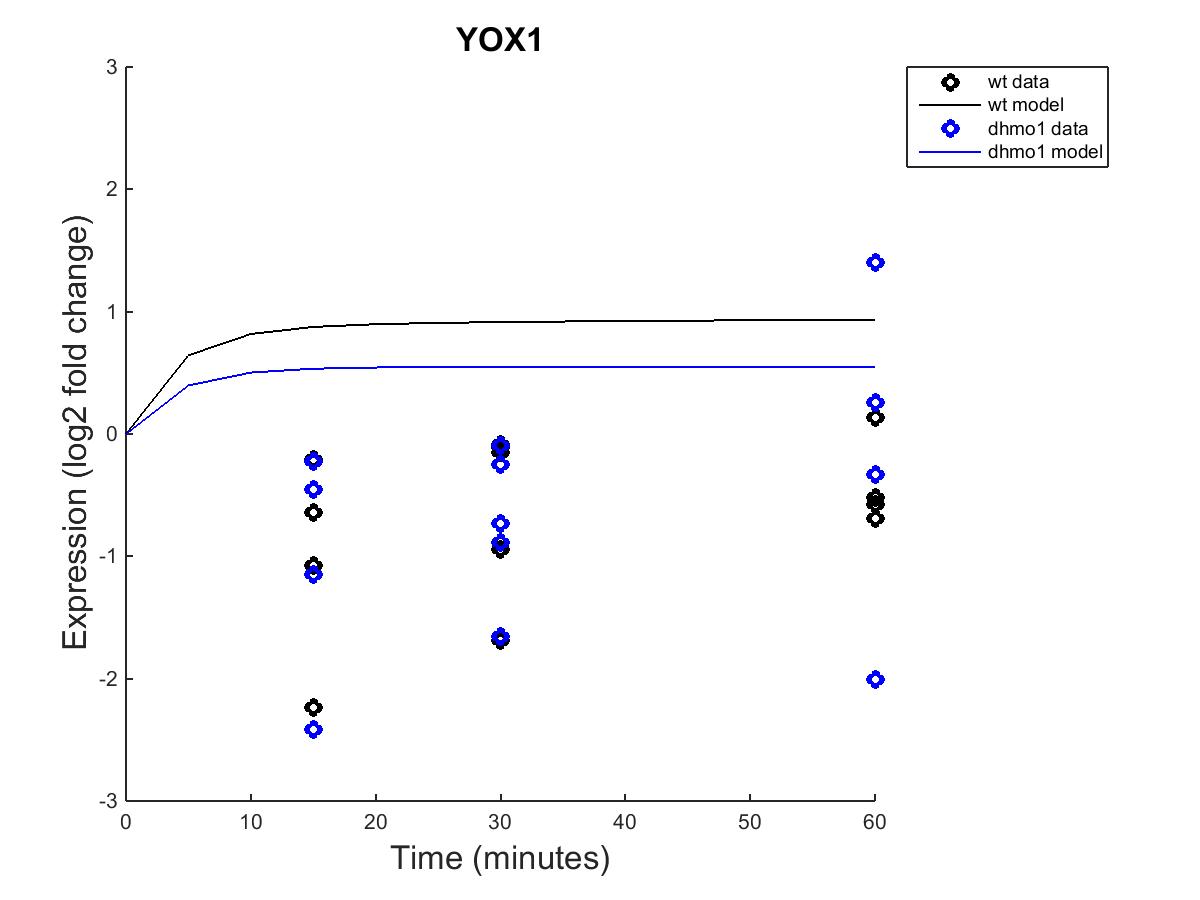
| 16:53, 23 April 2015 | L2 YOX1.jpg (file) |  |
49 KB | fig after run |
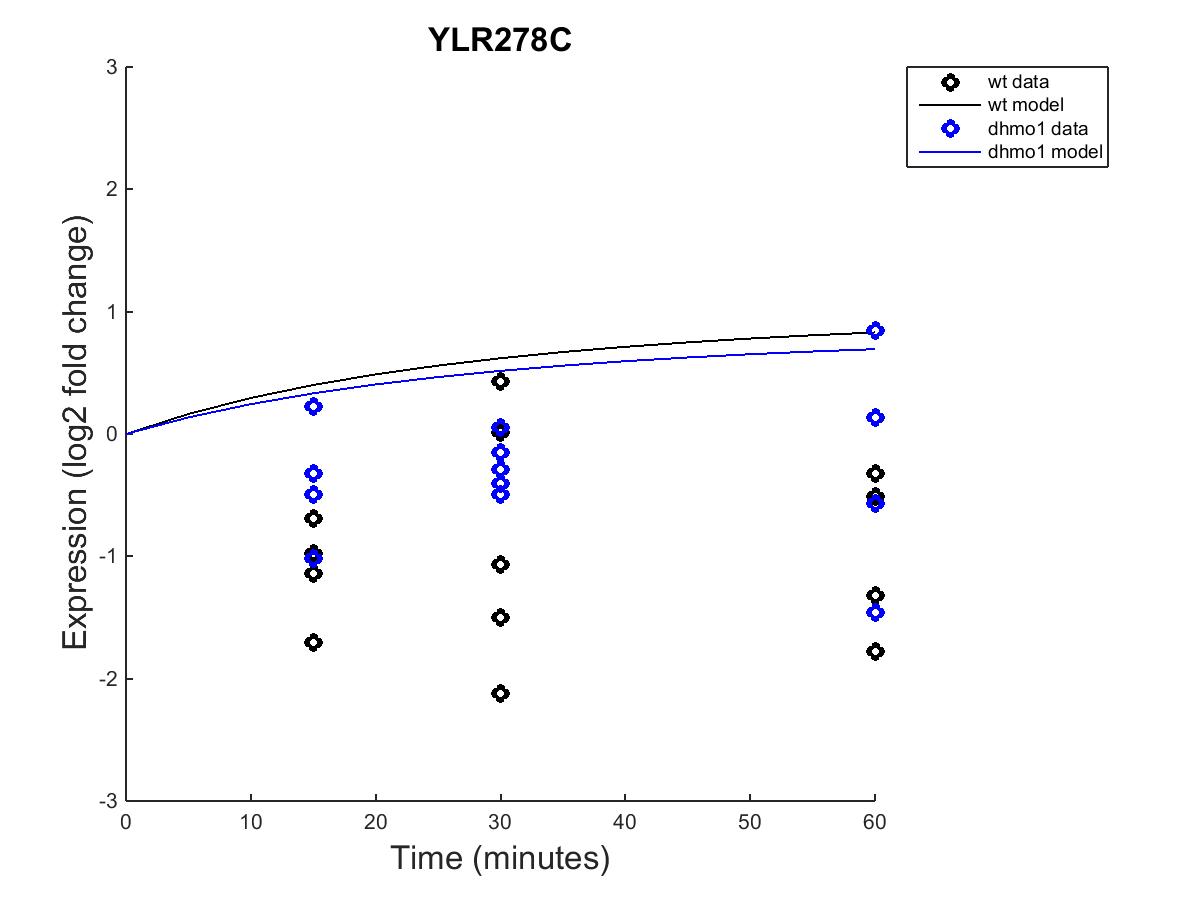
| 16:52, 23 April 2015 | L2 YLR278C.jpg (file) |  |
51 KB | fig after run |
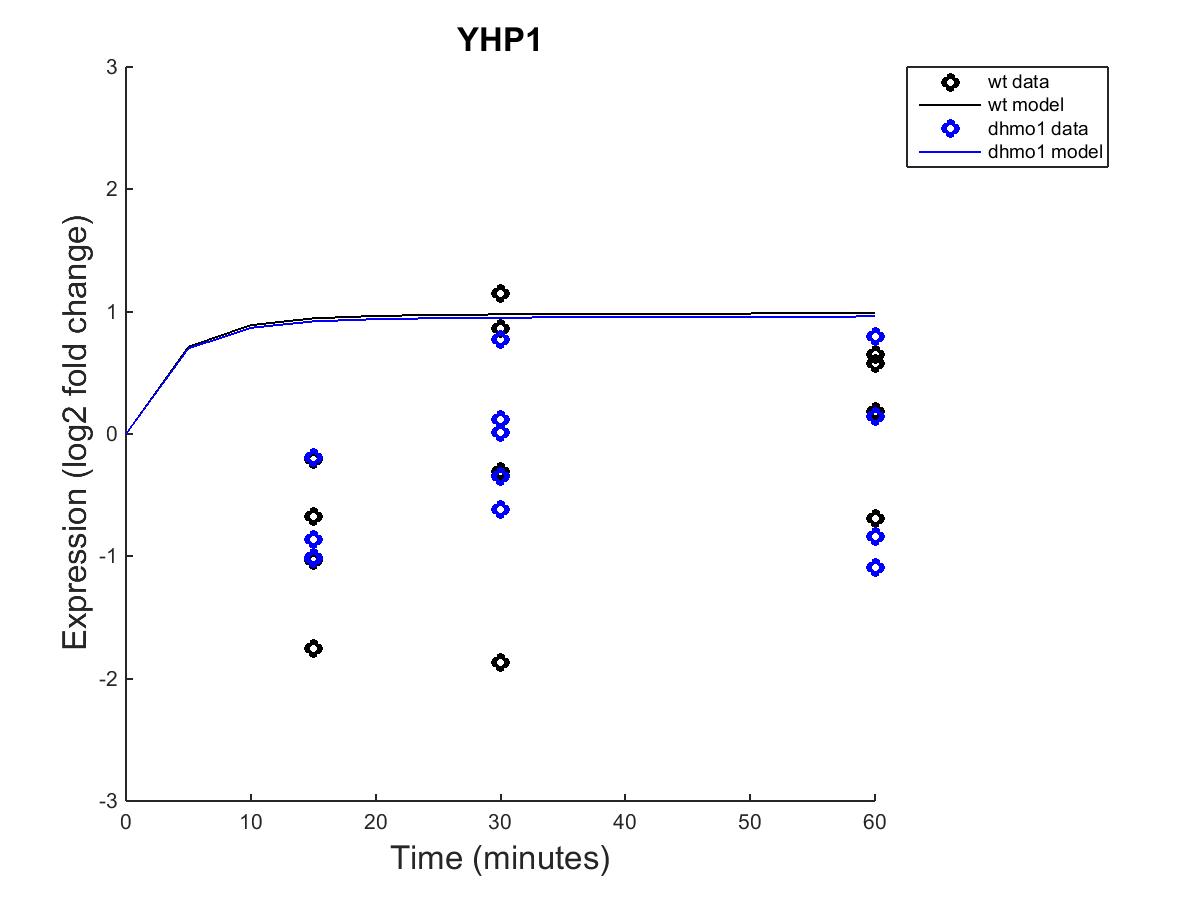
| 16:52, 23 April 2015 | L2 YHP1.jpg (file) |  |
47 KB | fig after run |
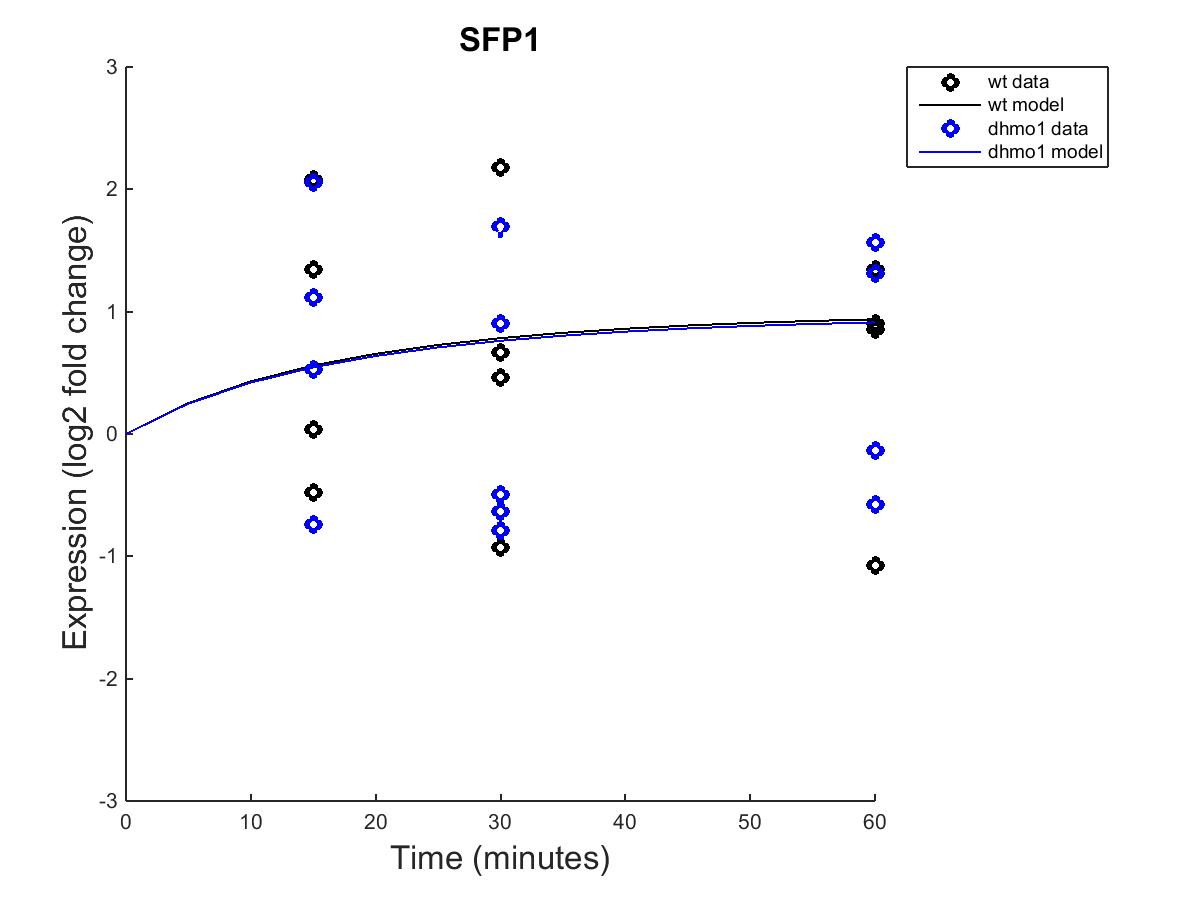
| 16:51, 23 April 2015 | L2 SFP1.jpg (file) |  |
48 KB | fig after run |
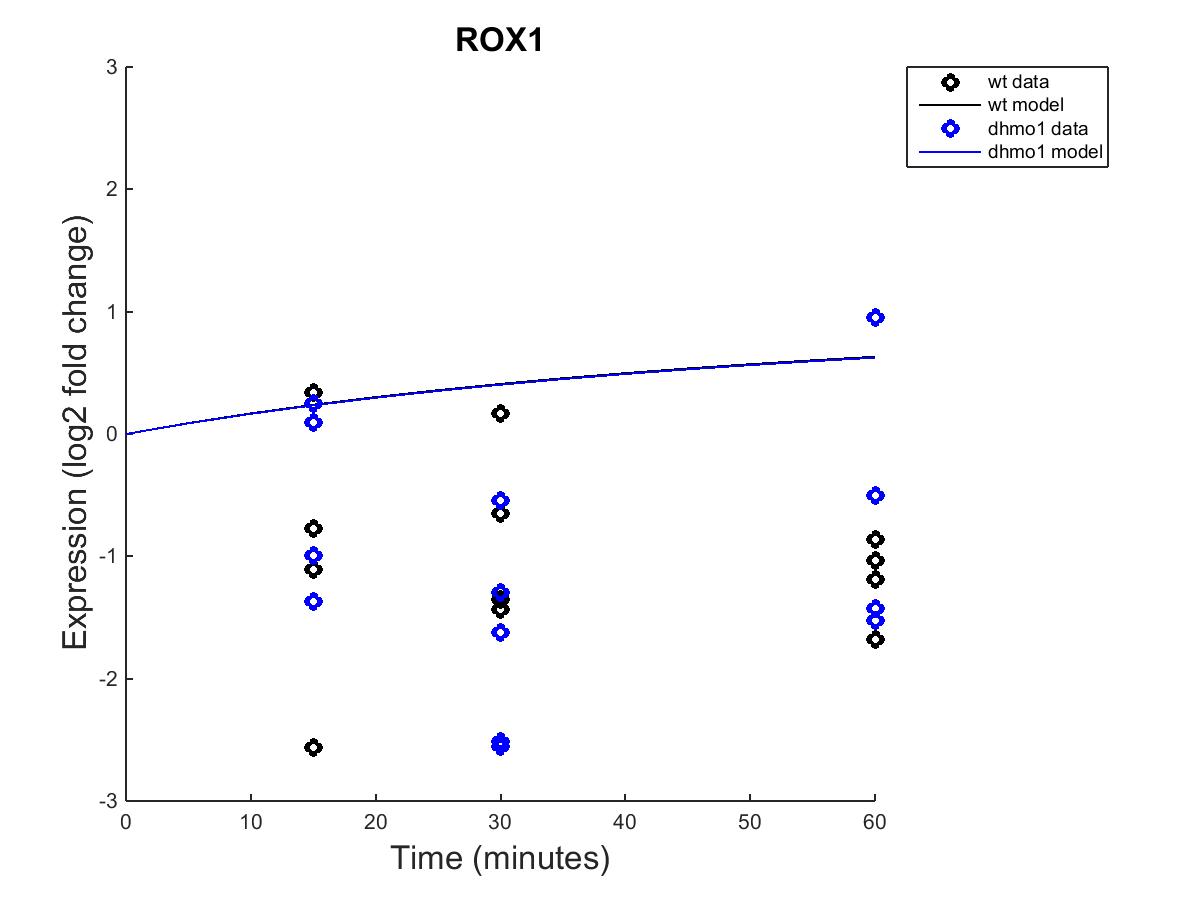
| 16:51, 23 April 2015 | L2 ROX1.jpg (file) |  |
48 KB | fig after run |
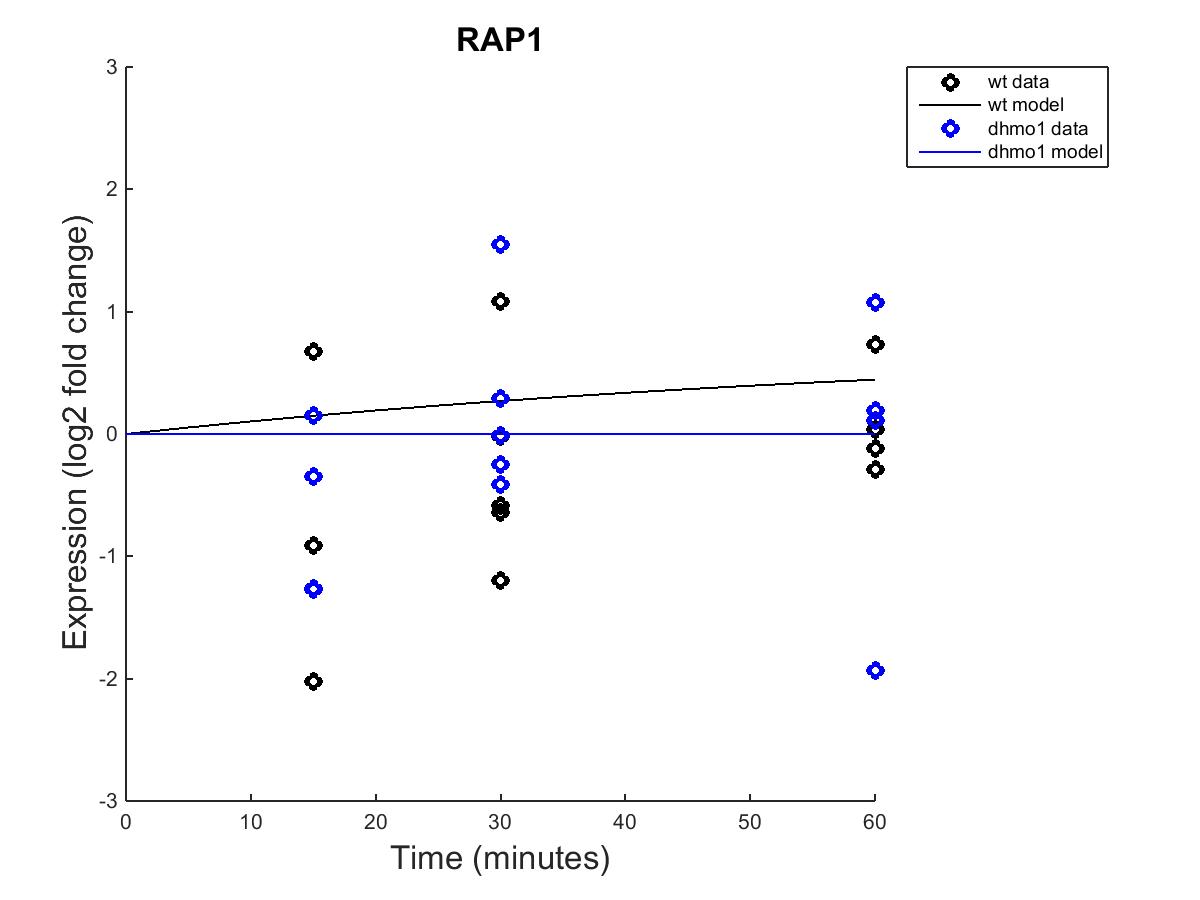
| 16:50, 23 April 2015 | L2 RAP1.jpg (file) |  |
48 KB | figure after run |
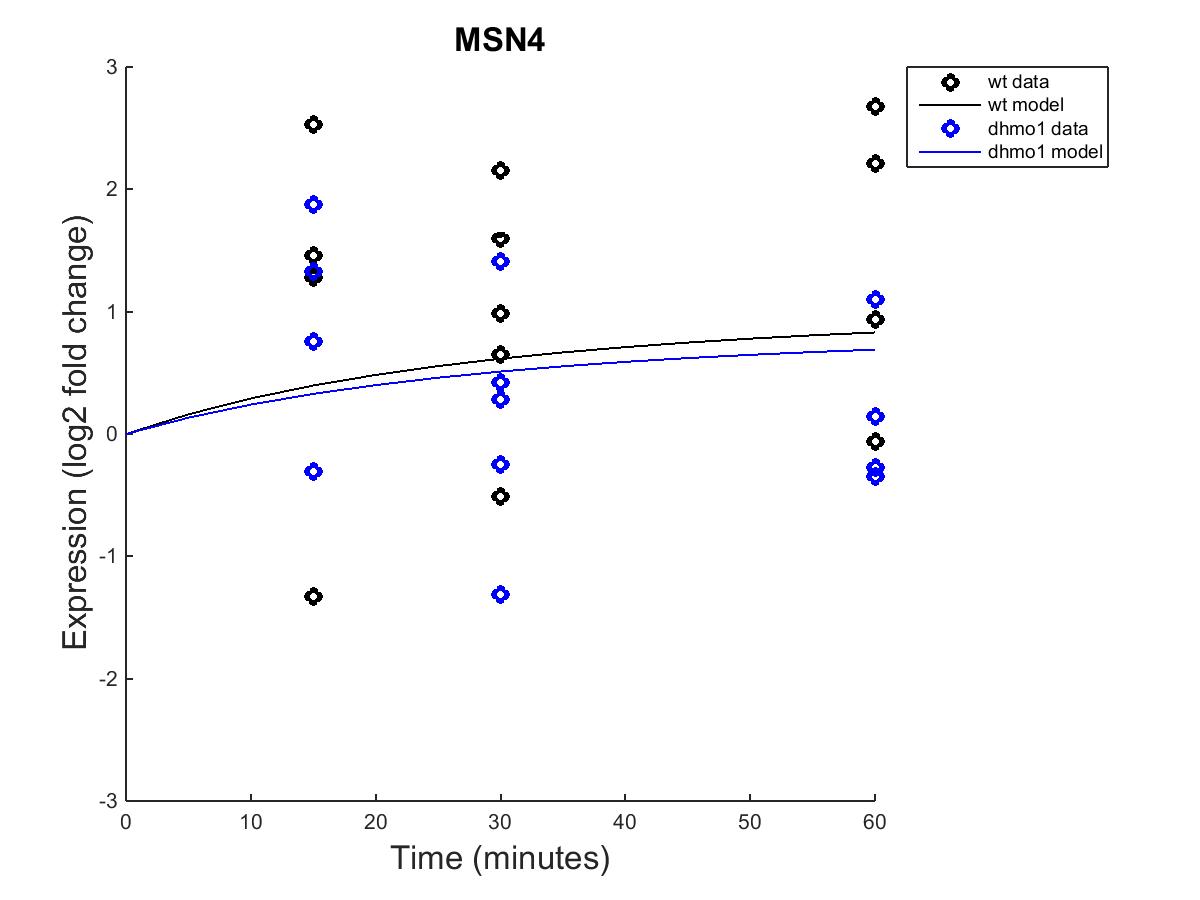
| 16:50, 23 April 2015 | L2 MSN4.jpg (file) |  |
51 KB | figure after run |
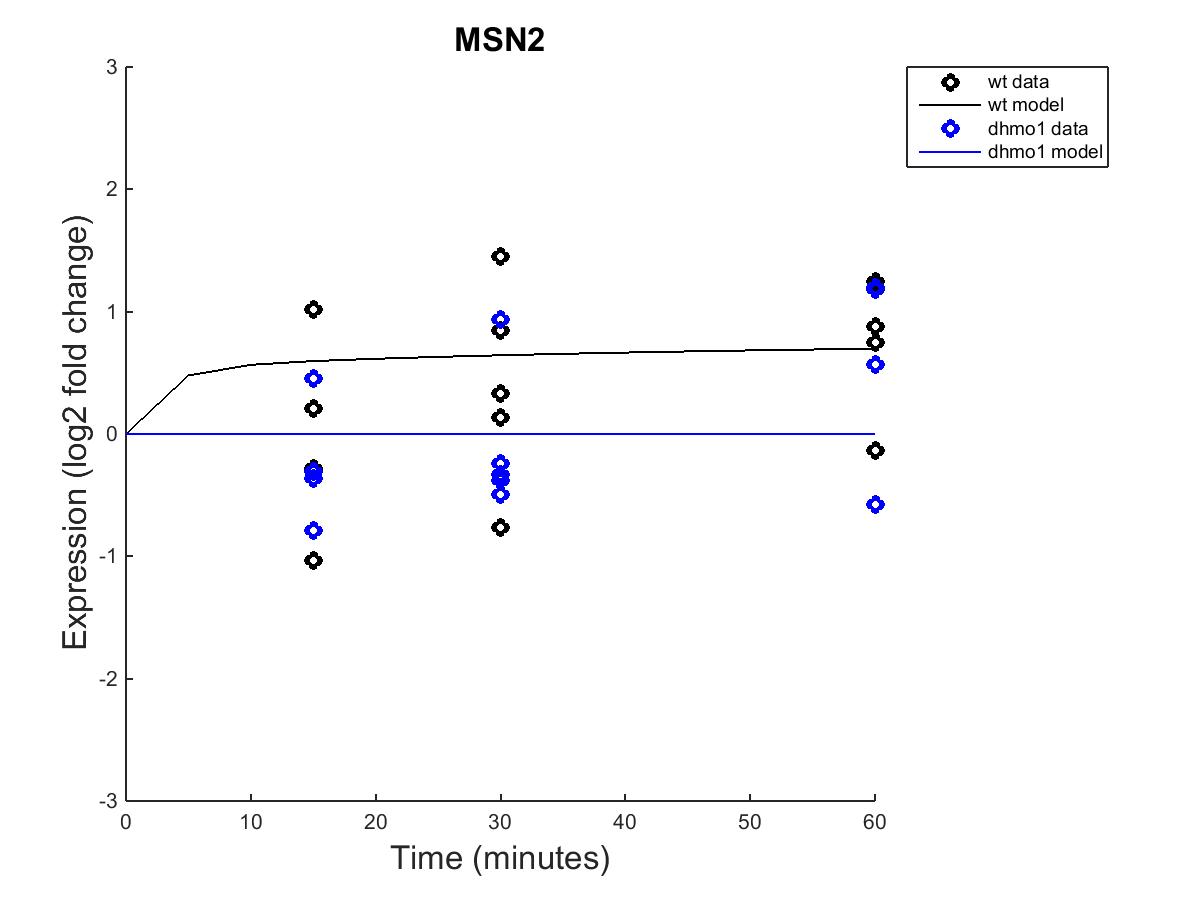
| 16:49, 23 April 2015 | L2 MSN2.jpg (file) |  |
48 KB | figure after run |
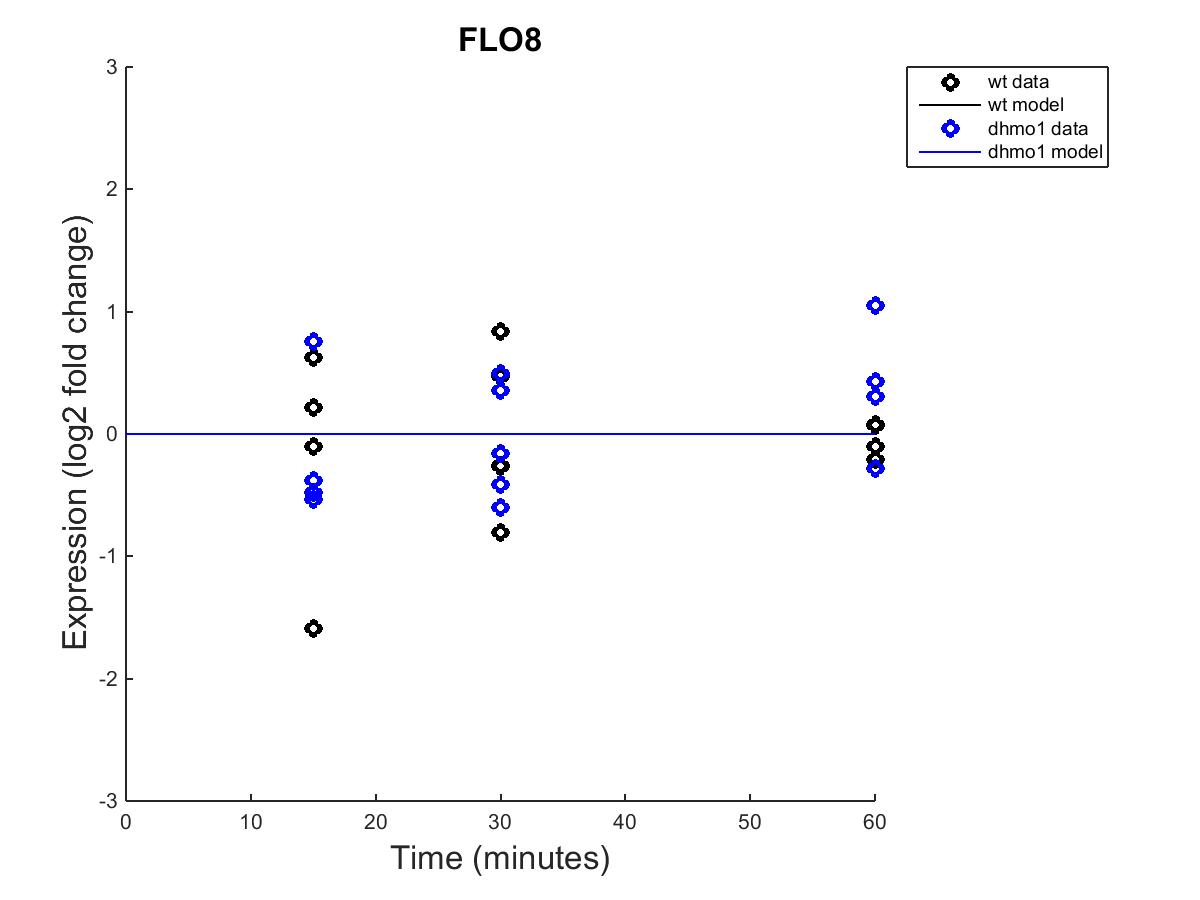
| 16:48, 23 April 2015 | L2 FLO8.jpg (file) |  |
45 KB | figure after run |
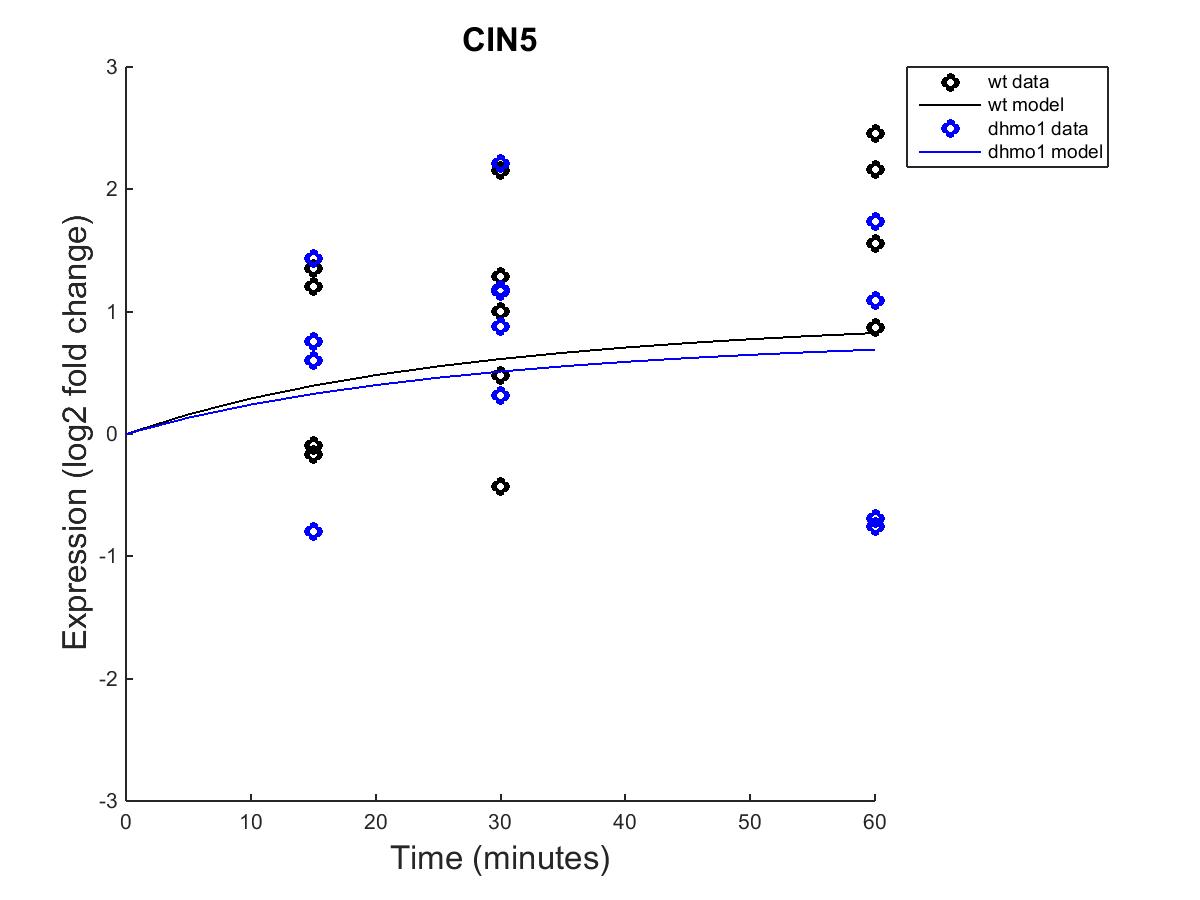
| 16:47, 23 April 2015 | L2 CIN5.jpg (file) |  |
50 KB | Figure after run |
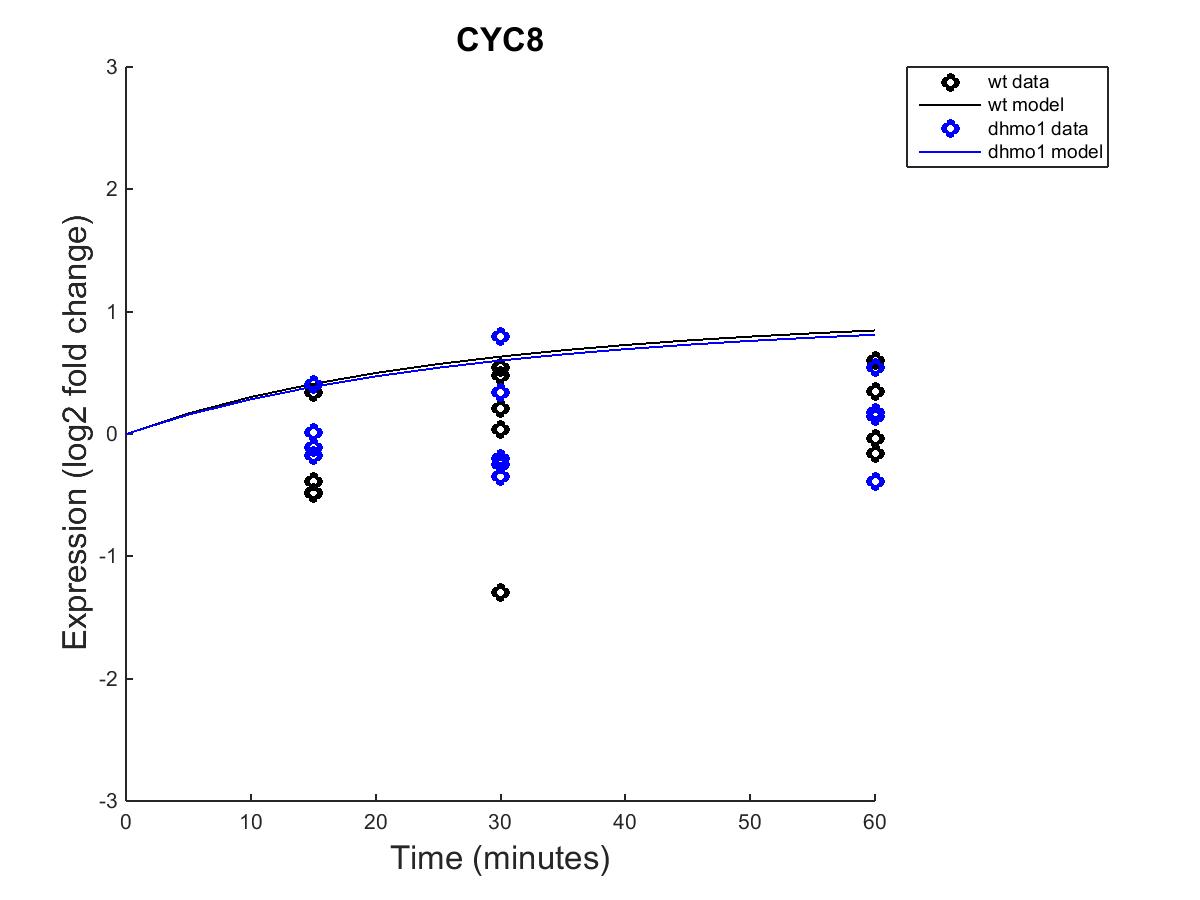
| 16:45, 23 April 2015 | L2 CYC8.jpg (file) |  |
48 KB | figure 1 after running the data |
| 16:19, 21 April 2015 | HMO1 matrixONLY.xlsx (file) | 16 KB | convert to .xlsx (second try) | |
| 16:15, 21 April 2015 | HMO1 matrixAND.xlsx (file) | 14 KB | convert to .xlsx (second try) | |
| 16:11, 21 April 2015 | HMO1 matrixAND.xls (file) | 32 KB | converted to .xlsx | |
| 16:11, 21 April 2015 | HMO1 matrixONLY.xls (file) | 16 KB | converted to .xlsx | |
| 00:22, 21 April 2015 | HMO1 matrixPLUS.xlsx (file) | 17 KB | HMO1 Network for DNA binding plus expression evidence | |
| 17:20, 16 April 2015 | BIOL398-04 S15 p-value slide Lsquared.pptx (file) | 4.97 MB | reorganized a network | |
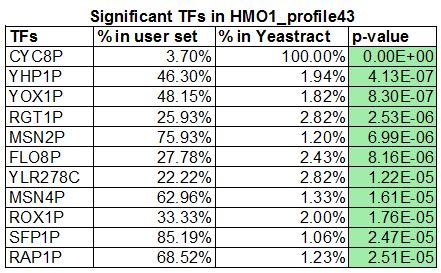
| 03:32, 14 April 2015 | HMO1profile43table.JPG (file) |  |
54 KB | table with significant transcription factors (%in user set, %in yeastract, pvalue) |
| 02:33, 14 April 2015 | Table uploaded onto openwetware TFs with pvalue profile25.xlsx (file) | 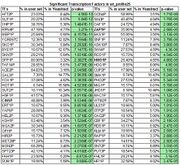 |
140 KB | Table of significant Transcription Factors in wt_profile25 |
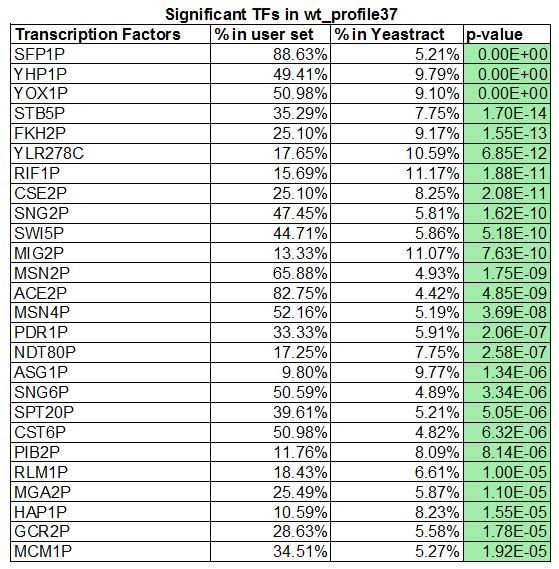
| 01:29, 14 April 2015 | P value of TF found in wt profile37.JPG (file) |  |
111 KB | list of TFs in wt_profile37 with % in user set, %in Yeastract and p_value. |
| 07:38, 7 April 2015 | LR STEM Results.pptx (file) | 3.47 MB | STEM Results, screenshots of STEM Profiles | |
| 06:03, 24 March 2015 | TMKHLRJournal Club 2-1.pptx (file) | 1.16 MB | Presentation on Transcriptional Regulators | |
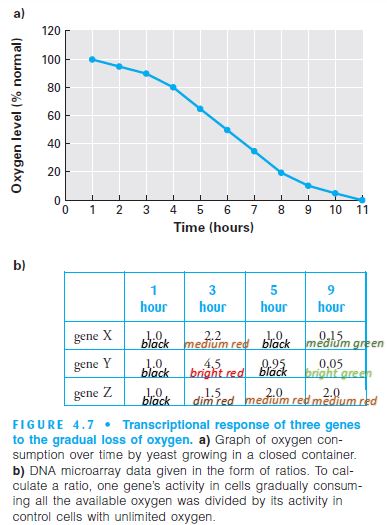
| 15:42, 17 March 2015 | Fig4 7.JPG (file) |  |
51 KB | Figure 4.7 with edits |
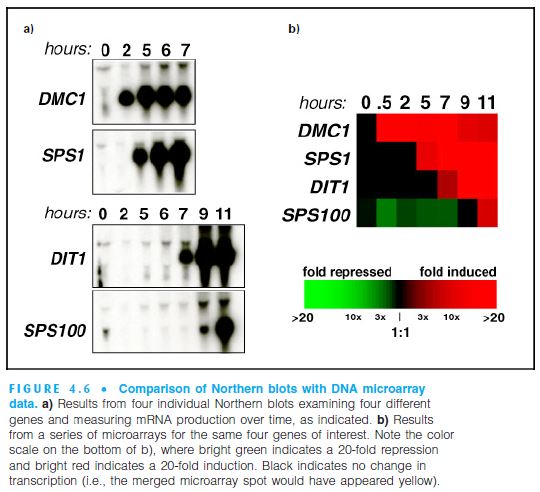
| 15:17, 17 March 2015 | Fig4 6b.JPG (file) |  |
57 KB | Figure 4.6 from textbook |
| 15:16, 17 March 2015 | Document1.pdf (file) |  |
27 KB | Graph with new y-axis scale |
| 17:22, 3 March 2015 | BioMath Presentation.ppt (file) | 899 KB | powerpoint extension | |
| 08:34, 3 March 2015 | BioMath Presentation.pdf Presentation Slides (file) | 372 KB | updated presentation | |
| 08:32, 3 March 2015 | BioMath Presentation.pdf (file) | 372 KB | ||
| 07:43, 3 March 2015 | Steady State AnalysisLsquared.pdf (file) | 765 KB | Steady State Hand Analysis | |
| 18:35, 26 February 2015 | Lsquareddynamics.m (file) | 329 bytes | Lsquared function of all differential equation describing the concentrations of a, b, and c | |
| 18:32, 26 February 2015 | Lsquareddynamics script.m (file) | 595 bytes | Lsquared script of a, b, and c concentrations | |
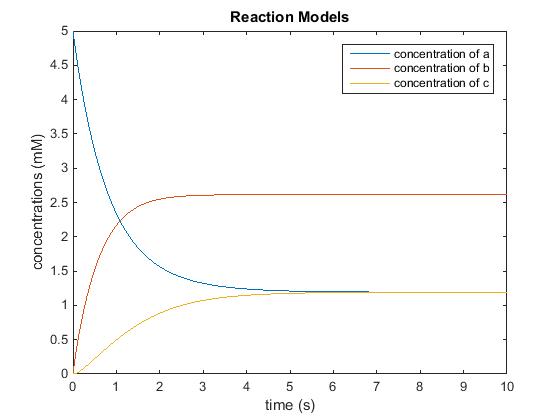
| 18:29, 26 February 2015 | LsquaredGraph.jpg (file) |  |
21 KB | Lsquared figure from matlab function and script. a,b, and c concentrations vs time. |
| 06:46, 17 February 2015 | LuciaIRamirezScript.m (file) | 433 bytes | most current version of Script. Changes made on variable names. | |
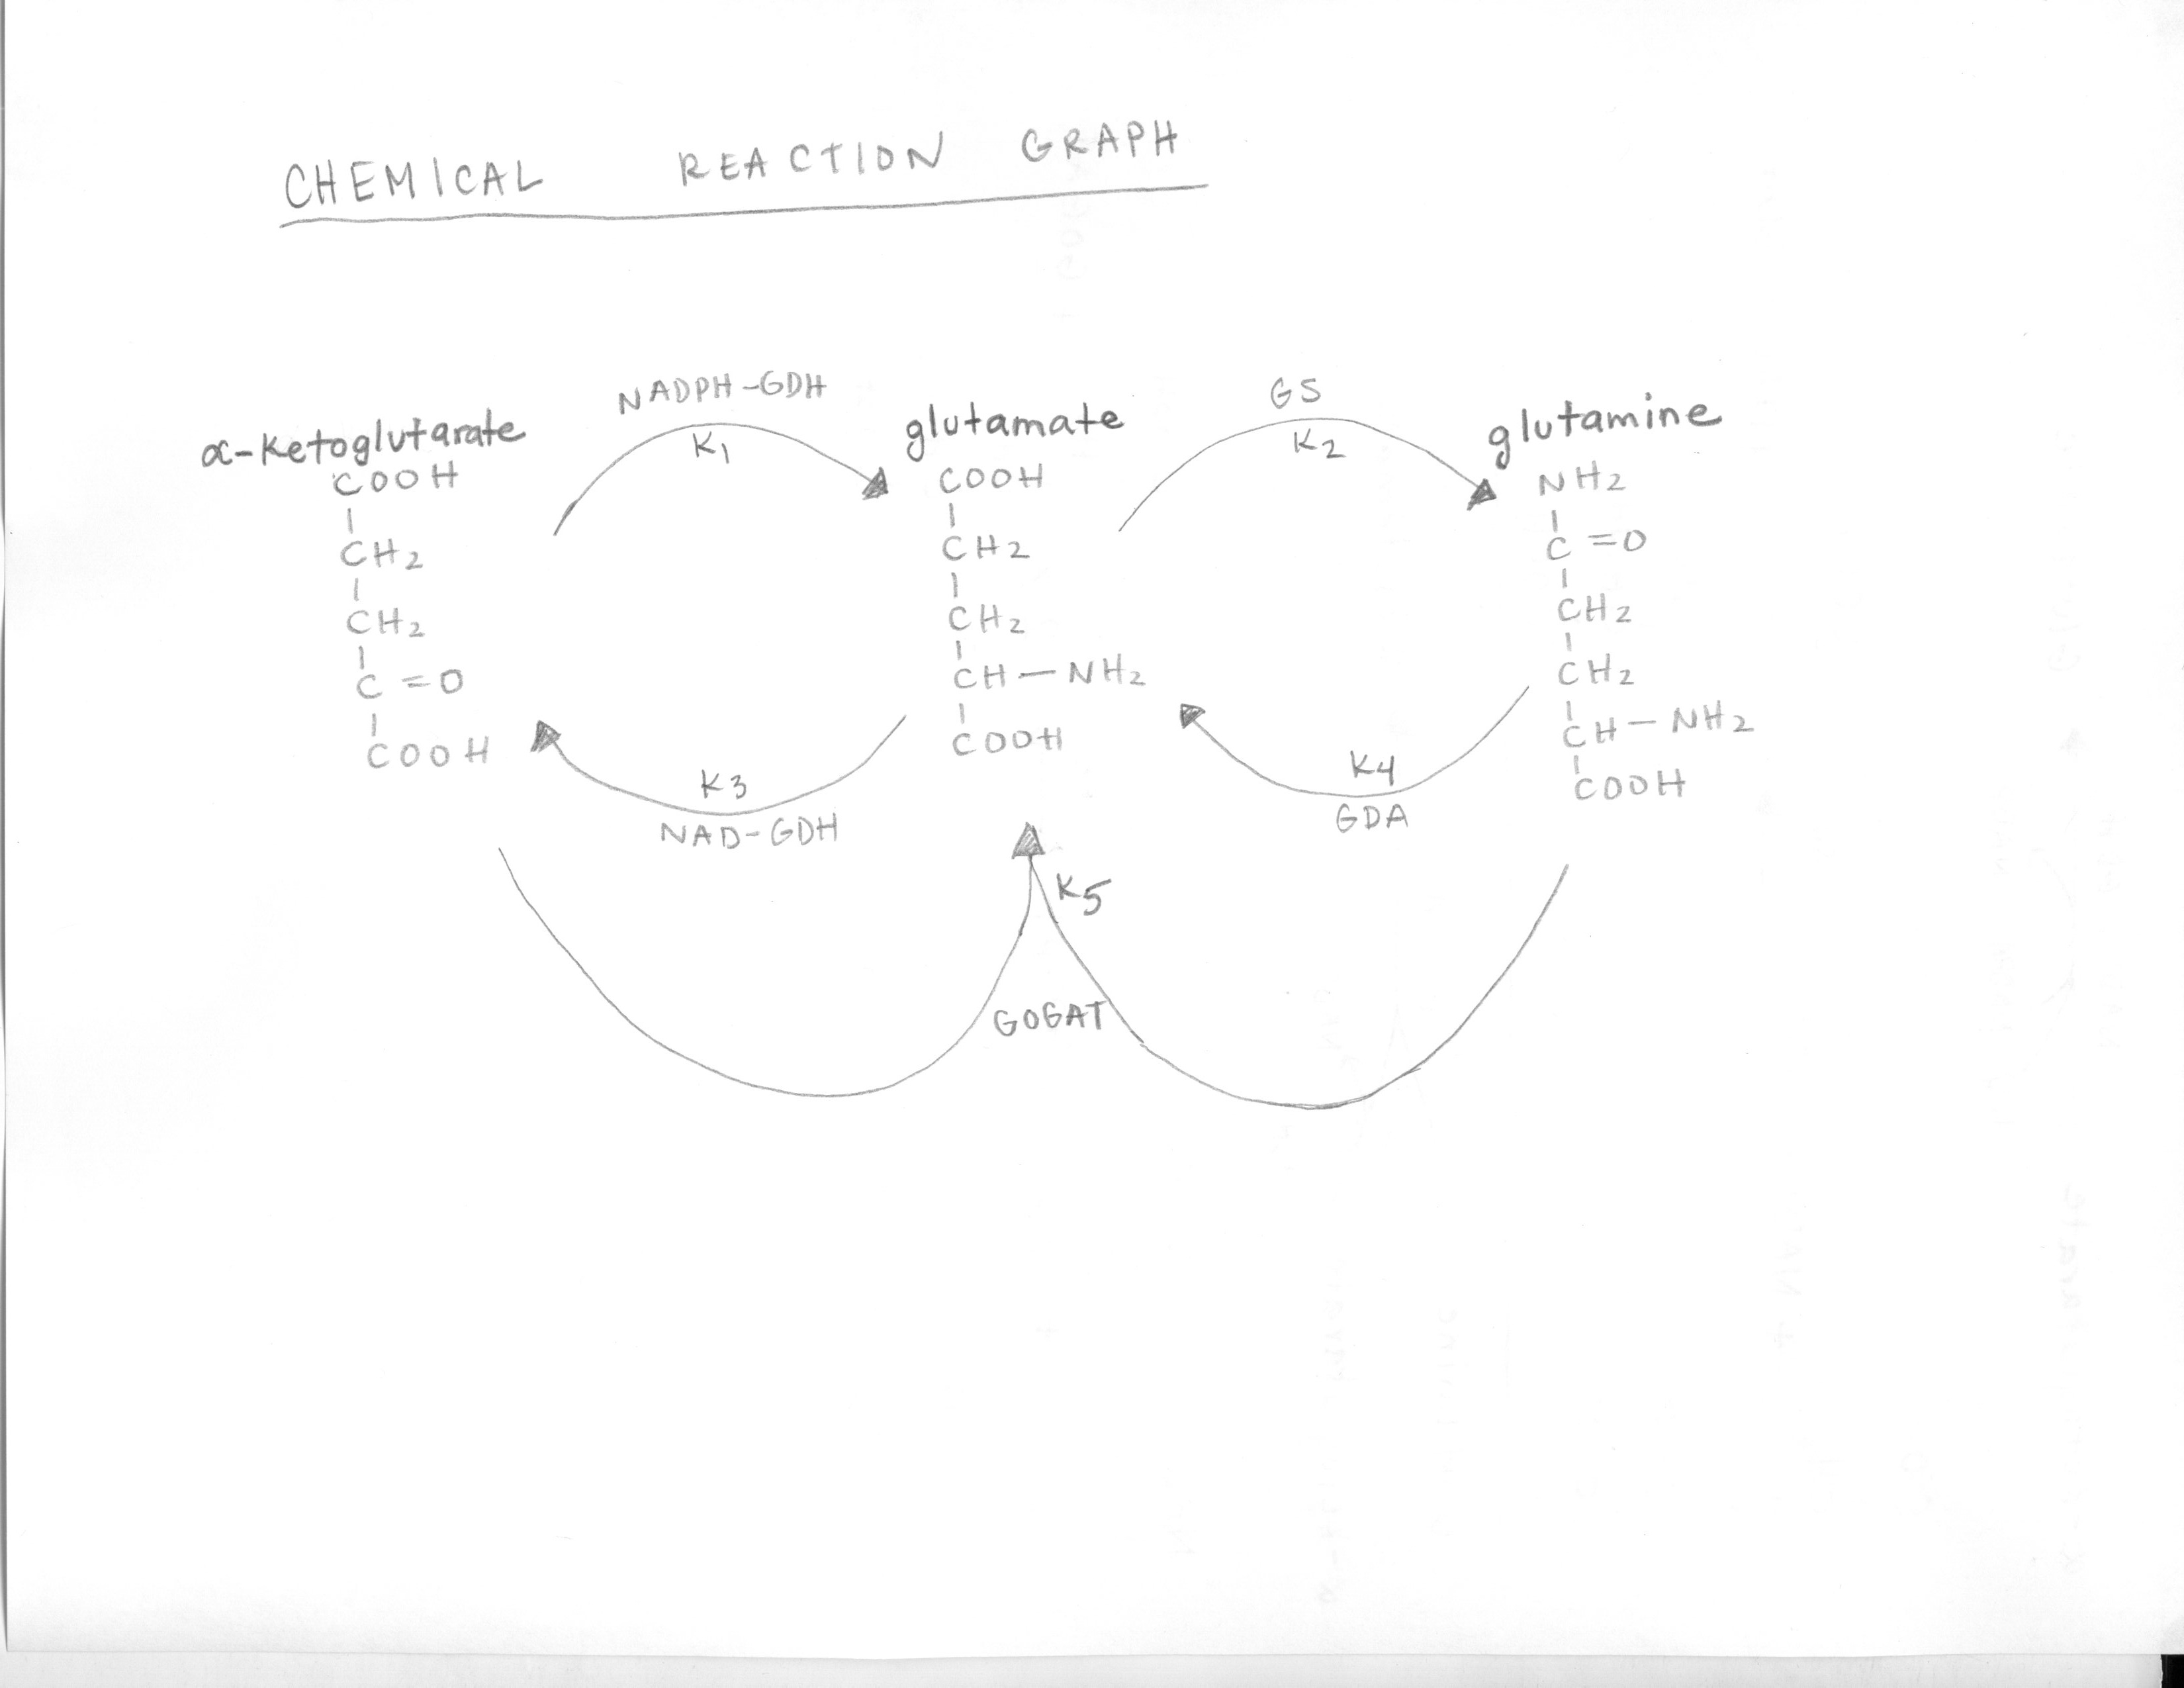
| 06:15, 17 February 2015 | Chemical Rxn Graph LIR001.jpg (file) |  |
303 KB | Lucia I. Ramirez's Chemical Reaction Graph |
