Uploads by Ganesh Sriram
From OpenWetWare
Jump to navigationJump to search
This special page shows all uploaded files.
| Date | Name | Thumbnail | Size | Description |
|---|---|---|---|---|
| 03:35, 15 June 2014 | Microbialcellfactories-zheng-et-al-2013-fig4.svg (file) |  |
93 KB | |
| 02:39, 15 June 2014 | Microbialcellfactories-zheng-et-al-2013-fig3.svg (file) |  |
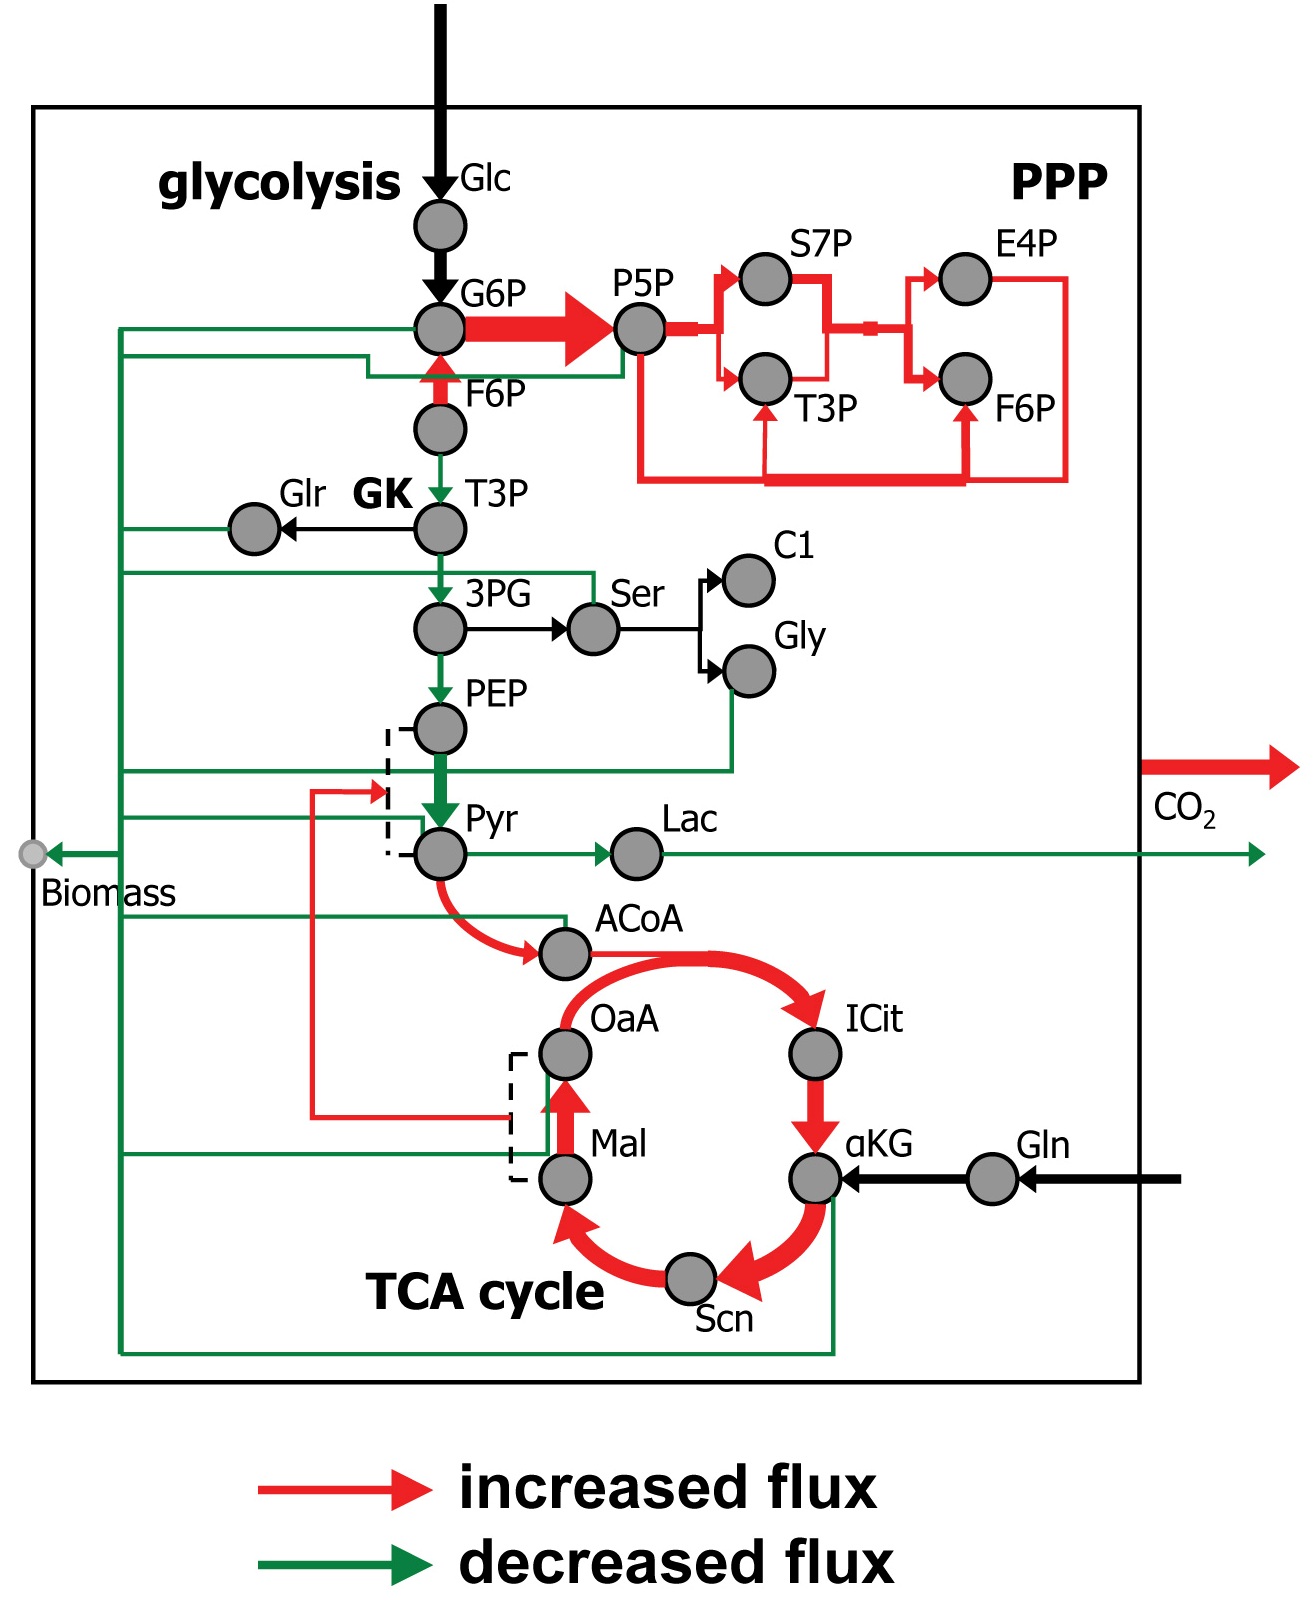
129 KB | <b>Putative metabolic pathways in the marine diatom <i>Phaeodactylum tricornutum</i> investigated by us through isotope-assisted metabolic pathway analysis.</b> This metabolic network includes 10 metabolic pathways distinguished by line color. Metabolic M |
| 02:30, 15 June 2014 | Bmcsysbiol-misra-sriram-2013-fig2.svg (file) |  |
160 KB | [[<b>An Arabidopsis transcription factor-gene regulatory network as quantitatively deduced by network component analysis.</b> Directions and control strengths of connections between 10 transcription factors (TFs) (lilac) important in Arabidopsis floral de |
| 19:32, 20 December 2013 | Supplementary Tables (Nargund Misra Zhang Coleman Sriram 2013).pdf (file) | 2.84 MB | ||
| 19:28, 20 December 2013 | Supplementary Tables(Nargund Misra Zhang Coleman Sriram 2013).pdf (file) | 2.84 MB | ||
| 19:28, 20 December 2013 | Accepted Manuscript (Nargund Misra Zhang Coleman Sriram 2013).pdf (file) | 1.35 MB | ||
| 05:06, 24 November 2013 | Mcf-1475-2859-12-109-4-l.jpg (file) |  |
155 KB | Isotope-assisted metabolic pathway analysis in the marine diatom Phaeodactylum tricornutum. (a) Four different Metabolic Models (I-IV) were constructed to explain the ILE data; each column represents a different model. Pathways included in a model are den |
| 05:04, 24 November 2013 | Mcf-1475-2859-12-109-3-l.jpg (file) |  |
317 KB | Putative metabolic pathways in the marine diatom Phaeodactylum tricornutum as deduced by isotope-assisted metabolic pathway analysis. This metabolic network includes 10 metabolic pathways distinguished by line color. Metabolic Models I-IX consist of diffe |
| 03:57, 24 November 2013 | Bmcsysbiol-misra-sriram-2013-fig2.jpg (file) |  |
2.68 MB | Directions and control strengths of connections between 10 transcription factors (TFs) (lilac) important in Arabidopsis floral development and their 57 target genes (light blue), as quantitatively deduced by network component analysis. Edges from TFs to g |
| 03:44, 6 November 2013 | Accepted Manuscript (Zheng Quinn Sriram).pdf (file) | 1.31 MB | ||
| 21:37, 5 November 2013 | Misra Sriram BMC Syst Biol Accepted manuscript.pdf (file) | 537 KB | ||
| 21:00, 18 October 2012 | Sriram Lab banner.jpg (file) | 206 KB | ||
| 05:55, 21 November 2010 | Fig 1 Math modeling in synthetic biology.jpg (file) |  |
32 KB | |
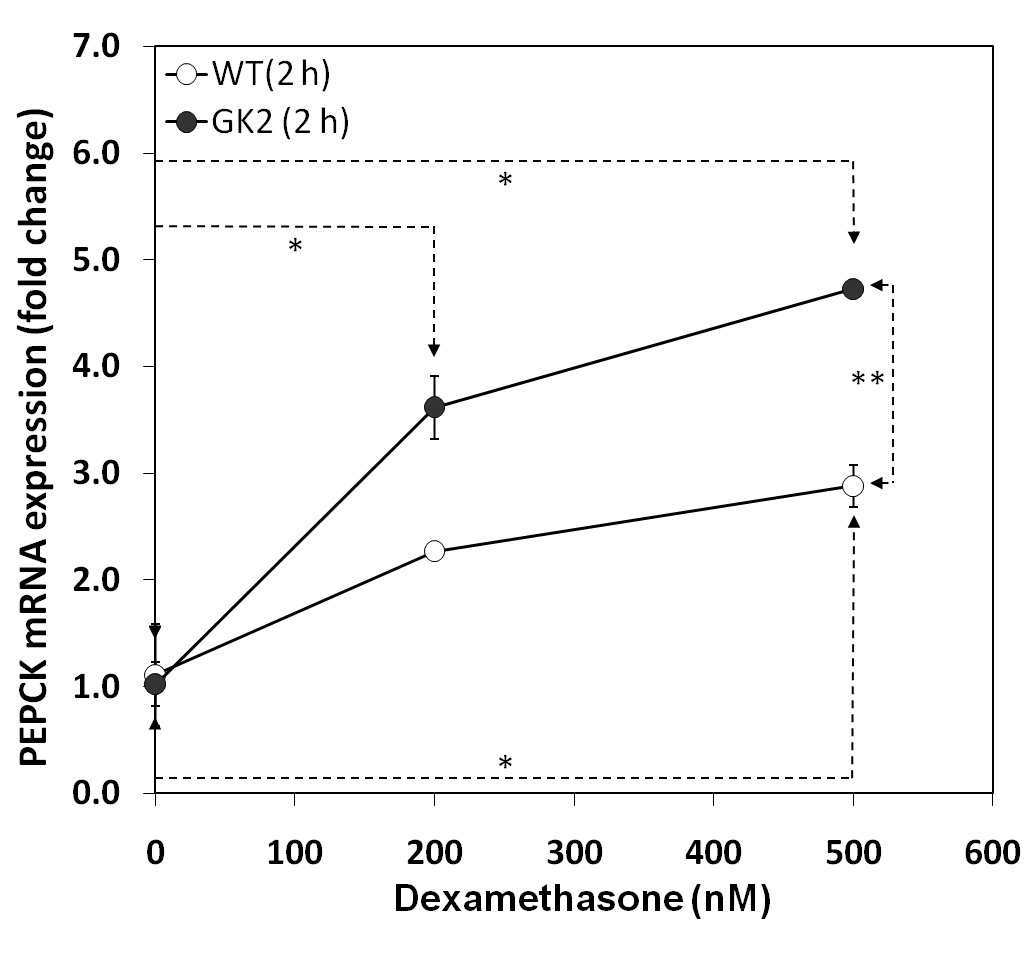
| 05:39, 21 November 2010 | Fig 5b GK ASTP assay 1.jpg (file) |  |
70 KB | |
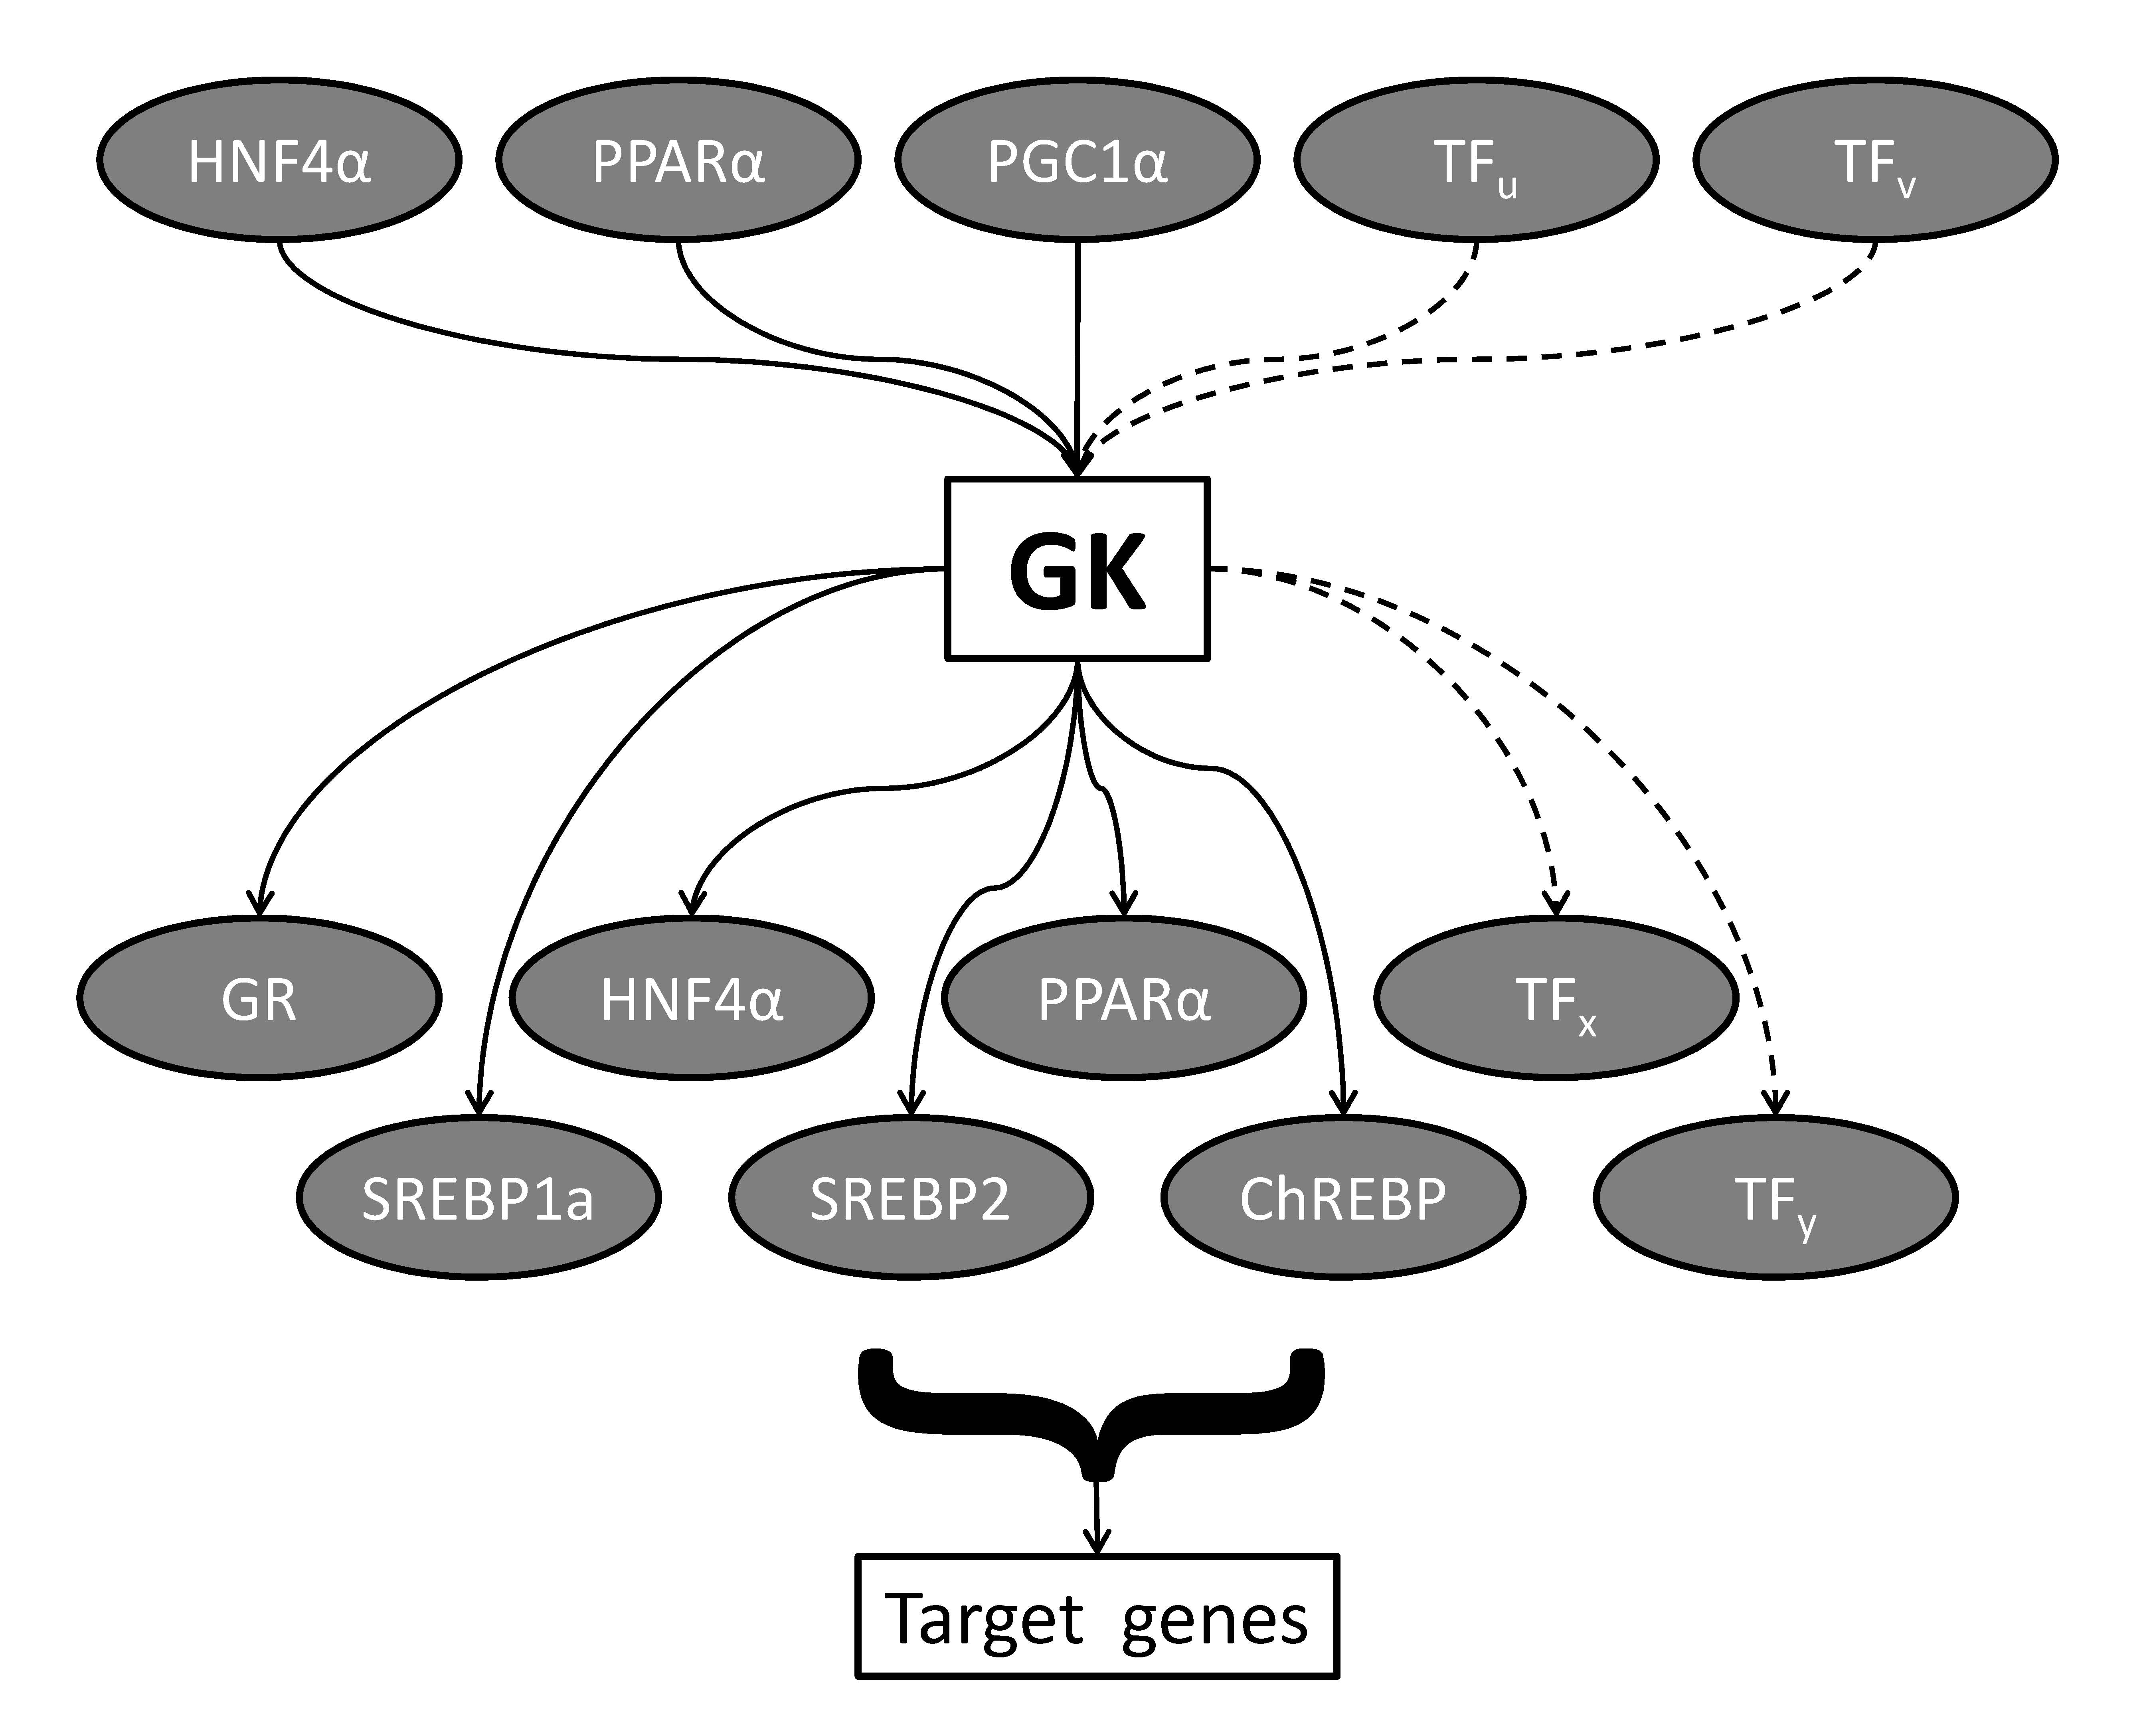
| 05:38, 21 November 2010 | Fig1 GK transcriptional network.jpg (file) | 676 KB | ||
| 04:39, 27 August 2010 | DSC00314.JPG (file) |  |
4.49 MB | |
| 03:41, 24 July 2010 | Sriram Lab 2010 July.JPG (file) |  |
2.66 MB | |
| 15:40, 13 May 2010 | Labeling expt.svg (file) |  |
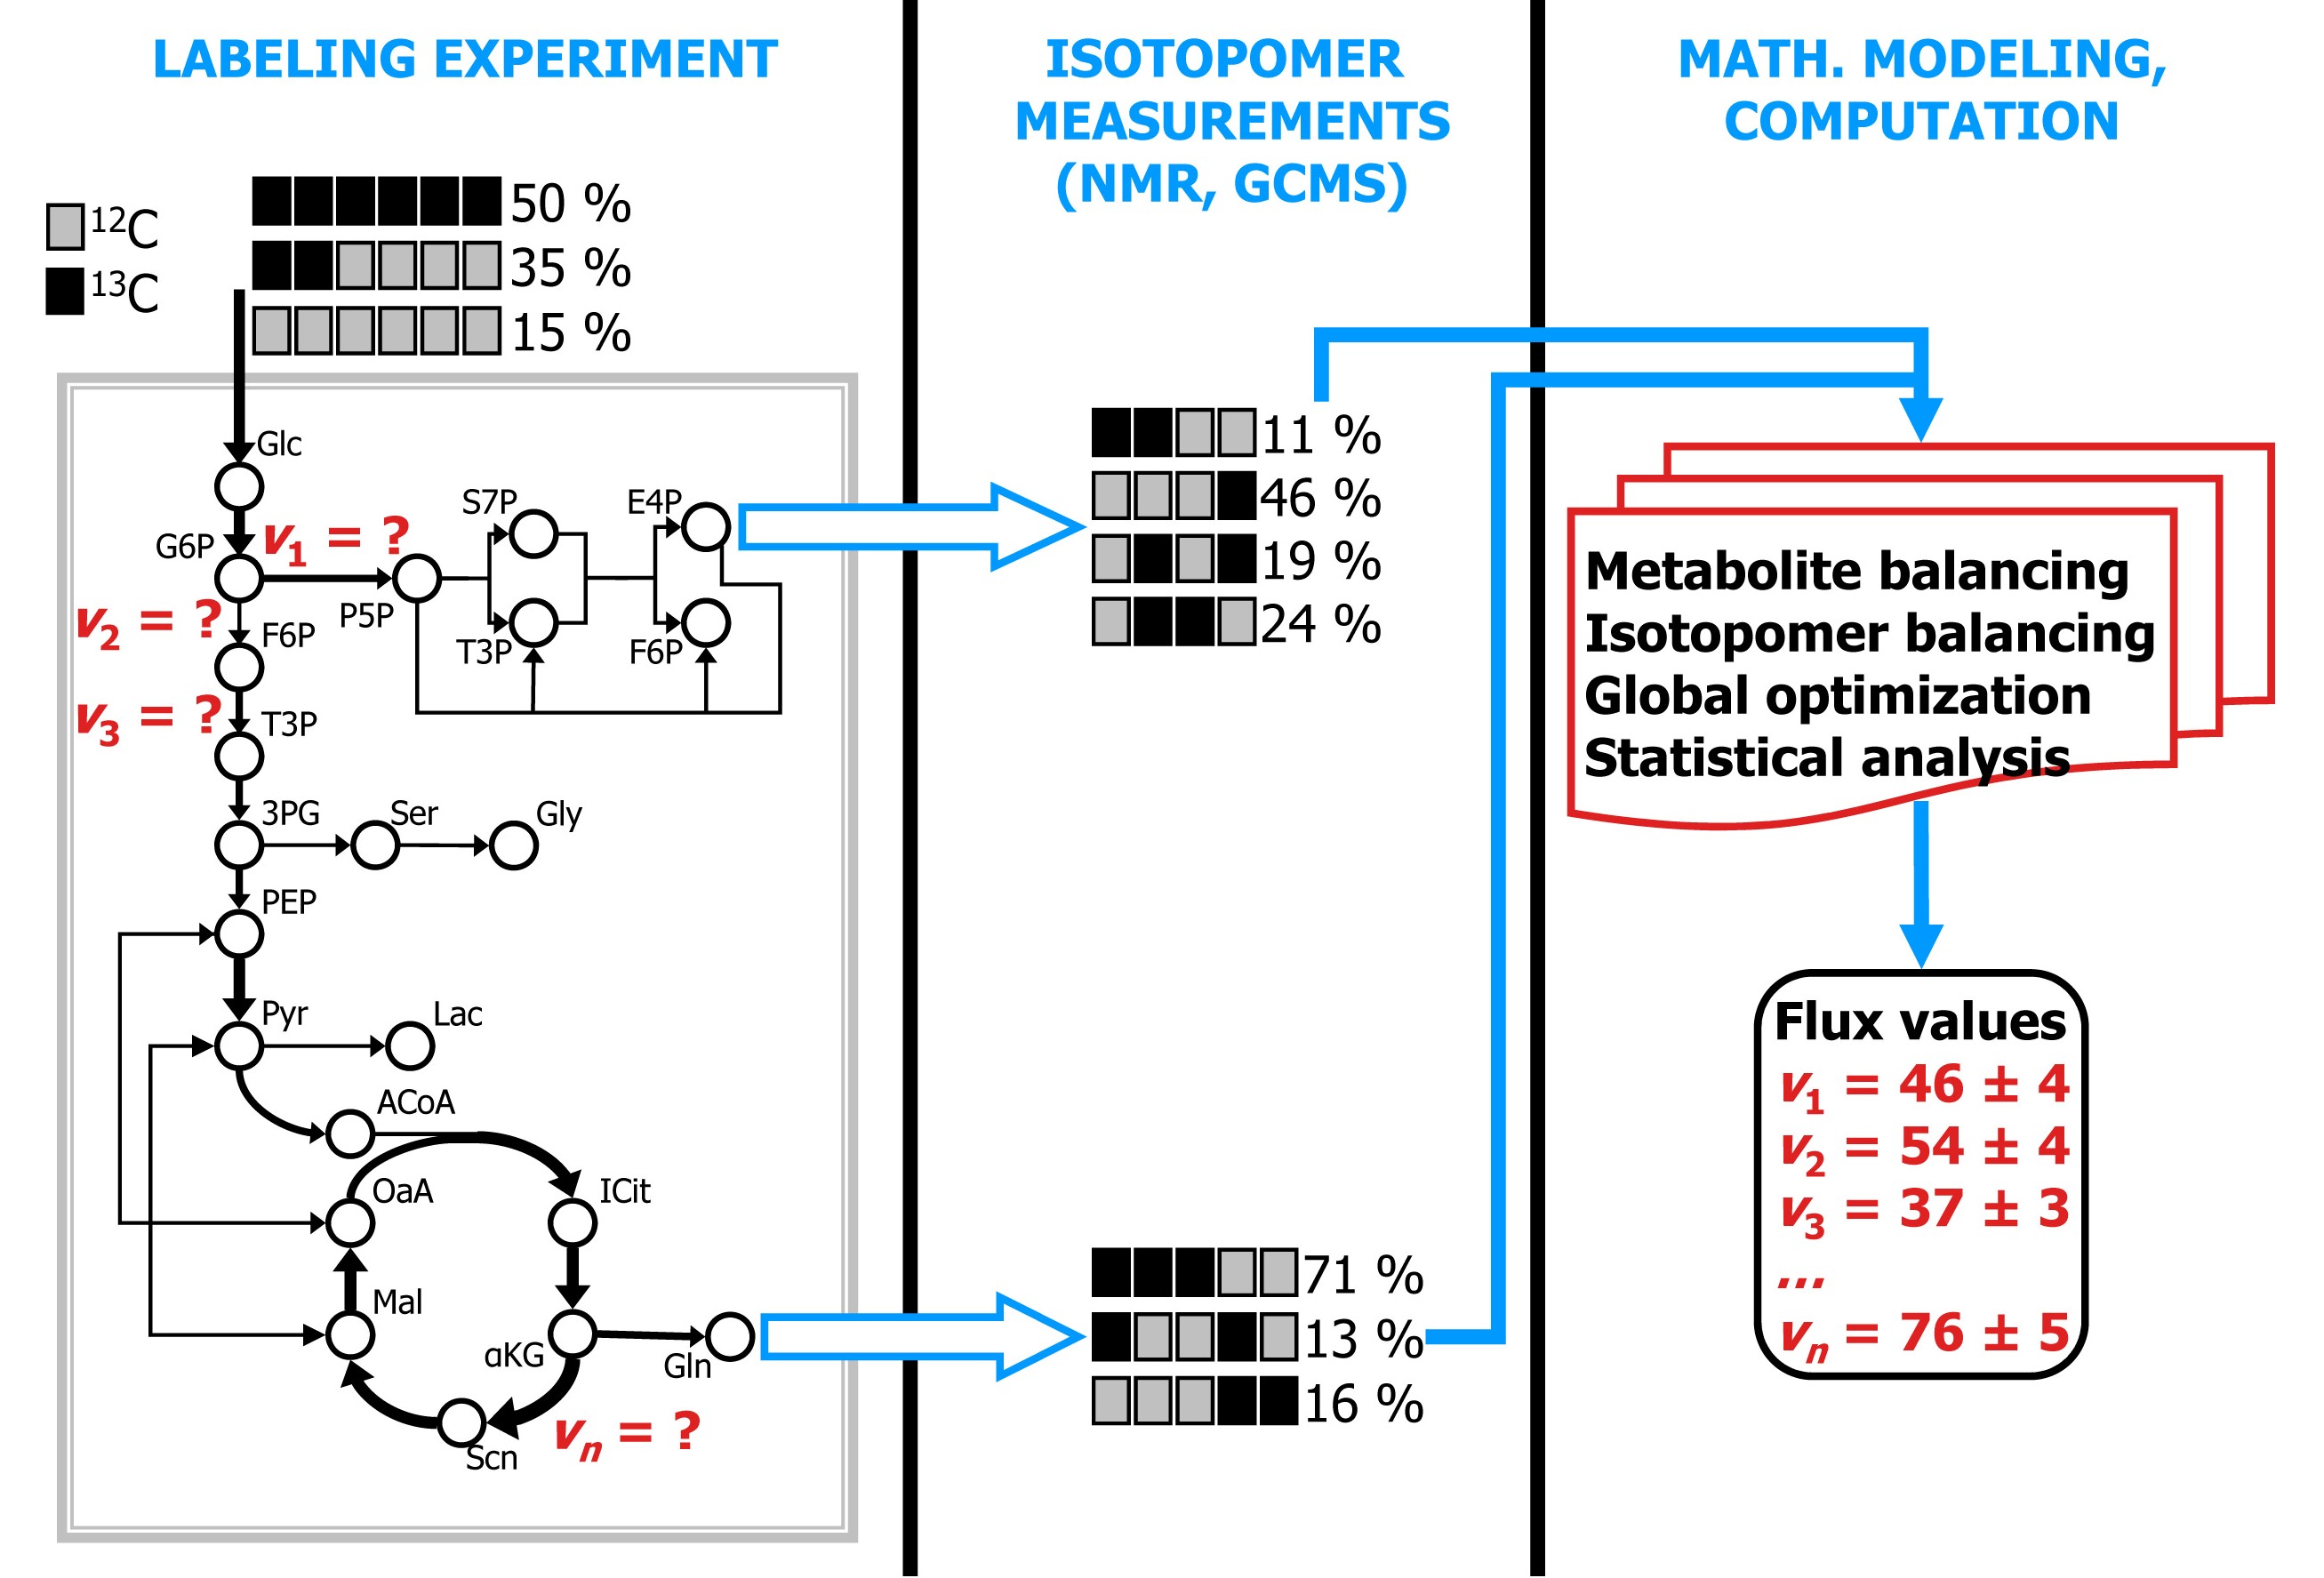
206 KB | '''Quantifying carbon traffic by isotope-assisted metabolic flux analysis.''' A computationally designed combination of stable isotope (e.g. 13C and 12C) carbon sources is fed to an organism (left), which synthesizes metabolites from these carbon sources; |
| 00:14, 2 May 2010 | GSriram.jpg (file) |  |
114 KB | |
| 18:35, 13 April 2010 | MBE-09-55-R2.pdf (file) | 1.74 MB | ||
| 03:02, 11 August 2009 | Ganesh UMD 1c.jpg (file) |  |
341 KB | |
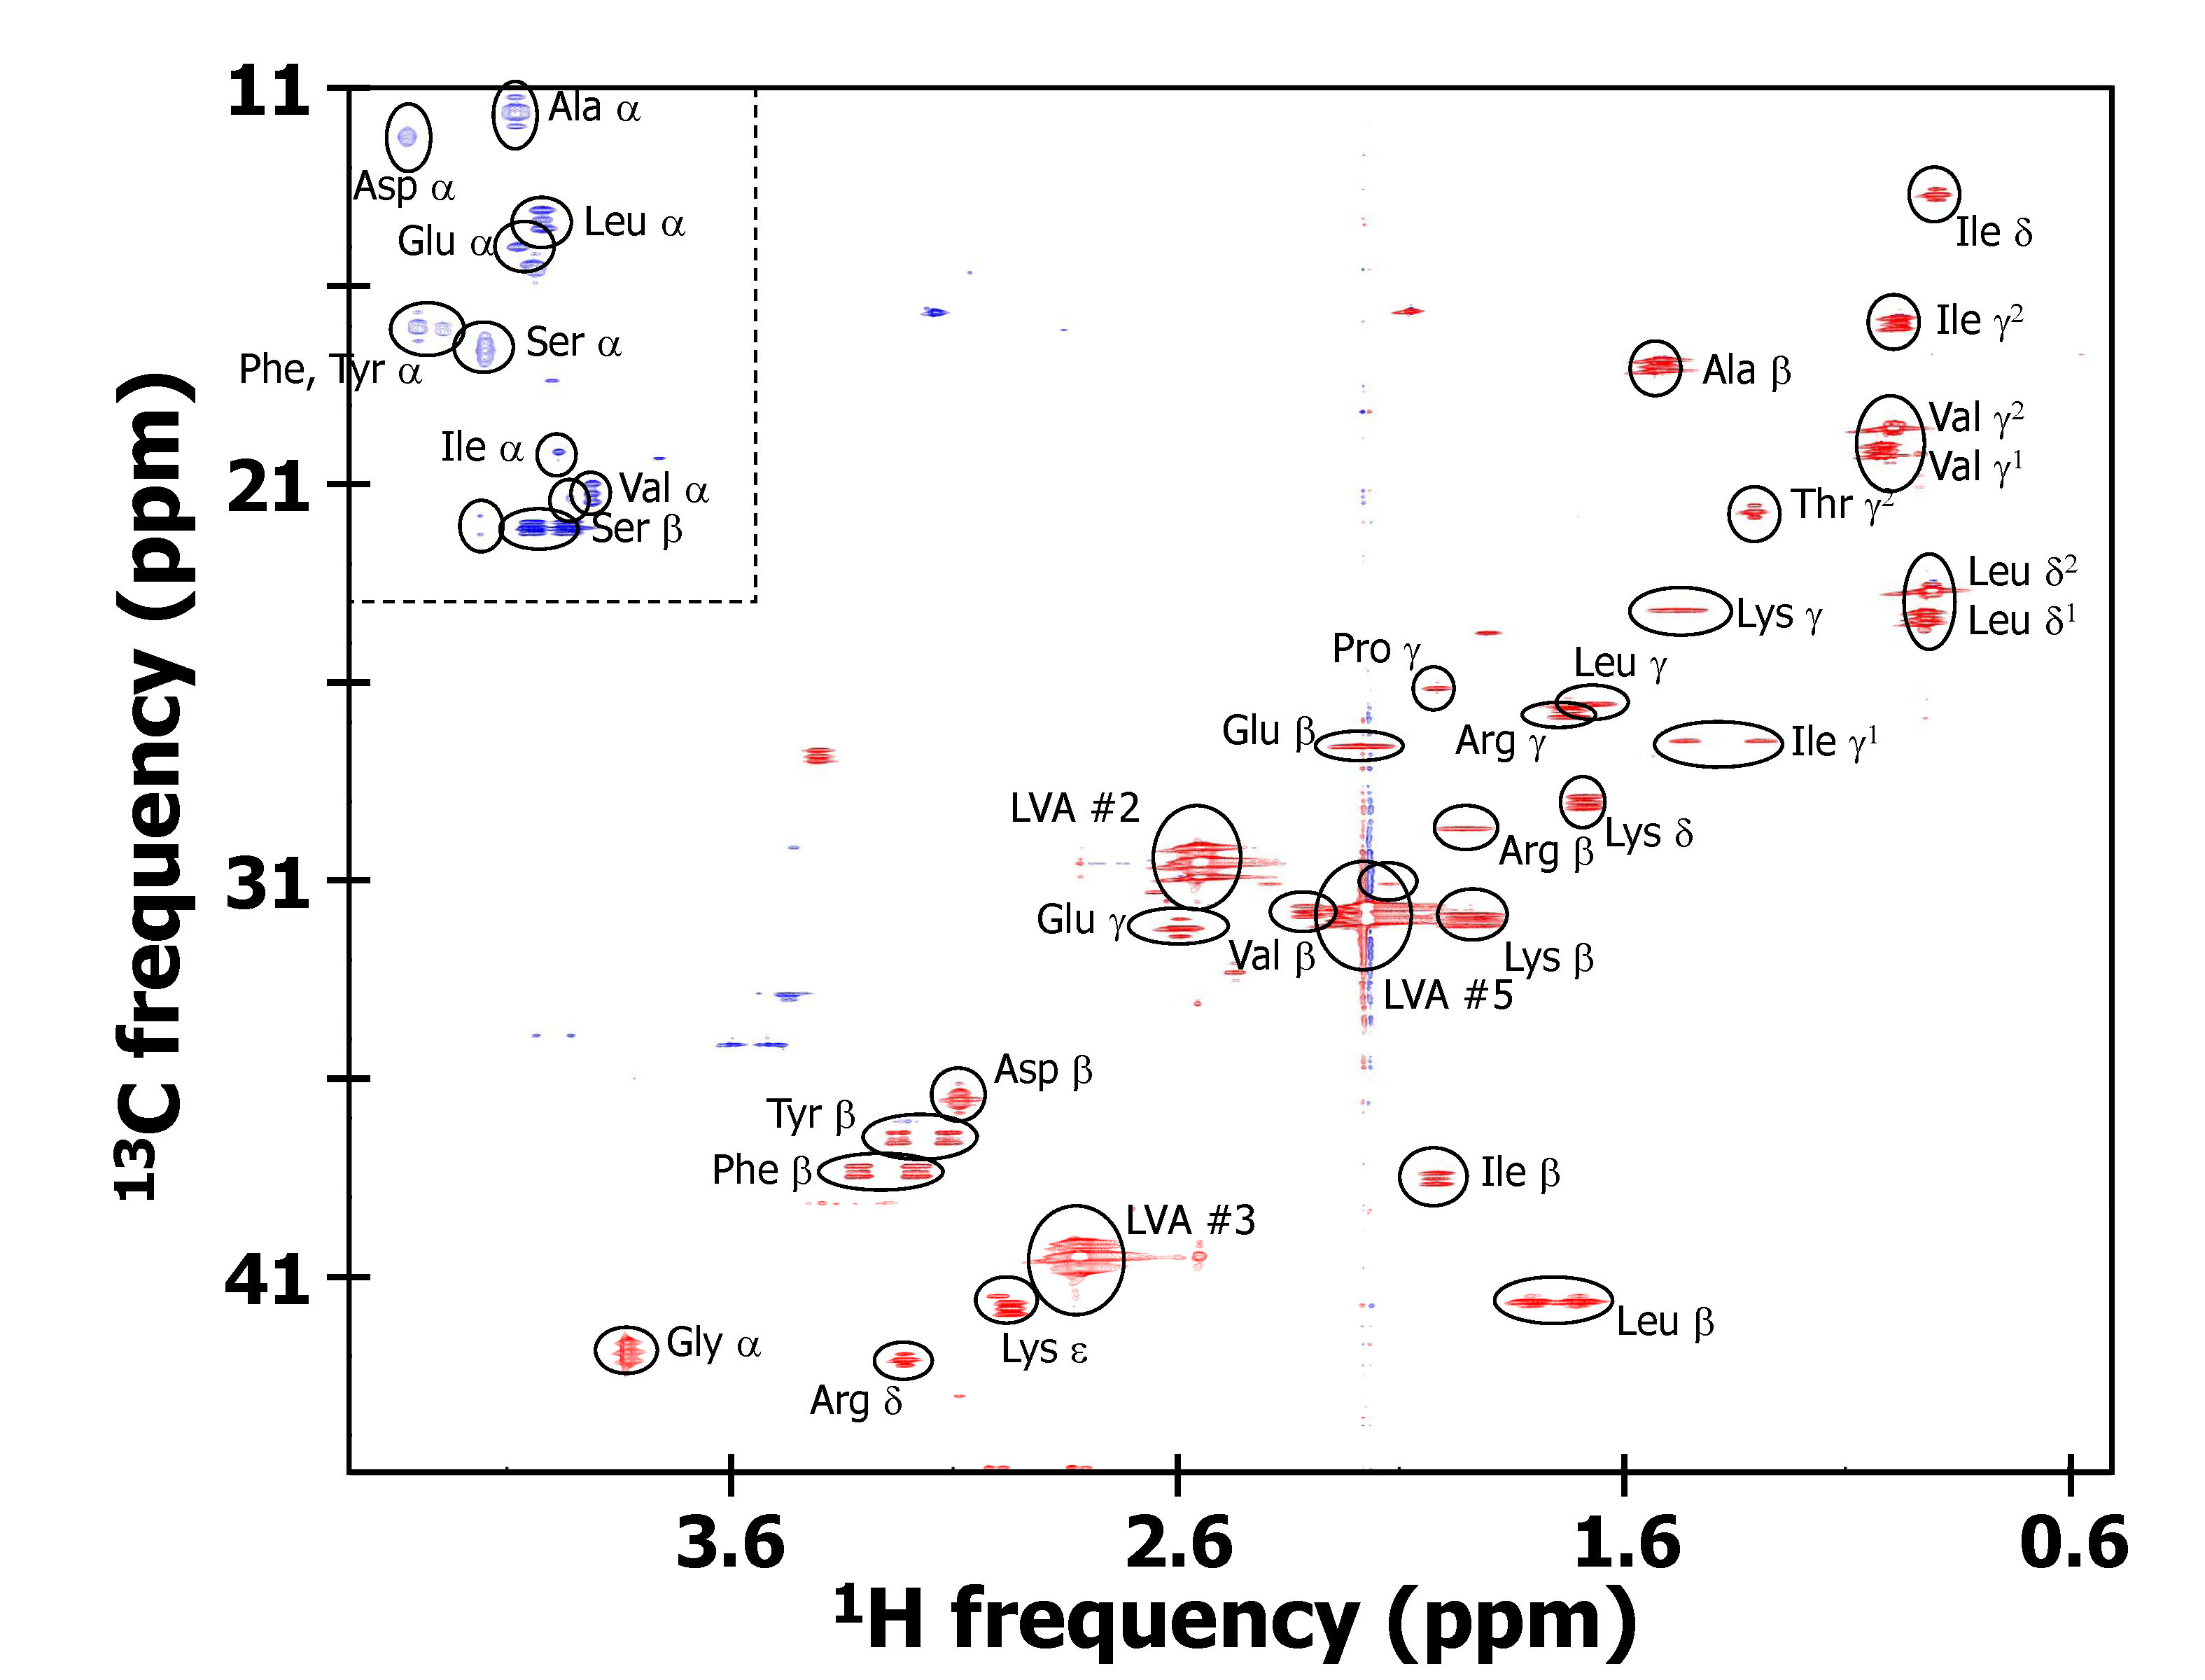
| 18:20, 9 August 2009 | Soybean 2D HSQC.jpg (file) |  |
491 KB | |
| 17:49, 9 August 2009 | H4IIE flux map (GK2 2 colors).jpg (file) | .jpg) |
259 KB | |
| 14:58, 9 August 2009 | Labeling expt Sriram.jpg (file) |  |
508 KB | Reverted to version as of 14:56, 9 August 2009 |
| 14:46, 9 August 2009 | Labeling expt Sriram.svg (file) |  |
206 KB | |
| 23:51, 8 August 2009 | Sriram Lab banner.svg (file) | 122 KB | Sriram Lab banner |
