Uploads by Elizabeth Ghias
From OpenWetWare
Jump to navigationJump to search
This special page shows all uploaded files.
| Date | Name | Thumbnail | Size | Description |
|---|---|---|---|---|
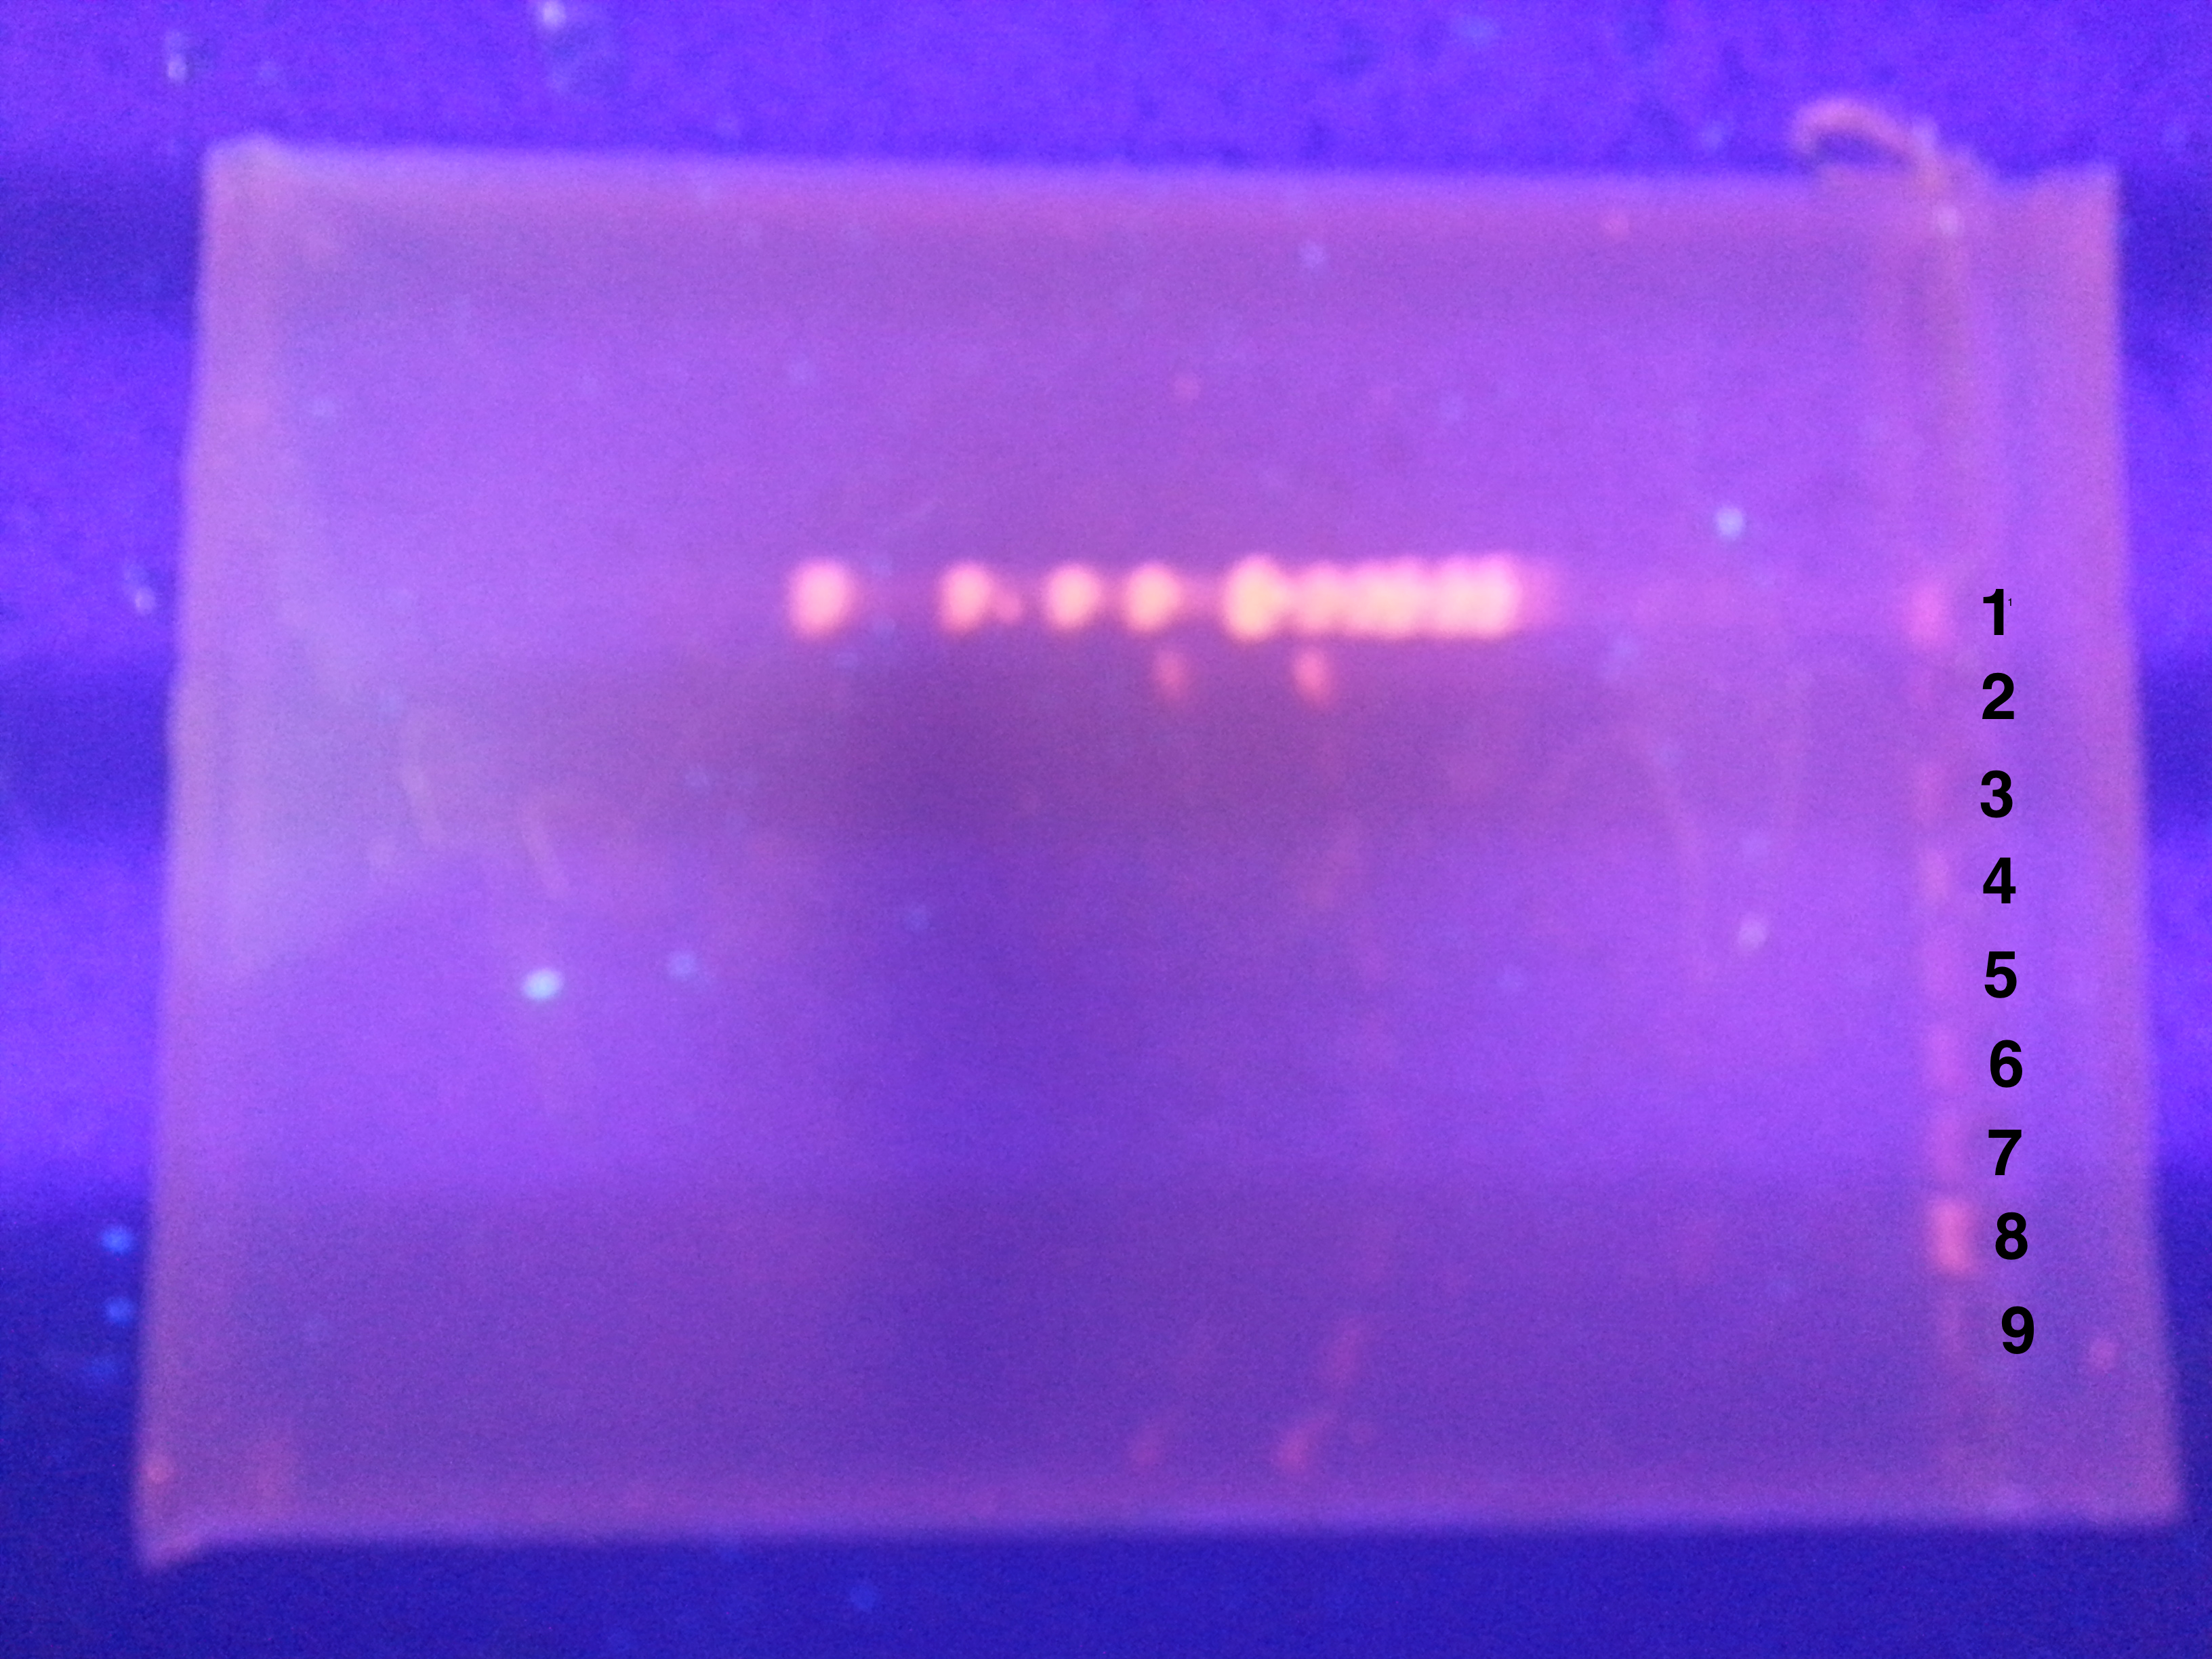
| 14:56, 3 May 2013 | Numbered gel KLN.png (file) |  |
9.81 MB | This figure shows the results of the gel electrophoresis used to test DNase I activity. 1) Ladder, 2) DNA alone 3) DNase I, 4) DNase I + 1 uL NHS Azide, 5) DNase I + 10 uL NHS Azide, 6) DNase I + 100 uL NHS Azide, 7) DNase I + 200 uL NHS Azide, 8) DNase |
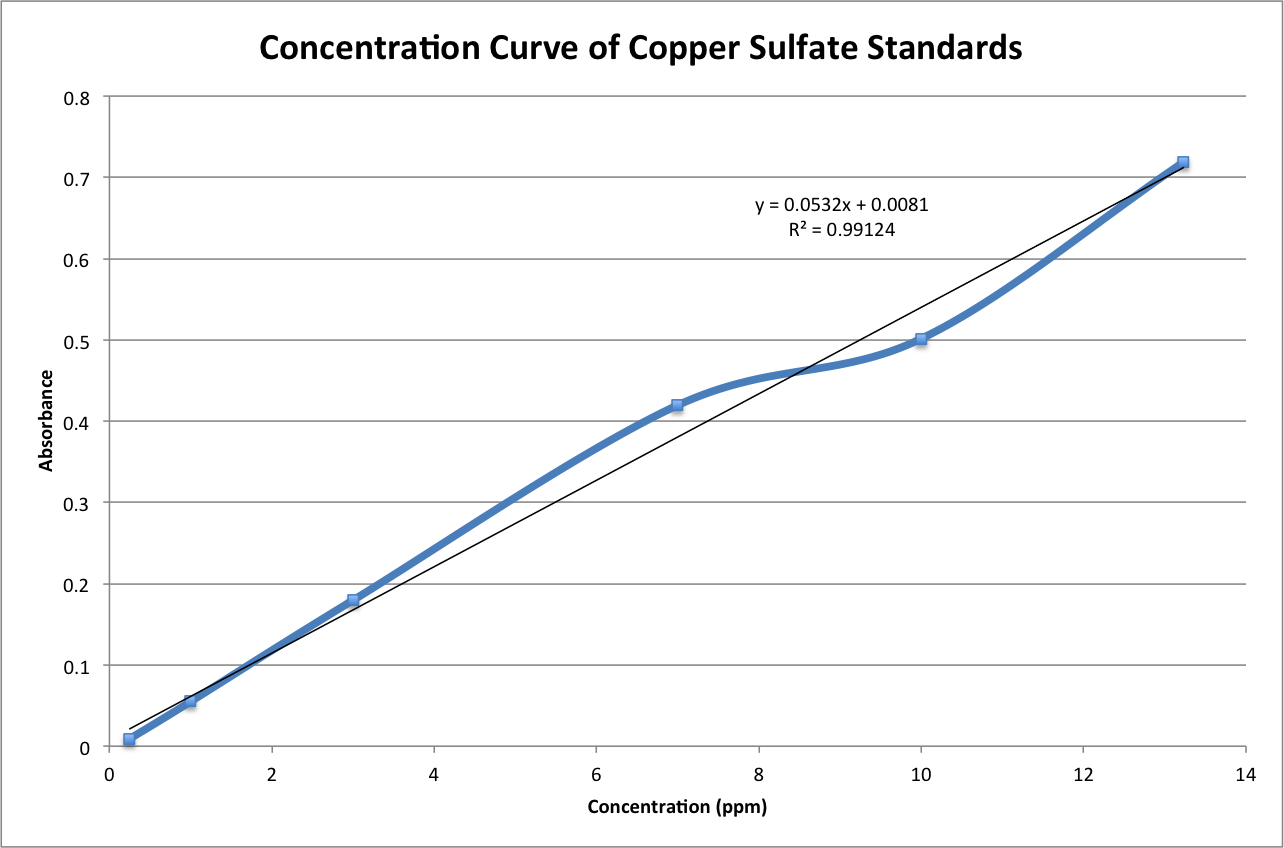
| 23:46, 4 December 2012 | Concentration Curve of CuSO4 Standards (AA).png (file) | .png) |
89 KB | This figure shows the concentration curve of Copper Sulfate standards that was prepared using AA. |
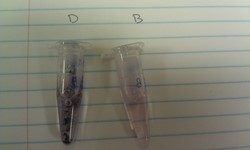
| 04:01, 9 December 2011 | Dec 6 Tubes B and D.jpg (file) |  |
31 KB | |
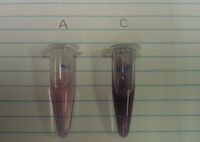
| 03:59, 9 December 2011 | Dec 6 Tubes A and C.jpg (file) |  |
6 KB | |
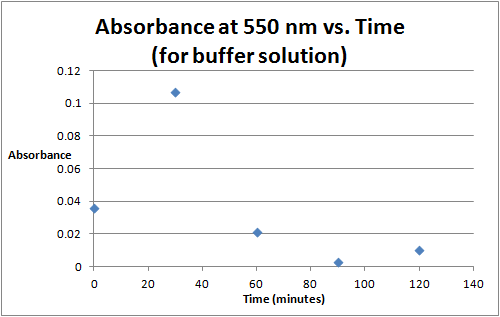
| 20:59, 3 December 2011 | Time vs. Absorbance at 550 Buffer Solution Sept 7.png (file) |  |
8 KB | |
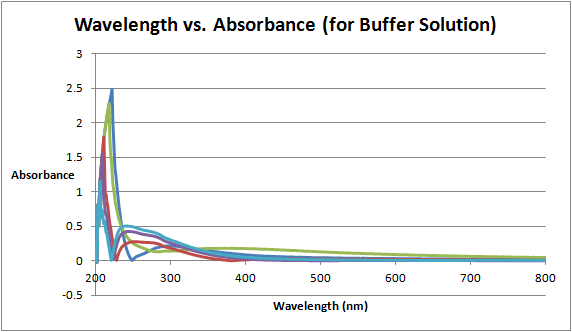
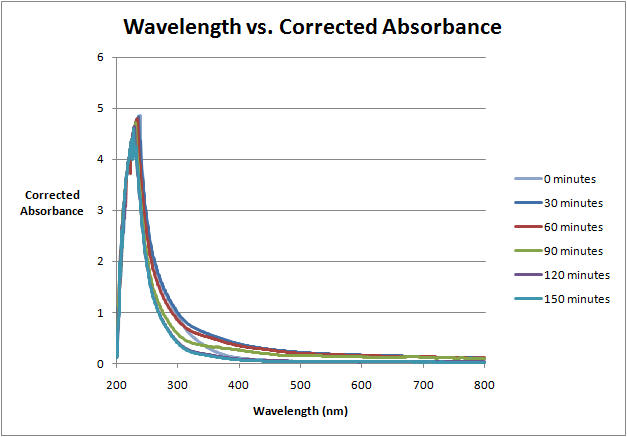
| 20:56, 3 December 2011 | Wavelength vs. Absorbance Buffer Solution Sept. 7.png (file) |  |
17 KB | |
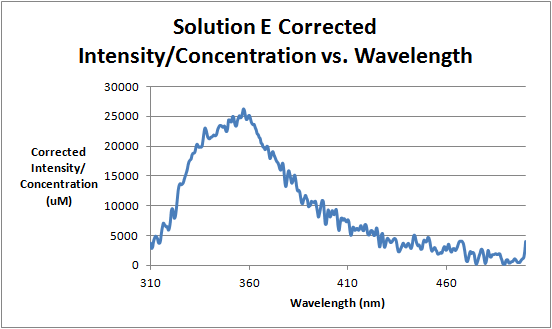
| 19:34, 19 October 2011 | Solution E Corrected Intensity Divided by Concentration vs. Wavelength.png (file) |  |
15 KB | This graph shows the relationship between the corrected intensity divided by the concentration for solution E vs. wavelength for the experiment that took place on October 5, 2011 |
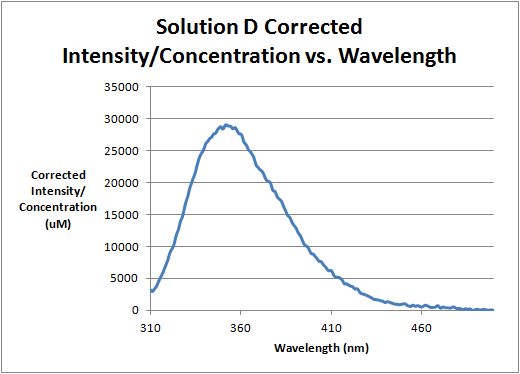
| 19:34, 19 October 2011 | Solution D Corrected Intensity Divided by Concentration vs. Wavelength.png (file) |  |
14 KB | This graph shows the relationship between the corrected intensity divided by the concentration for solution D vs. wavelength for the experiment that took place on October 5, 2011 |
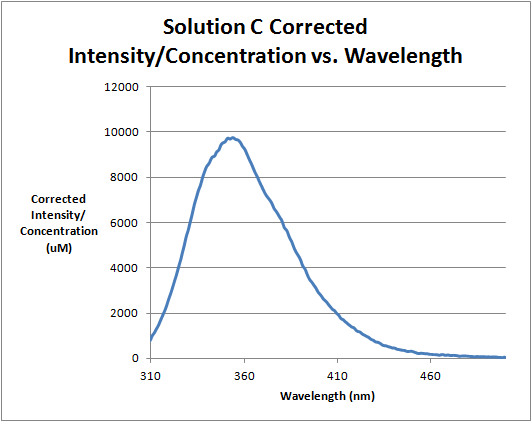
| 19:34, 19 October 2011 | Solution C Corrected Intensity Divided by Concentration vs. Wavelength.png (file) |  |
15 KB | This graph shows the relationship between the corrected intensity divided by the concentration for solution C vs. wavelength for the experiment that took place on October 5, 2011 |
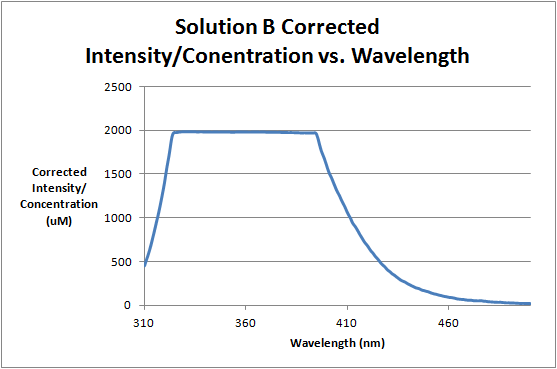
| 19:33, 19 October 2011 | Solution B Corrected Intensity Divided by Wavelength.png (file) |  |
13 KB | This graph shows the relationship between the corrected intensity divided by the concentration for solution B vs. wavelength for the experiment that took place on October 5, 2011 |
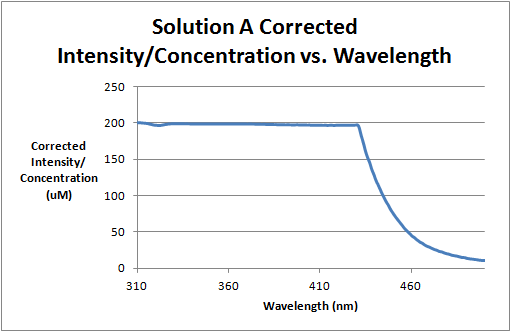
| 19:33, 19 October 2011 | Solution A Corrected Intensity Divided by Concentration vs. Wavelength.png (file) |  |
11 KB | This graph shows the relationship between the corrected intensity divided by the concentration for solution A vs. wavelength for the experiment that took place on October 5, 2011 |
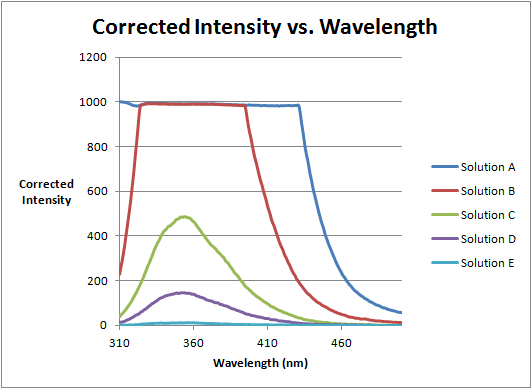
| 18:46, 19 October 2011 | October 5 Corrected Intensity of MBP vs. Wavelength.png (file) |  |
20 KB | This graph shows the relationship between the corrected intensity and the wavelength for solutions A - E. |
| 17:39, 19 October 2011 | October 14 Molar Absorptivity of MBP vs. Wavelength.png (file) |  |
13 KB | |
| 02:51, 11 October 2011 | October 5 Integrated Intensities vs. concentration.png (file) |  |
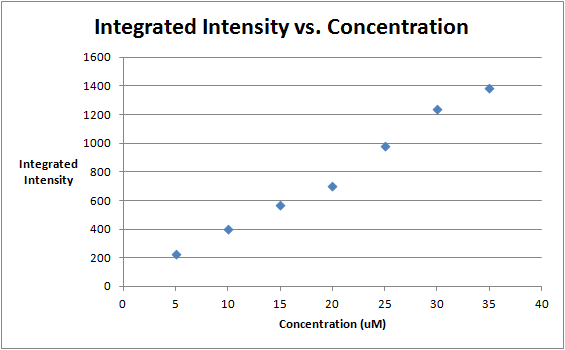
9 KB | This graph shows the relationship between the integrated intensity and the concentration of the Ru(bpy)(phen) standards. |
| 01:53, 11 October 2011 | October 4 Ru(bpy)(phen) standard intensities.png (file) | (phen)_standard_intensities.png) |
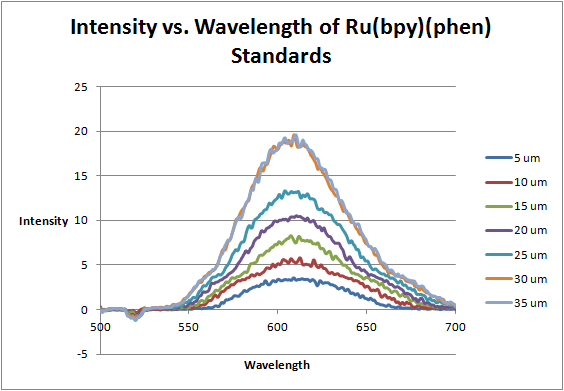
28 KB | This graph shows the intensities of the Ru(bpy)(phen) standards that were excited at 450 nm. |
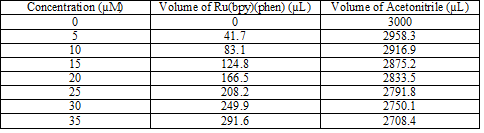
| 01:18, 11 October 2011 | October 4 Ru(bpy)(Phen) concentrations.png (file) | 6 KB | This table shows the different volumes of Ru(bpy)(phen) and acetonitrile that were used as standards to determine the sensitivity of a fluorimeter. | |
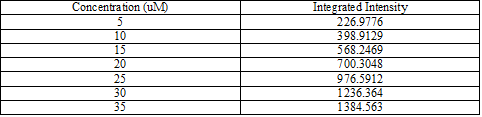
| 19:18, 5 October 2011 | October 5 Integrated Intensities.png (file) | 6 KB | This table shows the integrated intensities that were calculated for each of the concentrations of Ru(bpy)(phen) (0 μM to 35 μM) | |
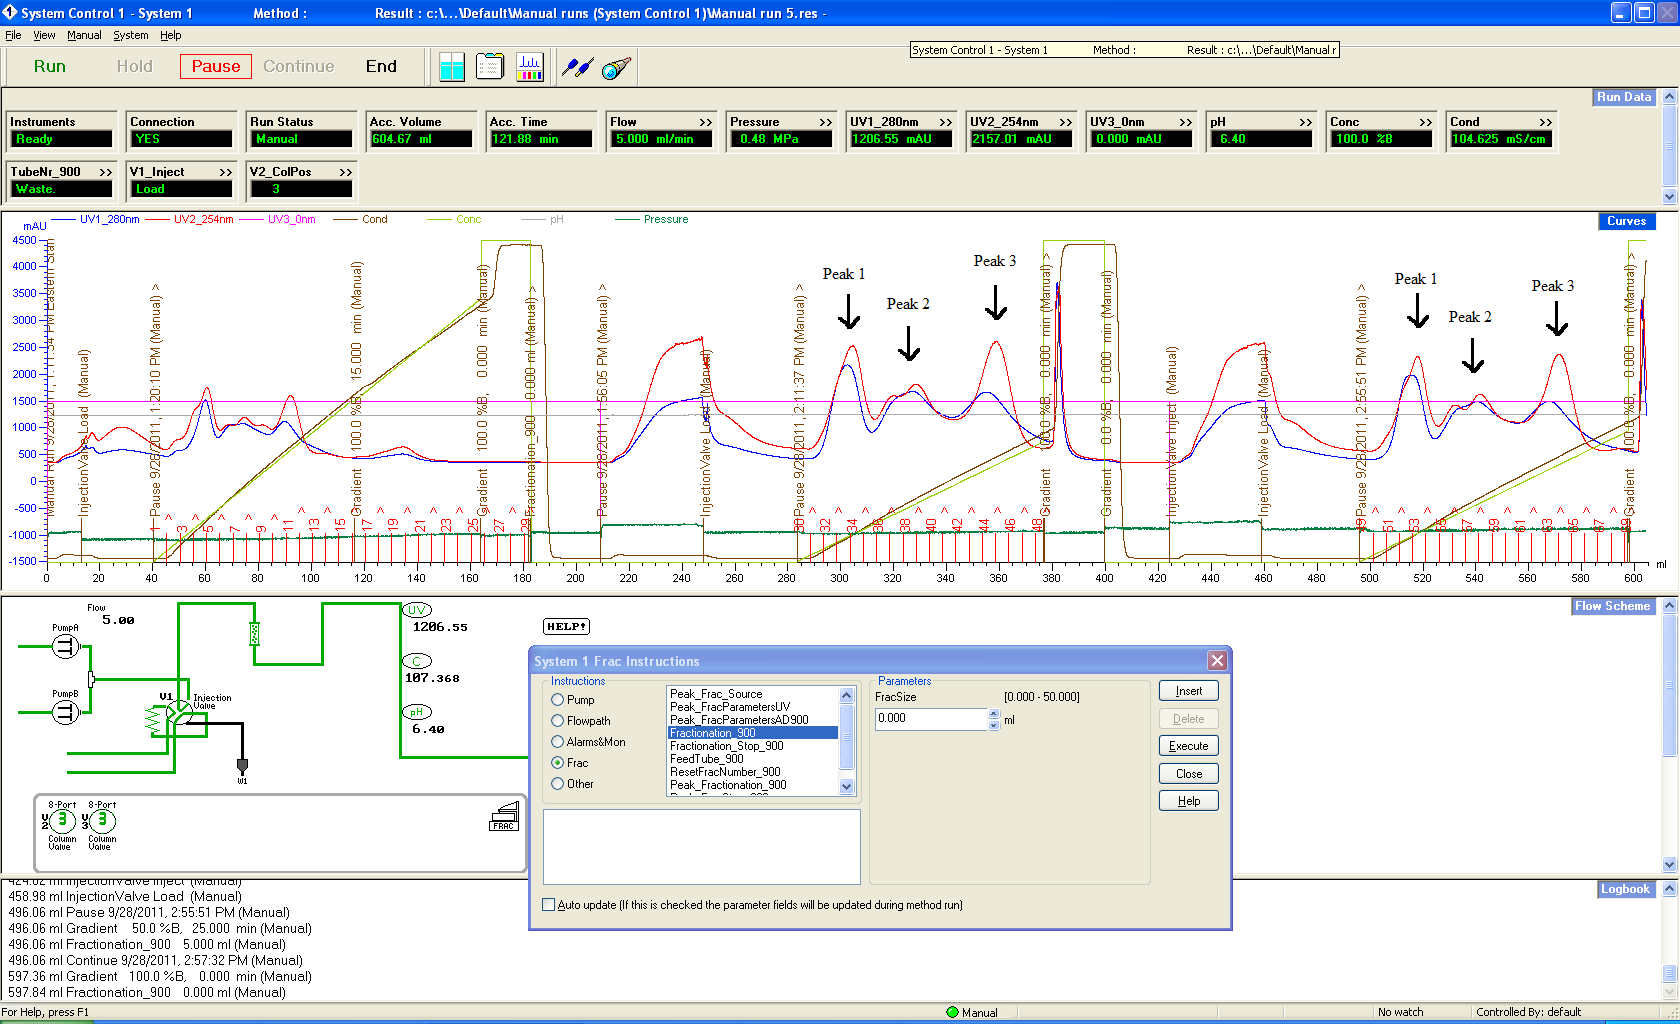
| 16:08, 4 October 2011 | Sept 28 FLPC.png (file) |  |
125 KB | This is a copy of the UV and conductivity spectrum taken on September 28th when FPLC was used to purify the protein extracted from cells the previous day |
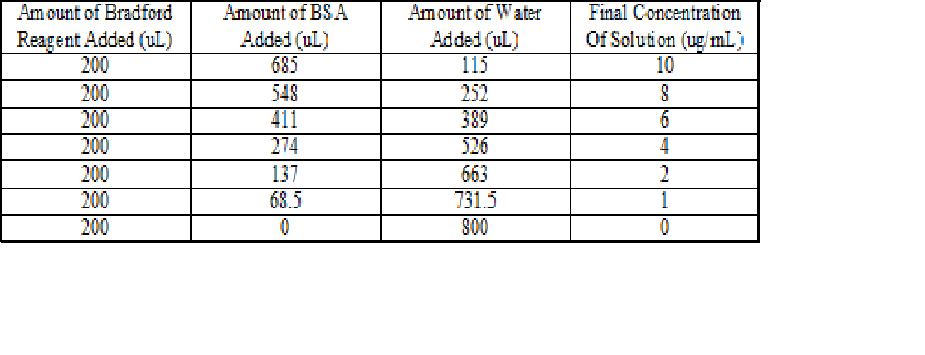
| 20:16, 19 September 2011 | Sept 14 Table of Concentrations.png (file) |  |
18 KB | This table shows the concentrations of Bradford reagent, water, and BSA that were added to give each concentration |
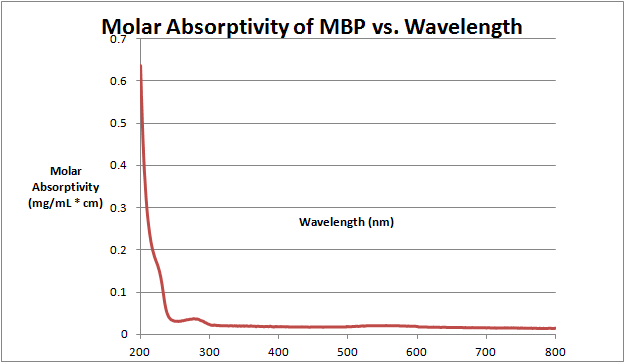
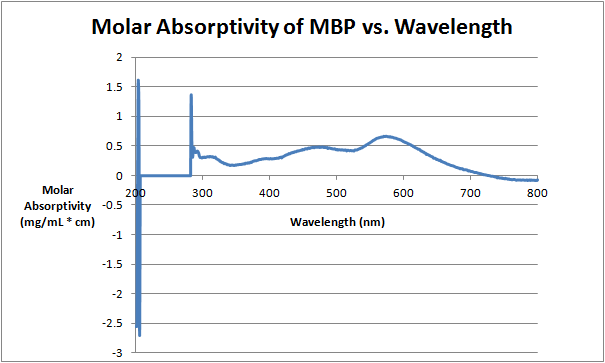
| 20:02, 19 September 2011 | Molar Absorptivity of MBP vs. Wavelength Sept 14.png (file) |  |
13 KB | This graph shows the relationship between the Molar Absorptivity of MBP and the Wavelength used in UV-vis. The molar absorptivities graphed were calculated from absorbance and concentration of the MBP sample used in the experiment. |
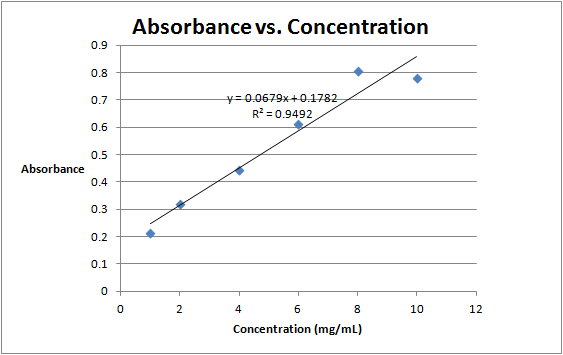
| 19:58, 19 September 2011 | Absorbance vs. Concentration September 14.png (file) |  |
12 KB | This graph shows the relationship between the absorbance and concentration of the protein samples analyzed on September 14 |
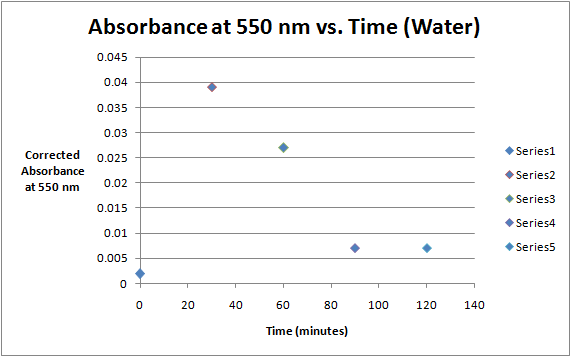
| 01:36, 13 September 2011 | Time vs. Absorbance at 550 Water Sept 7.png (file) |  |
12 KB | This graph shows the relationship between the absorbance at 550 nm and the time of the reaction for the reaction containing water. |
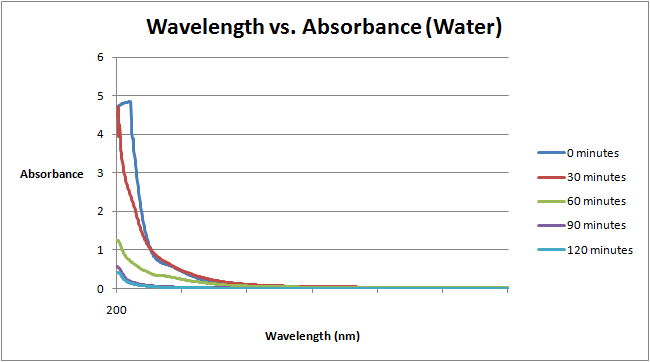
| 01:34, 13 September 2011 | Wavelength vs. Absorbance Water Sept 7.png (file) |  |
13 KB | This graph shows the relationship between the absorbance at 550 nm and the time of the reaction for the reaction mixture containing water. |
| 01:57, 6 September 2011 | Time vs. Absorbance at 550 Aug 31.png (file) |  |
11 KB | |
| 01:56, 6 September 2011 | Wavelength vs. Absorbance Aug 31.png (file) |  |
20 KB | This graph shows the relationship between the wavelength and absorbance of the reaction that took place on August 31 |
| 01:38, 6 September 2011 | Time vs. Absorbance at 550 Sept 5.png (file) |  |
11 KB | This graph shows the relationship between the time and the absorbance at 550 nm of the reaction that took place on September 5th |

(Phen)_concentrations.png)