Significance levels
| back to stats portal |
The significance level is the criterion used for rejecting the null hypothesis.
Use as follows:
- determine the difference between the results of the experiment and the null hypothesis
- compare the probability of the null hypothesis to the significance level
If the probability is less than or equal to the significance level, then the null hypothesis is rejected and the outcome is said to be statistically significant.
Traditionally, researchers have used either the 0.05 level (5% level) or the 0.01 level (1% level), although the choice is largely subjective. The lower the significance level, the more conservative the statistical analysis and the more the data must diverge from the null hypothesis to be significant.
Star shorthand for significance levels
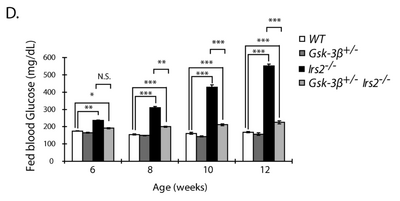
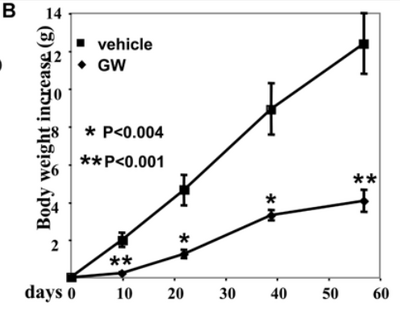
In publications significance levels are often indicated with stars. However, there is no consistent convention linking a certain number of stars to a significance level (see examples below). Publications should indicate their own definitions of asterisks and error bars in the text but sometimes omit to do so.
Due to this weakness many researchers dislike[1] the use of stars to indicate significance and prefer a numerical value instead. Bottom line: it's more informative to state A vs. B at p<0.027 than to use one of the many the asterisk systems A vs. B ** (according to below).
| star code | significance | comment |
|---|---|---|
| *** | 0.01 | high significance |
| ** | 0.05 | medium significance |
| * | 0.10 | low significance |


See also
- OpenWetWare Statistics homepage
- Representing data numerically
