Ryan N. Willhite Week 13
Work Day
GenMAPP Program Assignment
- Launch the GenMAPP Program. Check to make sure the correct Gene Database is loaded.
- Select the Data menu from the main Drafting Board window and choose Expression Dataset Manager from the drop-down list. The Expression Dataset Manager window will open.
- Select New Dataset from the Expression Datasets menu. Select the tab-delimited text file that you formatted for GenMAPP (.txt) in the procedure above from the file dialog box that appears.
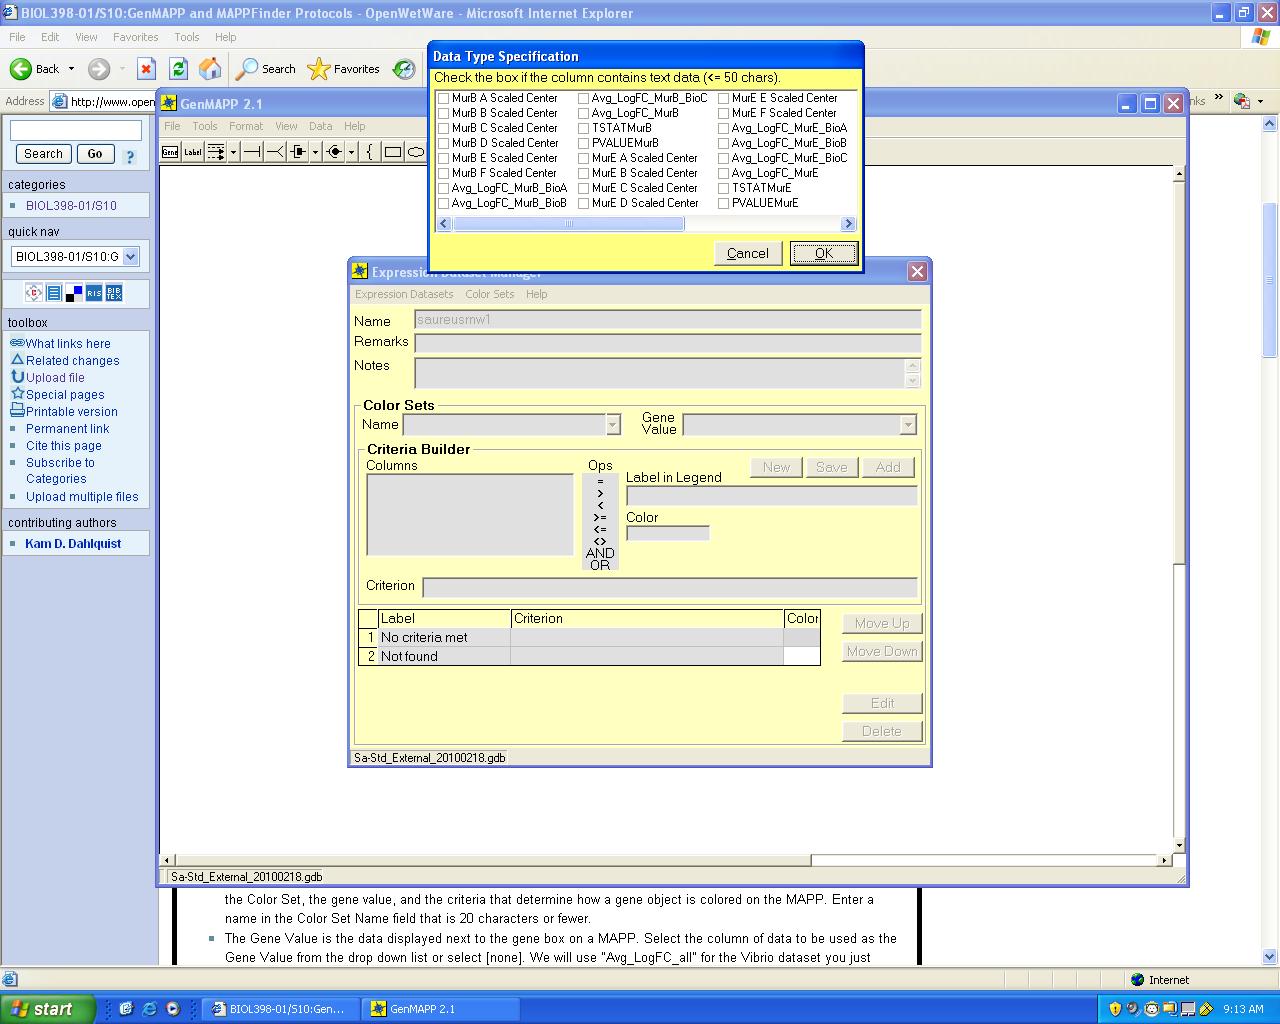
- The Data Type Specification window will appear. GenMAPP is expecting that you are providing numerical data. If any of your columns has text (character) data, check the box next to the field (column) name.
- The Vibrio data we have been working with does not have any text (character) data in it.
- Allow the Expression Dataset Manager to convert your data.
- This may take a few minutes depending on the size of the dataset and the computer’s memory and processor speed. When the process is complete, the converted dataset will be active in the Expression Dataset Manager window and the file will be saved in the same folder the raw data file was in, named the same except with a .gex extension; for example, MyExperiment.gex.
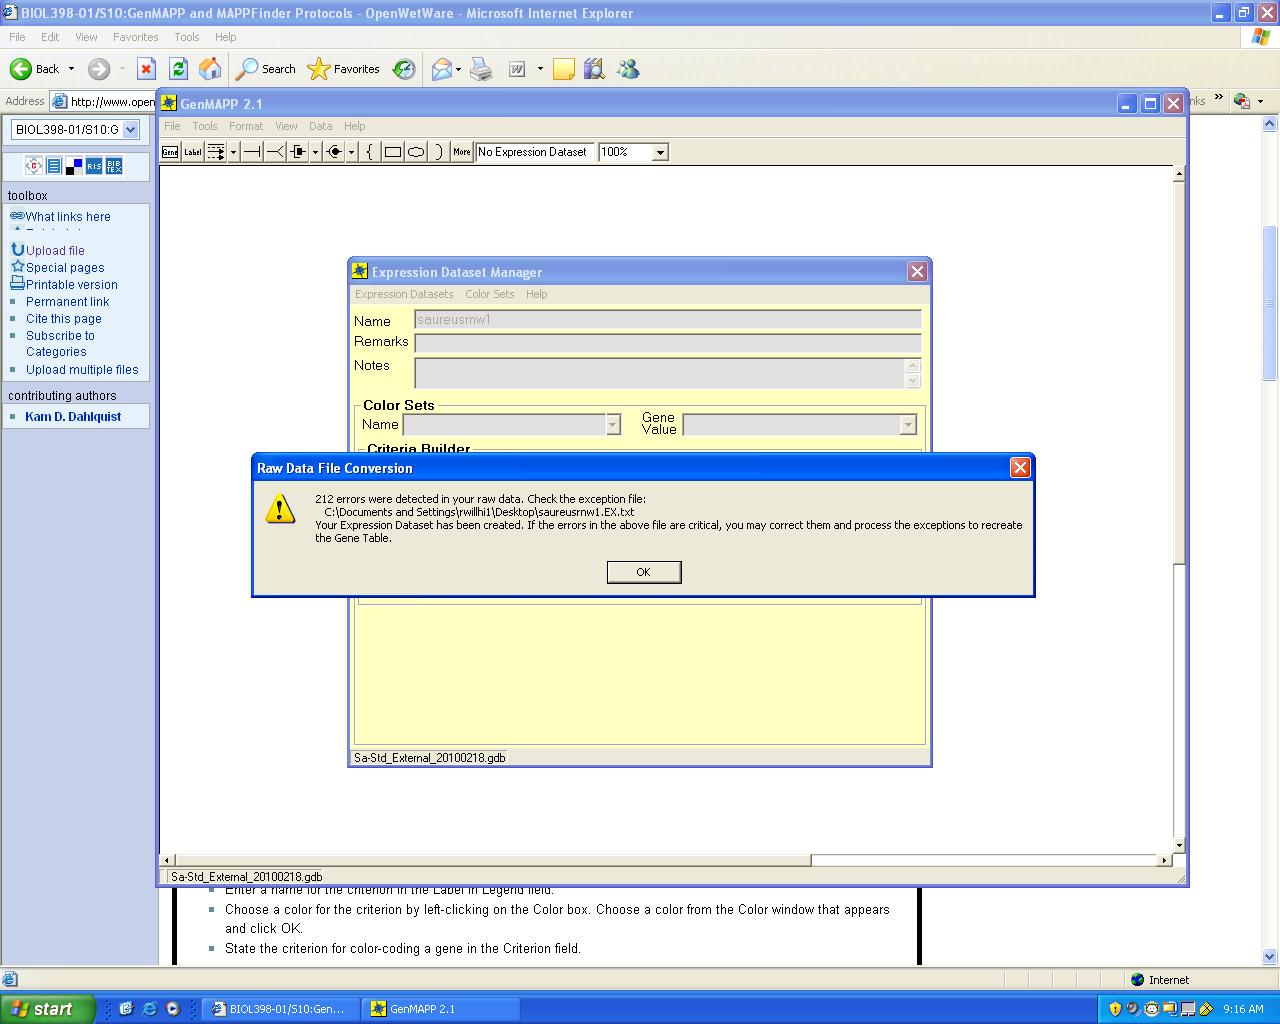
- A message may appear saying that the Expression Dataset Manager could not convert one or more lines of data. Lines that generate an error during the conversion of a raw data file are not added to the Expression Dataset. Instead, an exception file is created. The exception file is given the same name as your raw data file with .EX before the extension (e.g., MyExperiment.EX.txt). The exception file will contain all of your raw data, with the addition of a column named ~Error~. This column contains either error messages or, if the program finds no errors, a single space character.
- Record the number of errors. For your journal assignment, open the .EX.txt file and use the Data > Filter > Autofilter function to determine what the errors were for the rows that were not converted. Record this information in your individual journal page.
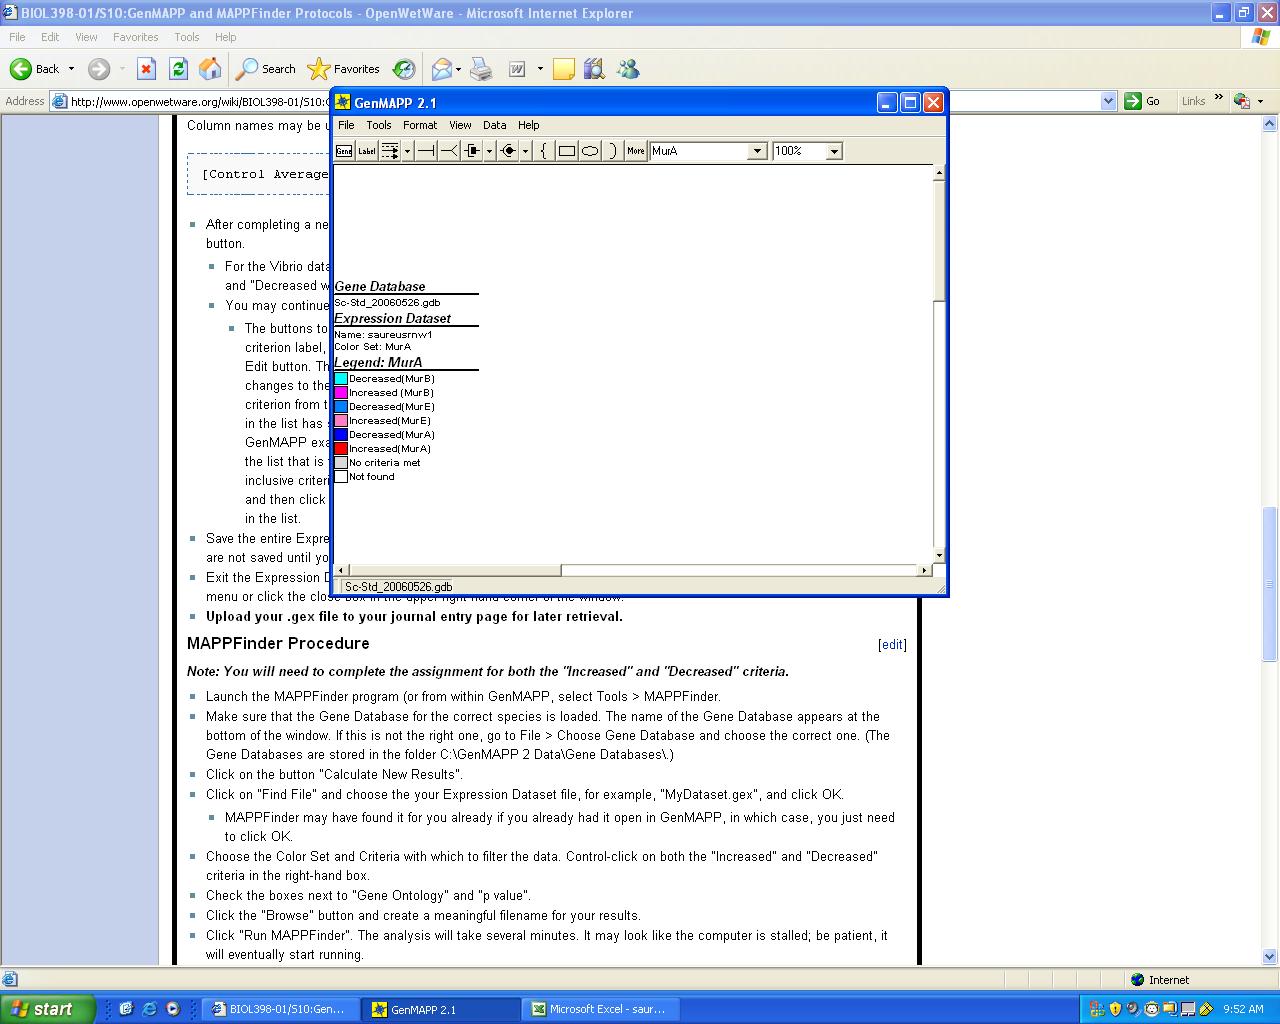
- Customize the new Expression Dataset by creating new Color Sets which contain the instructions to GenMAPP for displaying data on MAPPs.
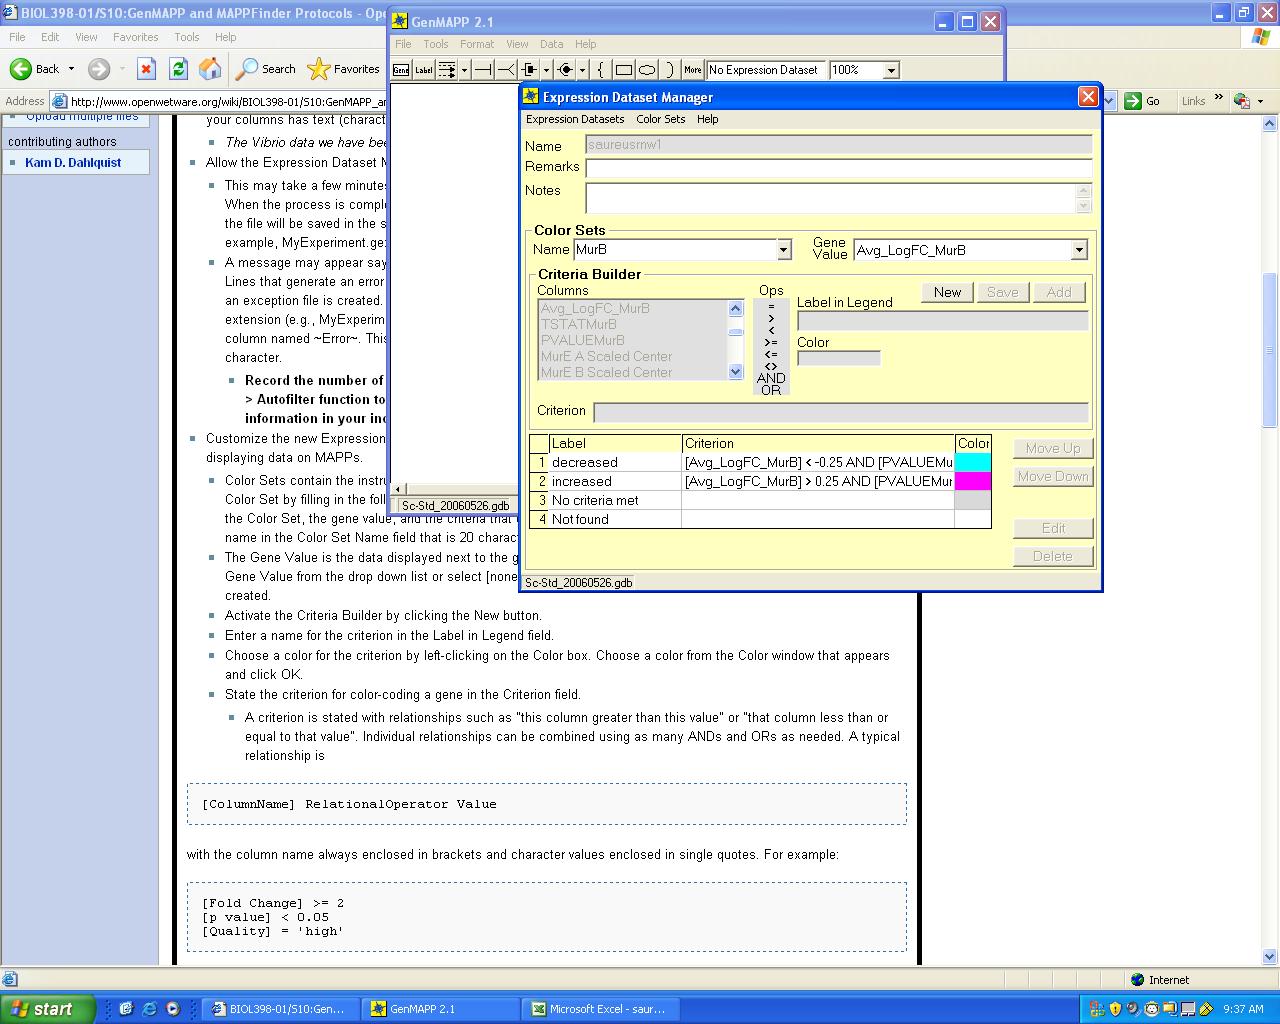
- Color Sets contain the instructions to GenMAPP for displaying data from an Expression Dataset on MAPPs. Create a Color Set by filling in the following different fields in the Color Set area of the Expression Dataset Manager: a name for the Color Set, the gene value, and the criteria that determine how a gene object is colored on the MAPP. Enter a name in the Color Set Name field that is 20 characters or fewer.
- The Gene Value is the data displayed next to the gene box on a MAPP. Select the column of data to be used as the Gene Value from the drop down list or select [none]. We will use "Avg_LogFC_all" for the Vibrio dataset you just created.
- Activate the Criteria Builder by clicking the New button.
- Enter a name for the criterion in the Label in Legend field.
- Choose a color for the criterion by left-clicking on the Color box. Choose a color from the Color window that appears and click OK.
- State the criterion for color-coding a gene in the Criterion field.
- A criterion is stated with relationships such as "this column greater than this value" or "that column less than or equal to that value". Individual relationships can be combined using as many ANDs and ORs as needed. A typical relationship is
[ColumnName] RelationalOperator Value
with the column name always enclosed in brackets and character values enclosed in single quotes. For example:
[Fold Change] >= 2
[p value] < 0.05
[Quality] = 'high'
This is the equivalent to queries that you performed on the command line when working with the PostgreSQL movie database. GenMAPP is using a graphical user interface (GUI) to help the user format the queries correctly. The easiest and safest way to create criteria is by choosing items from the Columns and Ops (operators) lists shown in the Criteria Builder. The Columns list contains all of the column headings from your Expression Dataset. To choose a column from the list, click on the column heading. It will appear at the location of the cursor in the Criterion box. The Criteria Builder surrounds the column names with brackets.
The Ops (operators) list contains the relational operators that may be used in the criteria: equals ( = ) greater than ( > ), less than ( < ), greater than or equal to ( >= ), less than or equal to ( <= ), is not equal to ( <> ). To choose an operator from the list, click on the symbol. It will appear at the location of the insertion bar (cursor) in the Criterion box. The Criteria Builder automatically surrounds the operators with spaces. The Ops list also contains the conjunctions AND and OR, which may be used to make compound criteria. For example:
[Fold Change] > 1.2 AND [p value] <= 0.05
Parentheses control the order of evaluation. Anything in parentheses is evaluated first. Parentheses may be nested. For example:
[Control Average] = 100 AND ([Exp1 Average] > 100 OR [Exp2 Average] > 100)
Column names may be used anywhere a value can, for example:
[Control Average] < [Experiment Average]
- After completing a new criterion, add the criterion entry (label, criterion, and color) to the Criteria List by clicking the Add button.
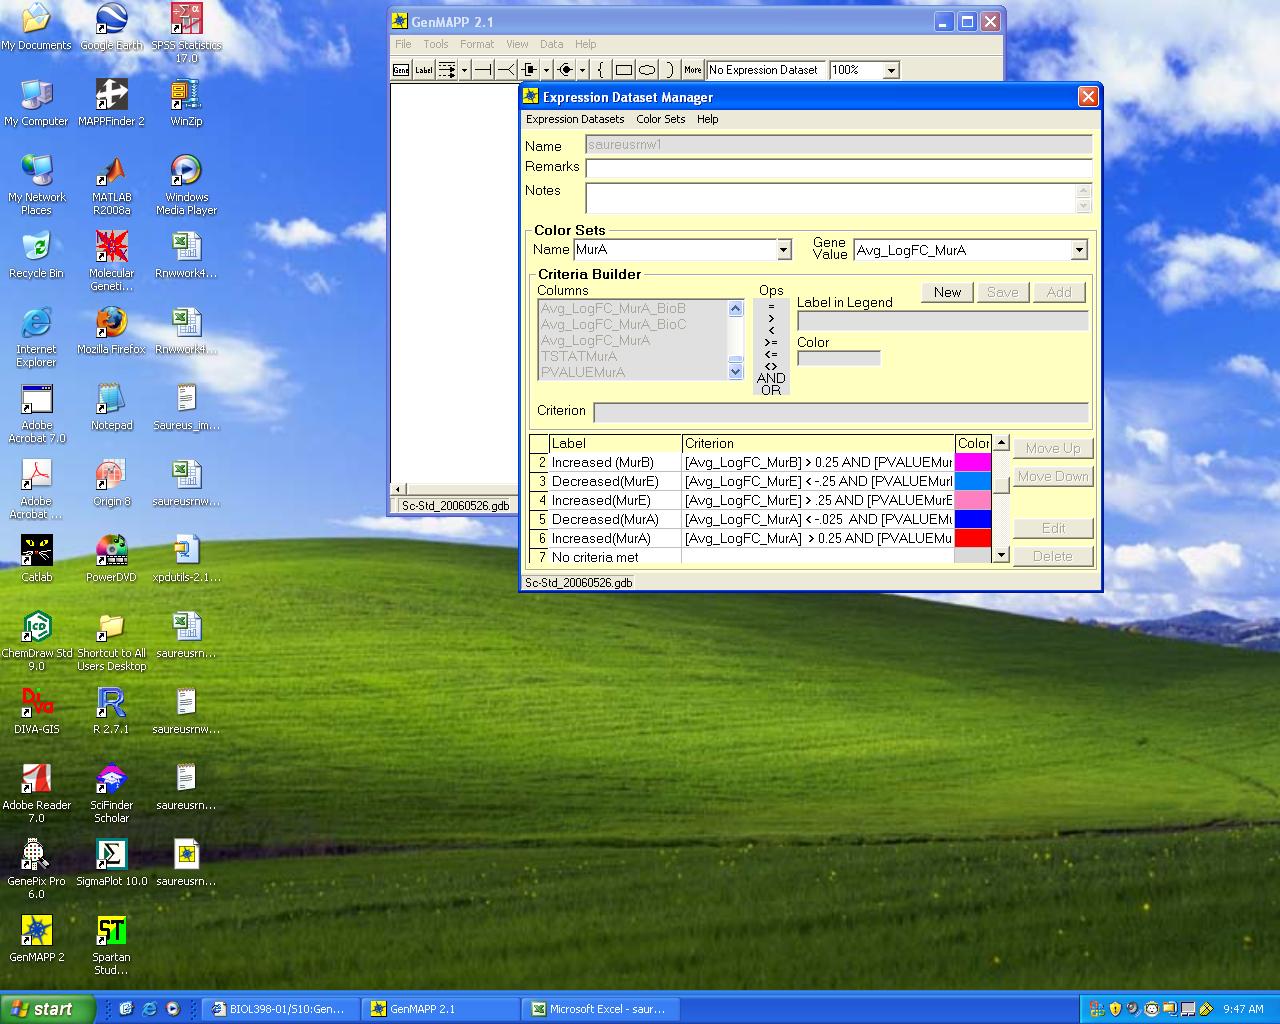
- For the Vibrio dataset, you will create two criterion. "Increased" will be [Avg_LogFC_all] > 0.25 AND [Pvalue] < 0.05 and "Decreased will be [Avg_LogFC_all] < -0.25 AND [Pvalue] < 0.05.
- You may continue to add criteria to the Color Set by using the previous steps.
- The buttons to the right of the list represent actions that can be performed on individual criteria. To modify a criterion label, color, or the criterion itself, first select the criterion in the list by left-clicking on it, and then click the Edit button. This puts the selected criterion into the Criteria Builder to be modified. Click the Save button to save changes to the modified criterion; click the Add button to add it to the list as a separate criterion. To remove a criterion from the list, left-click on the criterion to select it, and then click on the Delete button. The order of Criteria in the list has significance to GenMAPP. When applying an Expression Dataset and Color Set to a MAPP, GenMAPP examines the expression data for a particular gene object and applies the color for the first criterion in the list that is true. Therefore, it is imperative that when criteria overlap the user put the most important or least inclusive criteria in the list first. To change the order of the criteria in the list, left-click on the criterion to select it and then click the Move Up or Move Down buttons. No criteria met and Not found are always the last two positions in the list.
- Save the entire Expression Dataset by selecting Save from the Expression Dataset menu. Changes made to a Color Set are not saved until you do this.
- Exit the Expression Dataset Manager to view the Color Sets on a MAPP. Choose Exit from the Expression Dataset menu or click the close box in the upper right hand corner of the window.
- Upload your .gex file to your journal entry page for later retrieval.
MAPPFinder Procedure
Note: You will need to complete the assignment for both the "Increased" and "Decreased" criteria.
- Launch the MAPPFinder program (or from within GenMAPP, select Tools > MAPPFinder.
- Make sure that the Gene Database for the correct species is loaded. The name of the Gene Database appears at the bottom of the window. If this is not the right one, go to File > Choose Gene Database and choose the correct one. (The Gene Databases are stored in the folder C:\GenMAPP 2 Data\Gene Databases\.)
- Click on the button "Calculate New Results".
- Click on "Find File" and choose the your Expression Dataset file, for example, "MyDataset.gex", and click OK.
- MAPPFinder may have found it for you already if you already had it open in GenMAPP, in which case, you just need to click OK.
- Choose the Color Set and Criteria with which to filter the data. Control-click on both the "Increased" and "Decreased" criteria in the right-hand box.
- Check the boxes next to "Gene Ontology" and "p value".
- Click the "Browse" button and create a meaningful filename for your results.
- Click "Run MAPPFinder". The analysis will take several minutes. It may look like the computer is stalled; be patient, it will eventually start running.
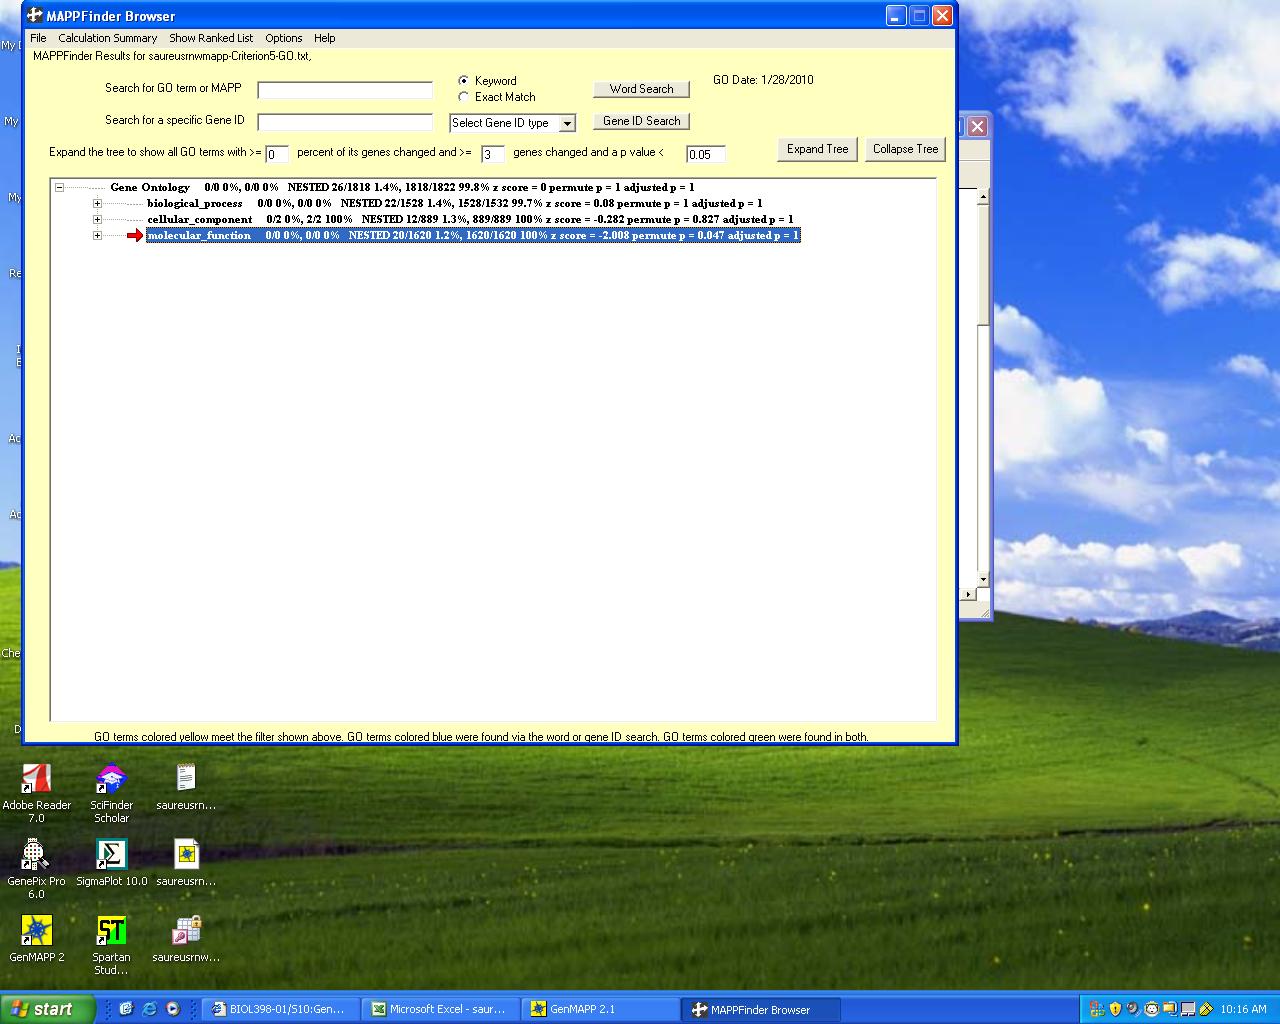
- When the results have been calculated, a Gene Ontology browser will open showing your results. All of the Gene Ontology terms that have at least 3 genes measured and a p value of less than 0.05 will be highlighted yellow. A term with a p value less than 0.05 is considered a "significant" result. Browse through the tree to see your results.
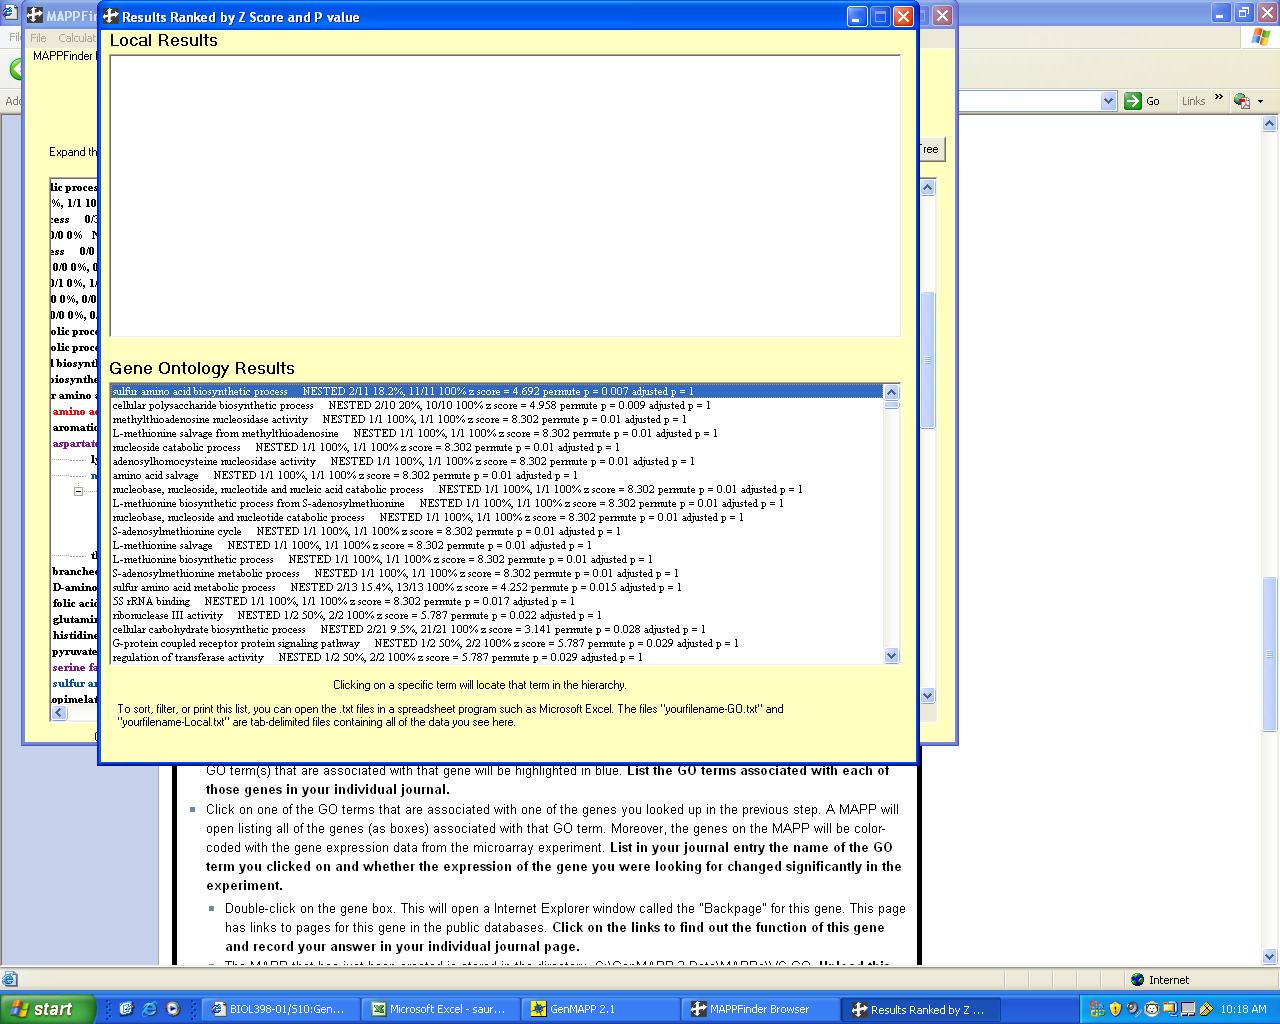
- To see a list of the most significant Gene Ontology terms, click on the menu item "Show Ranked List".
- List the top 10 Gene Ontology terms in your individual journal entry.
- One of the things you can do in MAPPFinder is to find the Gene Ontology term(s) with which a particular gene is associated. First, in the main MAPPFinder Browser window, click on the button "Collapse the Tree". Then, you can search for the genes that were mentioned by Merrell et al. (2002), VC0028, VC0941, VC0869, VC0051, VC0647, VC0468, VC2350, and VCA0583. Type the identifier for one of these genes into the MAPPFinder browser gene ID search field. The GO term(s) that are associated with that gene will be highlighted in blue. List the GO terms associated with each of those genes in your individual journal.
- Click on one of the GO terms that are associated with one of the genes you looked up in the previous step. A MAPP will open listing all of the genes (as boxes) associated with that GO term. Moreover, the genes on the MAPP will be color-coded with the gene expression data from the microarray experiment. List in your journal entry the name of the GO term you clicked on and whether the expression of the gene you were looking for changed significantly in the experiment.
- Double-click on the gene box. This will open a Internet Explorer window called the "Backpage" for this gene. This page has links to pages for this gene in the public databases. Click on the links to find out the function of this gene and record your answer in your individual journal page.
- The MAPP that has just been created is stored in the directory, C:\GenMAPP 2 Data\MAPPs\VC GO. Upload this file and link to it in your journal.
- In Windows, make a copy of your results (XXX-CriterionX-GO.txt) file.
- "XXX" refers to the name you gave to your results file.
- "CriterionX" refers to either "Criterion0" or "Criterion1". Since computers start counting at zero, "Criterion0" is the first criterion in the list you clicked on ("Increased" if you followed the directions) and "Criterion1" is the second criterion in the list you clicked on ("Decreased" if you followed the directions).
- Upload both of your results files to your journal page.
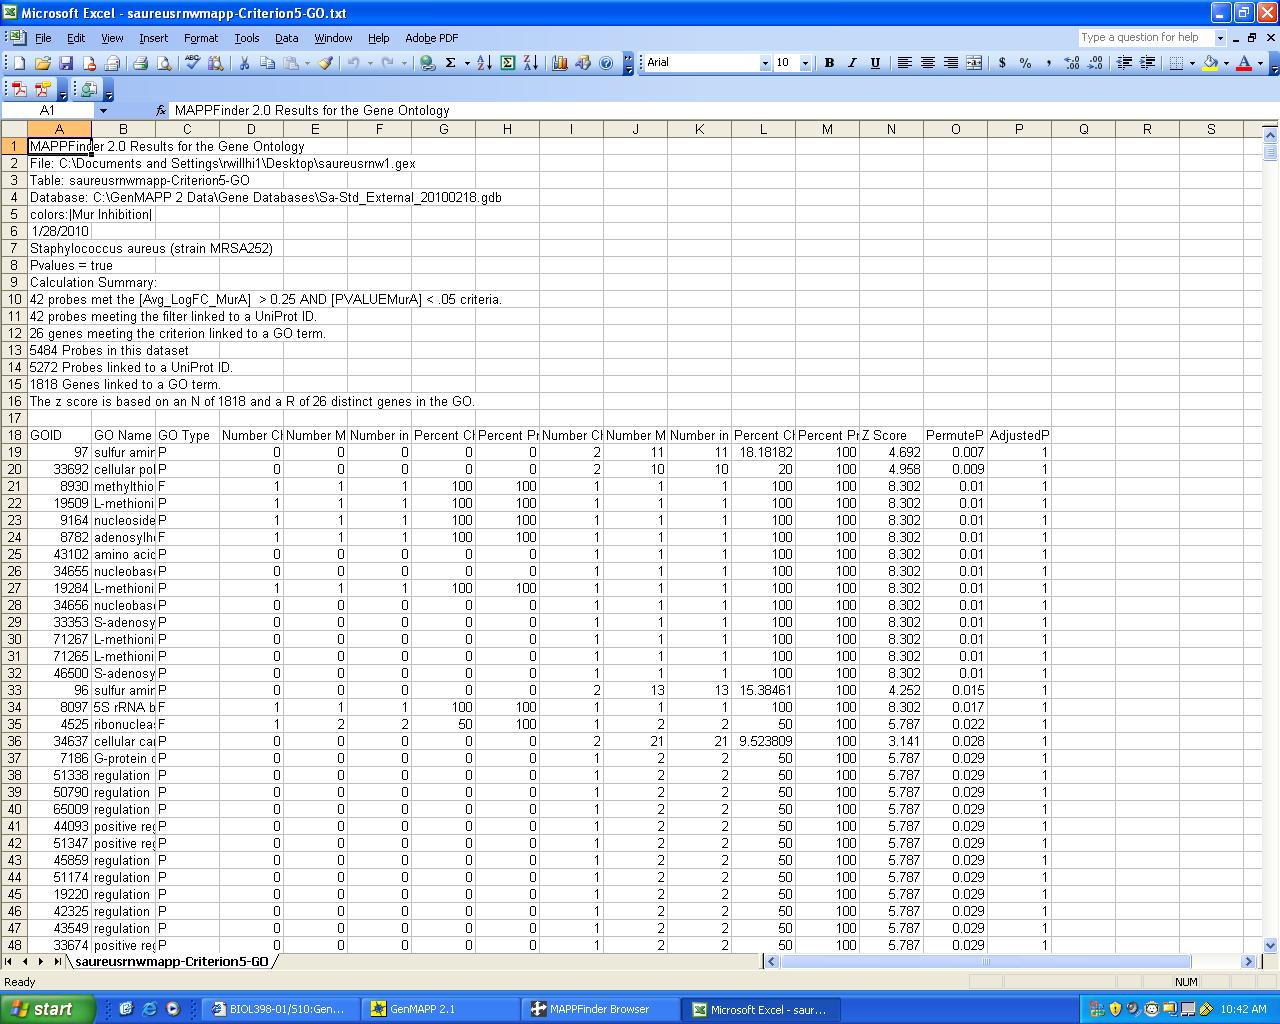
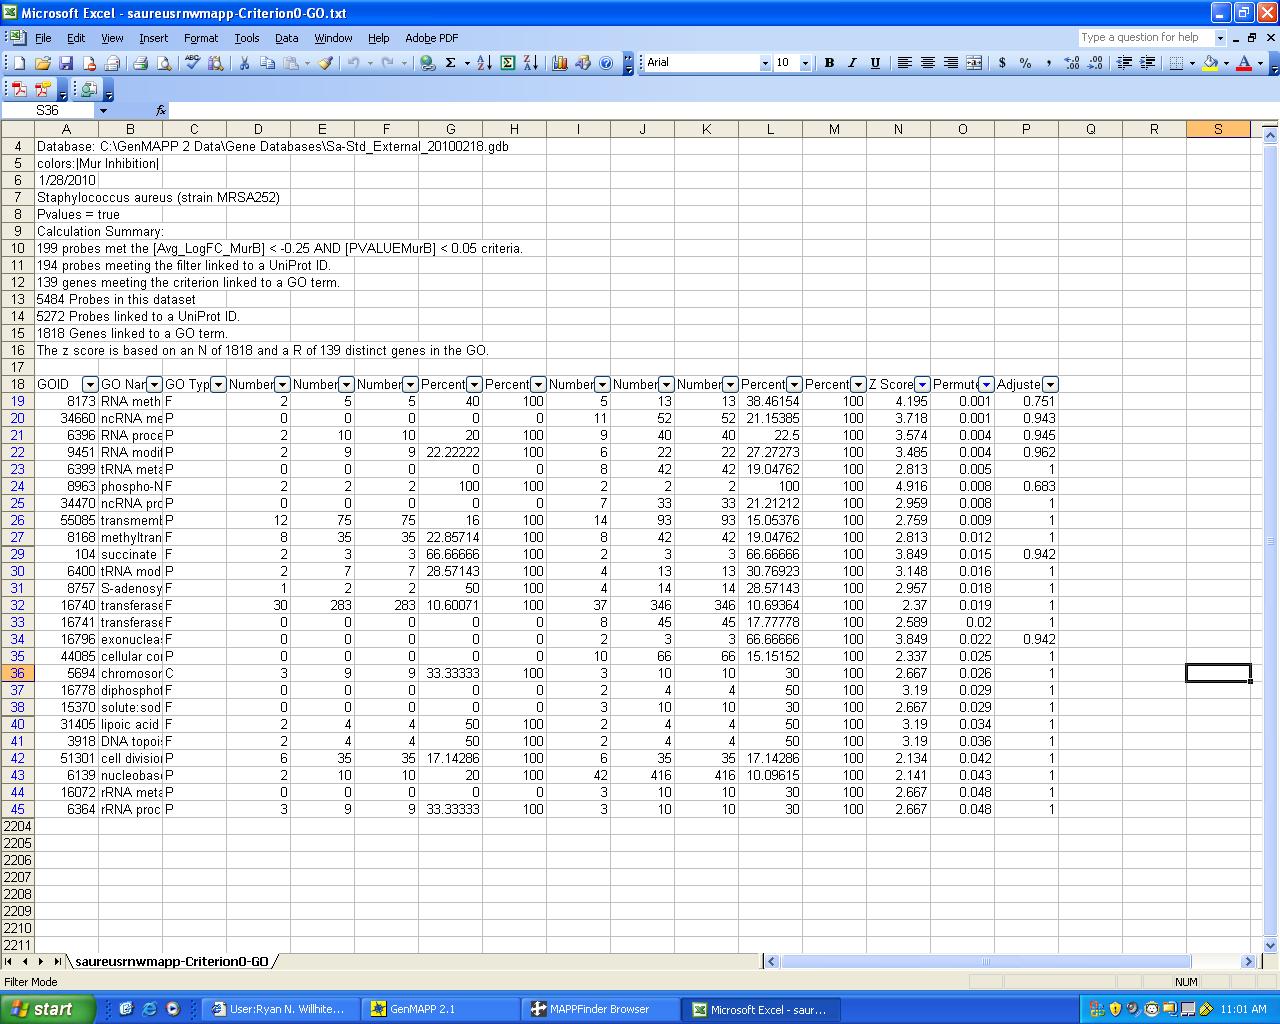
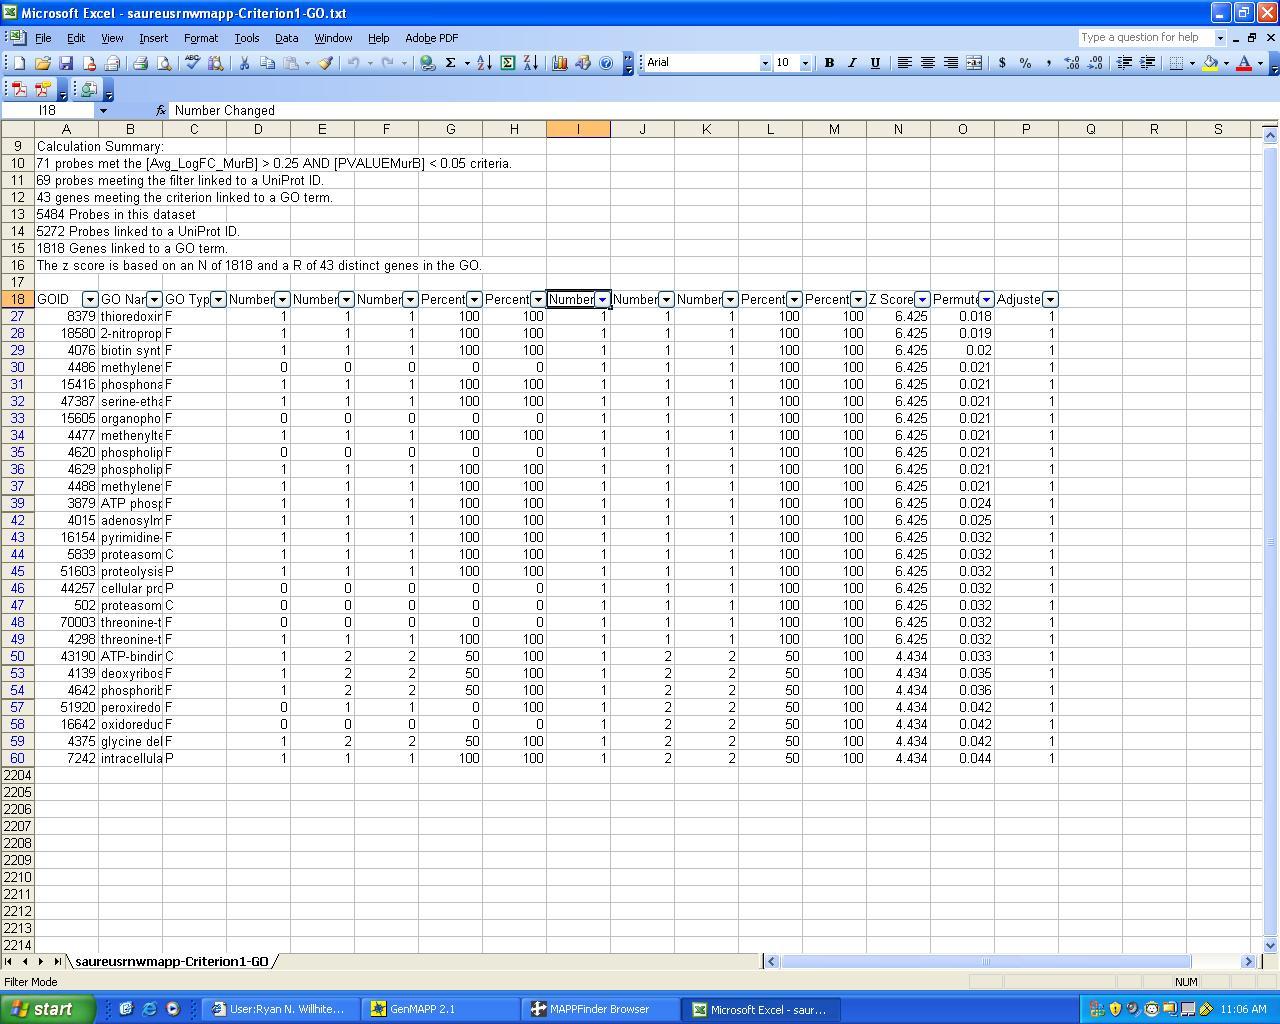
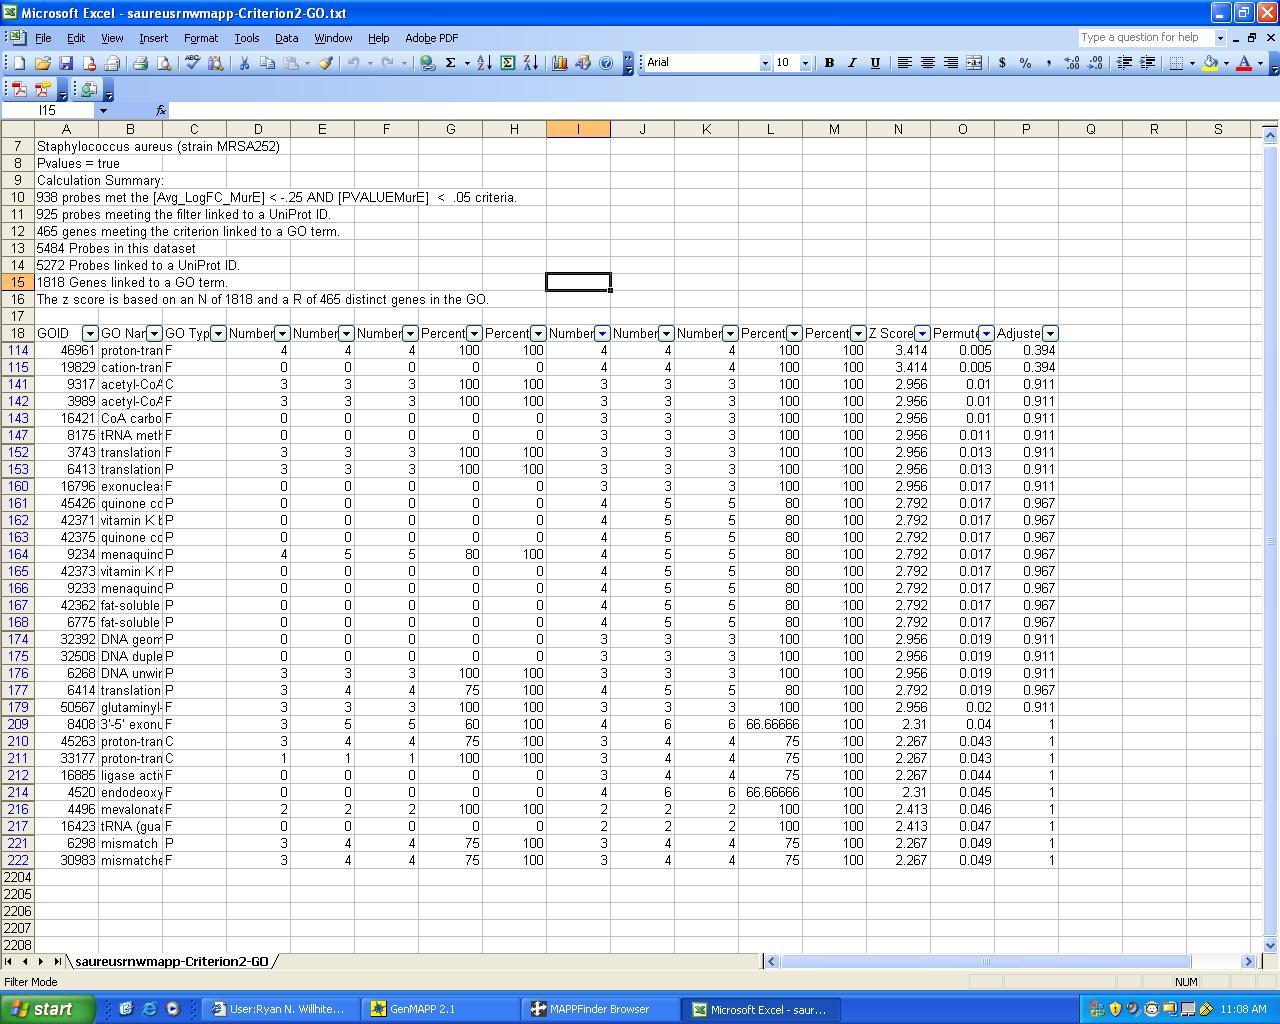
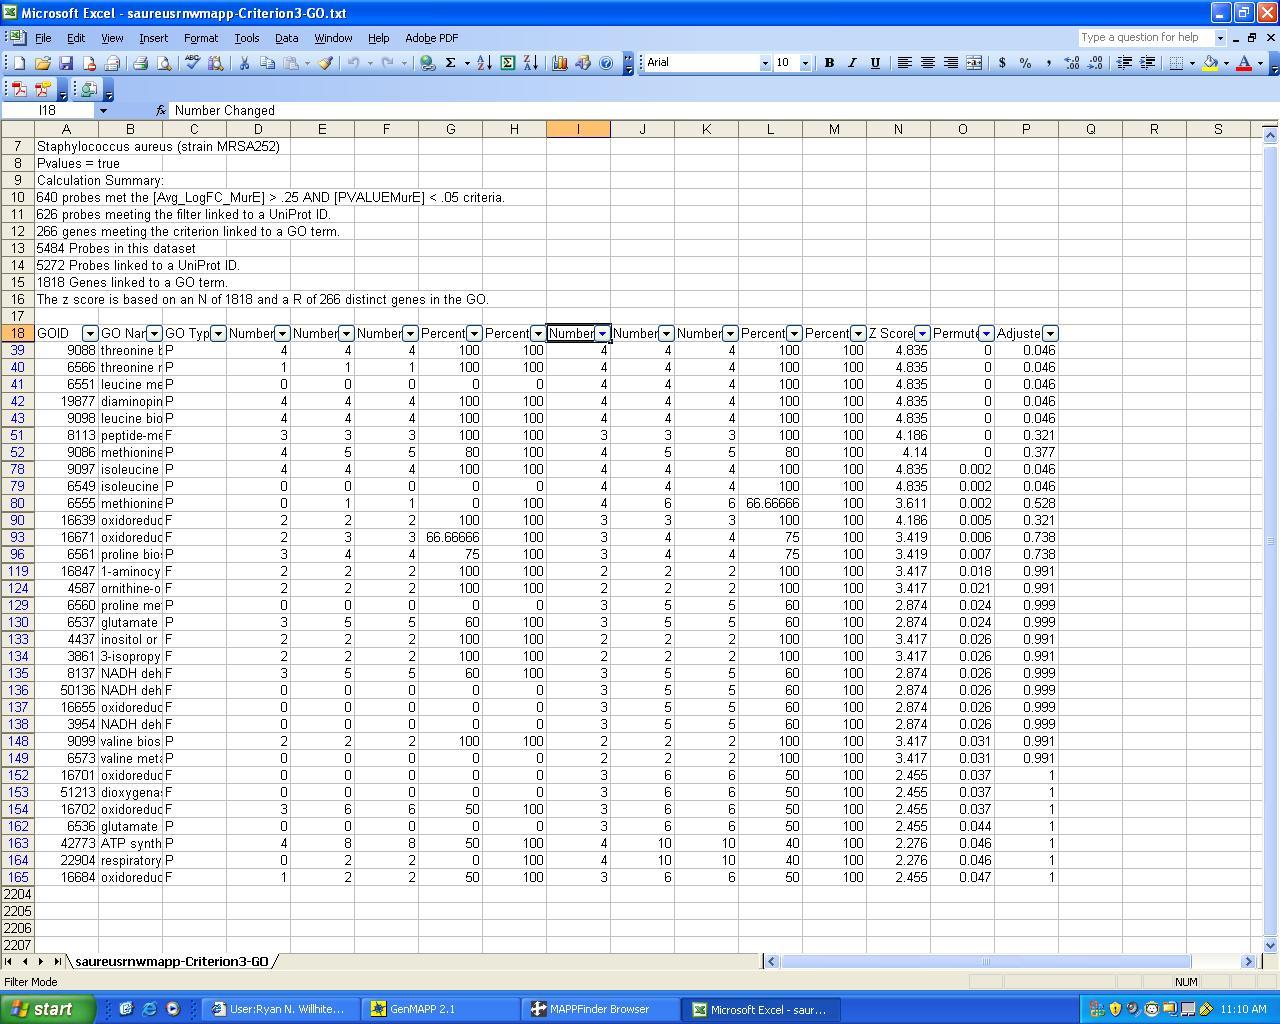
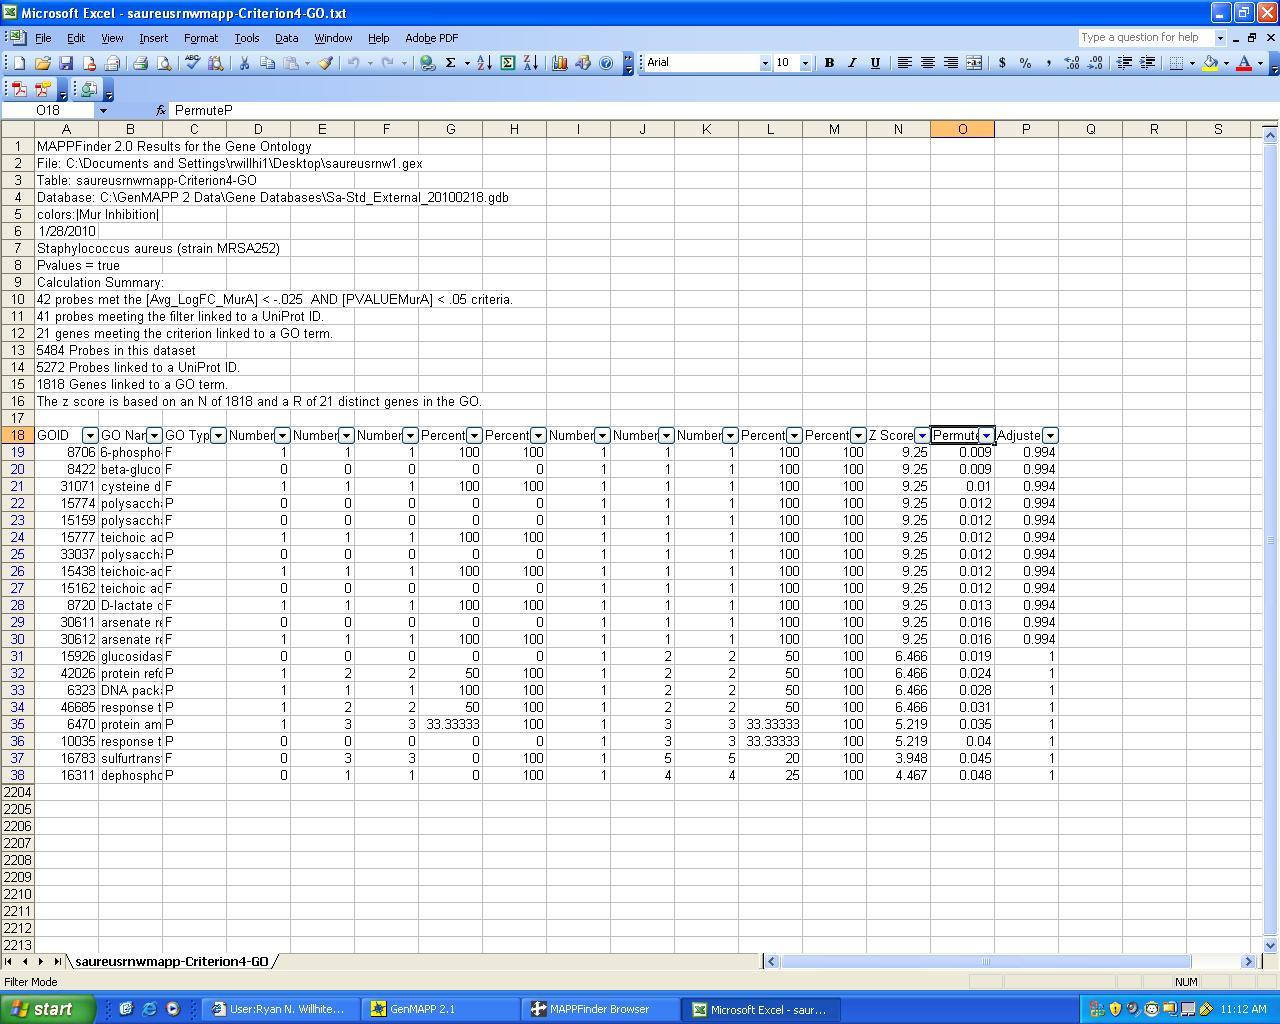
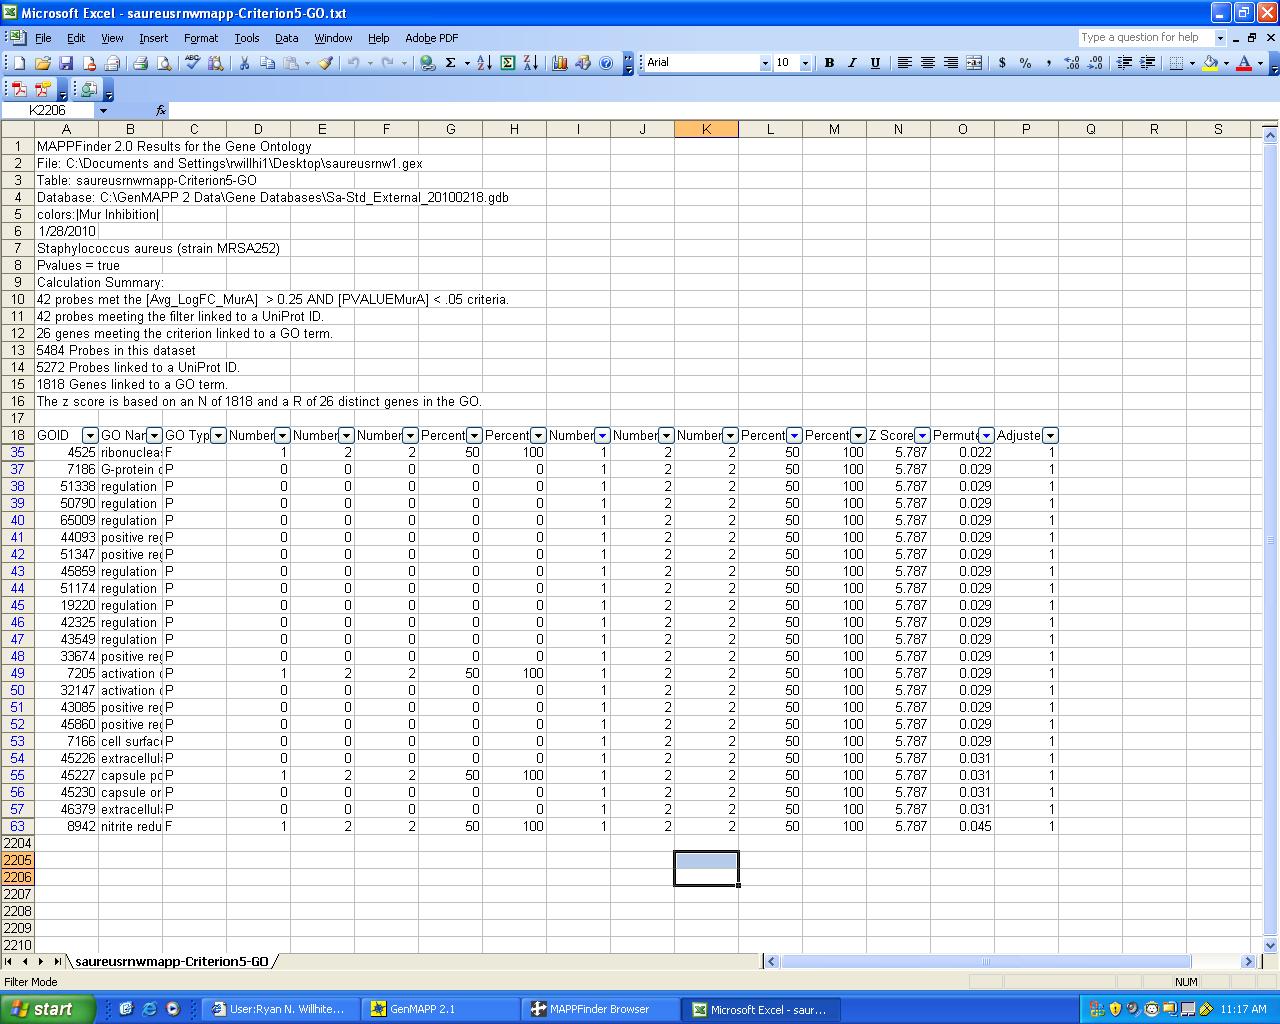
- Launch Microsoft Excel. Open the copies of the .txt files in Excel (you will need to "Show all files" and click "Finish" to the wizard that will open your file). This will show you the same data that you saw in the MAPPFinder Browser, but in tabular form.
- Look at the top of the spreadsheet. There are rows of information that give you the background information on how MAPPFinder made the calculations. Compare this information with your buddy who used a different version of the Vibrio Gene Database. Which numbers are different? Why are they different? Record this information in your individual journal entry.
- You will filter this list to show the top GO terms represented in your data for both the "Increased" and "Decreased" criteria. You will need to filter your list down to about 20 terms. Click on a cell in the row of headers for the data. Then go to the Data menu and click "Filter > Autofilter". Drop-down arrows will appear in the row of headers. You can now choose to filter the data. Click on the drop-down arrow for the column you wish to filter and choose "(Custom…)". A window will open giving you choices on how you want to filter. You must set these two filters:
Z Score (in column N) greater than 2
PermuteP (in column O) less than 0.05
You will use these two filters depending on the number of terms you have:
Number Changed (in column I) greater than or equal to 4 or 5 AND less than 100
Percent Changed (in column L) greater than or equal to 25-50%
- Save your changes to an Excel spreadsheet. Select File > Save As and select Excel workbook (.xls) from the drop-down menu. Your filter settings won’t be saved in a .txt file.
- There is one other file you need to save to your journal page. It has a .gmf extension and should be in the same fold as the .gex file that you created with the GenMAPP Expression Dataset Manager. You will need this file to re-open your results in MAPPFinder.
