RAVE:Tutorial Referencing
Referencing Tutorial
Video tutorial
Builtin help
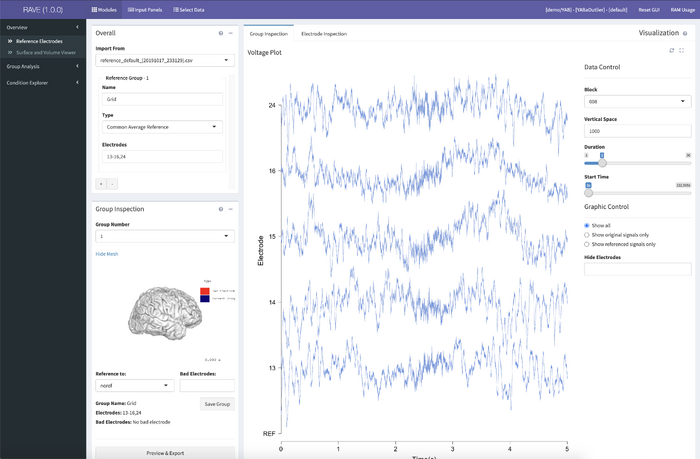
Annotated screenshot of Reference module.
Narrative tutorial
To begin, launch a RAVE session through RStudio with the following command:
>rave::start_rave()
Click the option “Select Data” from the top menu and enter a subject’s data to load. (For a tutorial on loading a subject, see Tutorial #3 here.) If this subject’s data has not yet been referenced, select “default” from the Reference droplist and load the full range of the subject’s electrodes. Click “>Load Data” at the bottom right corner of the panel to launch the RAVE session with this subject.
RAVE may automatically load the Referencing Module; if it doesn’t, look to the black menu at the far left and click “Overview” to expand the Overview options. Select “Reference Electrodes” to load the Referencing Module. A pop-up panel will appear asking to load the preprocessed voltage data for this subject and provide the size of this data and an estimated load time. Click “Load Data” to continue into the Referencing Module or “Cancel” to select another option from the left-hand menu.
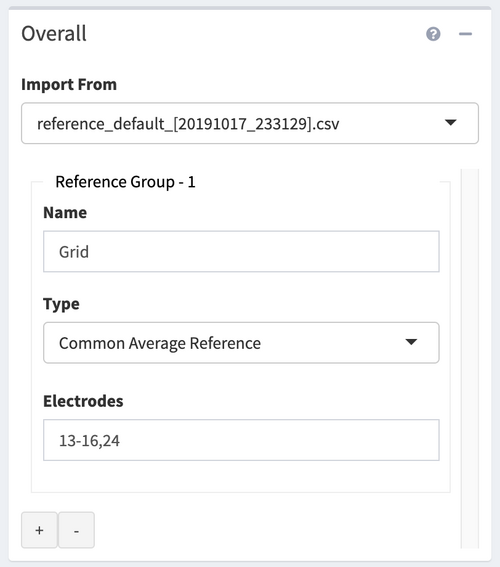
The module launches with four panels. First, look at the Overall panel at the top left. There is a droplist at the top labeled “Import From”; if a previous reference file has been exported, its settings can be loaded here. For a new reference, select “new.” Below this droplist, the panel is divided into subsections for each reference group. There must be a minimum of one reference group but the Module can accommodate over 20 groups at a time. For each group, enter a unique name in the Name textbox. The name can be any combination of alphanumerical characters so long as it is not identical to any other group’s name.
Select a reference type from the middle droplist. Three reference types are supported: common average reference (CAR), bipolar reference (BP), and white matter reference (WM). The first is a unipolar referencing scheme that creates a signal based on the average of all common signals included in the reference group and amplifies each signal against that combined potential. The second amplifies the signals of each pair of electrodes by the potential difference between them. The third identifies one or more electrode channels as recordings from the subject’s white matter and compares that signal to that of grey matter-identified electrodes. The default option is “No Reference”; select this only if the current reference group is to be excluded from the total reference.
Finally, enter the numerical values or range of electrodes in the lower textbox to include them in that reference group. To add a group, click the plus (+) icon at the bottom of the panel. To remove a group, click the minus (-) icon. Removing a group will not erase any values in the textboxes but only hide the group from the current referencing scheme.
Look now to the third panel on the page, Reference Generator, located below the Overall and Group Inspection panels on the left. There is a textbox here labeled “Electrodes.” Enter the numerical value or range of the electrodes that will be used to generate the reference for the group in which they’re included. A common average reference will average the signals across all included electrodes, a bipolar reference will compare each pair of signals to the potential difference between them, and a white matter reference will use the identified electrodes as a common reference signal. Bear in mind the reference scheme of the selected group while creating a reference with this panel.
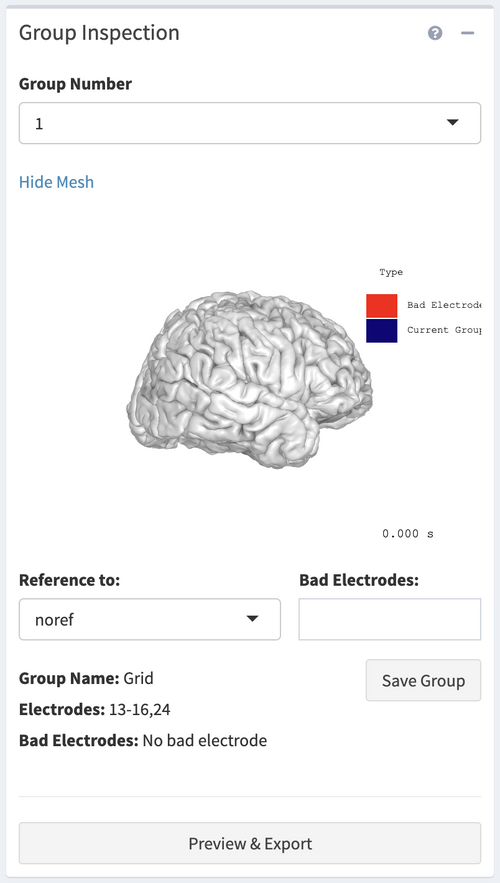
Now move back up to the second panel, Group Inspection, located immediately above the Reference Generator panel. Each group created in the Overall panel is labeled numerically; select the group number from the droplist at the top. There is a miniature version of the 3D viewer below this list that will highlight in blue the electrodes of the current group. To hide the brain in this viewer, click “hide mesh,” and to show a hidden mesh click “show mesh.” Beneath the viewer, there is a droplist labeled “Reference to:” and a textbox labeled “Bad Electrodes:”. References created in the Reference Generator panel will appear in the “Reference to:” droplist. Select the reference generated from this group from the droplist. If there are any electrodes that are broken, noisy, or otherwise outliers, enter their numerical value into the textbox to mark them as “bad.” This optional step will exclude “bad” electrodes from the reference and all further analysis. There are a few lines of text at the bottom of the panel with details about the currently selected reference group, including its name, all included electrodes, and any electrodes identified as bad. Click “Save Group” to set the reference and any bad electrodes within the current group. When all groups have been set to individual references, click “Preview and Export” at the very bottom of the panel.
A pop-up panel will appear called Export Reference Table. This table displays the data as it will be saved as a CSV file within the subject’s /rave/meta folder. The table lists each electrode and the group it’s in, the reference to which it’s set, and the referencing scheme in which that signal is applied. Use the droplist at the top left to show up to 100 entries on each page of the table. Click a page number at the bottom right to select a page or click “Previous” or “Next” to navigate one page forward or back, respectively, up to the total number of pages in the table. Below this, at the very bottom of the page, there is a textbox with three buttons below. In the textbox, enter the desired file name for the current reference. Click “Cancel” to go back to the Referencing Module to make changes. Click “Export” to save the current table as a CSV file that RAVE can load as a reference for this subject. Click “Export & Cache” to save the reference and cache the referenced data for each electrode. This one-time process takes several minutes but will allow significantly faster load times in the future for this subject loaded with this reference.
The largest panel on the Reference page is the Visualization panel. This panel has two tabs, accessible at the top left, Group Inspection and Electrode Inspection. If it’s not automatically selected, click Group Inspection. This tab shows the preprocessed voltage plots of all electrodes in the currently selected group. If this group has been referenced, the raw voltage will be shown in grey and the referenced voltage will be shown in blue; this color scheme is consistent throughout all plots in this module. At the right-hand side of the panel, there are display options for the voltage plots. At the top, select a block from the droplist to display that recording session’s voltage traces. The Vertical Space textbox is used to adjust the vertical size of the plots within the panel, allowing the plots to be resized without changing the size of the browser window. There are two sliders, Duration and Start Time, both measured in seconds. The Duration slider adjusts the amount of time shown in the voltage plots between one and thirty seconds. As this does not cover the full duration of the recording, the Start Time slider adjusts the point of the recording shown. Beneath the sliders, there are three checkbox options. Use these to hide or display the reference and raw signals as needed. To hide a specific electrode without marking it as bad, enter its number in the “Hide Electrodes” textbox.
Click the Electrode Inspection tab. This tab shows the voltage trace of an individual electrode within the group as well as two Welch periodograms and a histogram of the voltage samples to identify broken, bad, or outlier electrodes. If the current group has been set to a reference already, the raw signal will be shown in grey above the referenced signal. Select a block and an electrode from the droplists at left or use the “Previous” and “Next” buttons to navigate between electrodes of the current block. Beneath these buttons, there are two sliders adjusting the displays of the Welch periodograms at the bottom of the panel. The Pwelch Window Length slider controls the smoothness of the traces in the periodogram and the Max Frequency slider controls the range of the x-axis, frequency, of the periodograms.


