RAVE:PowerExplorer

From OpenWetWare
Jump to navigationJump to search
RAVE logo Reproducible Analysis and Visualization of iEEG

RAVE


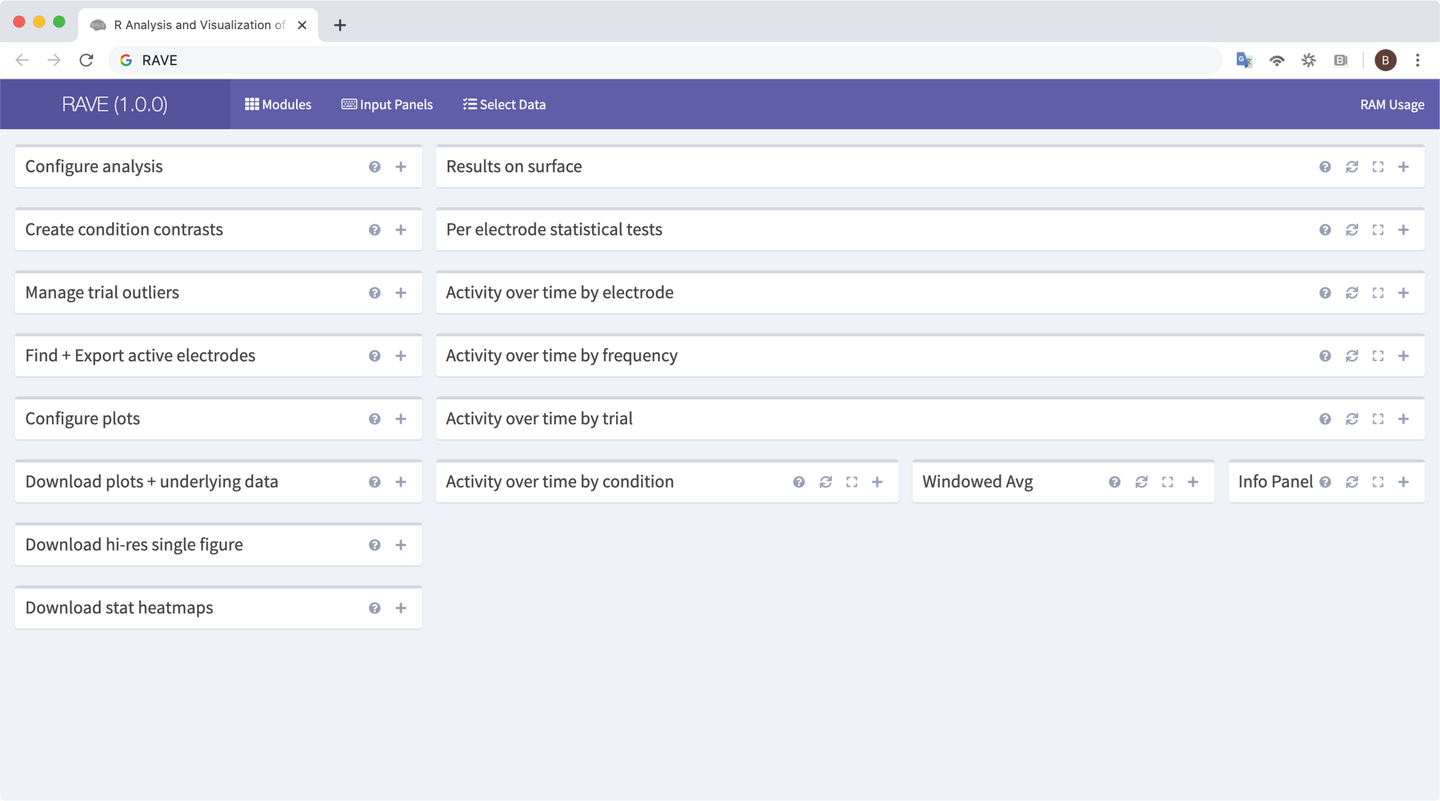
Power Explorer is the RAVE module that allows analysis of single subject iEEG data using spectral (time-frequency) analysis. The left side of the window shows ten different control panels that set analysis parameters, control plot options, and download data. The right side of the window visualizes the data with different plots. While most plots are passive, the 3dViewer plot is active and can be directly manipulated. All Panels and plots have a title bar that has functions as follows:


Click on a control panel or plot in the screenshot below for information.

Power ExplorerRAVE:PowerExplorer:input configureanalysisRAVE:PowerExplorer:input createconditioncontrastsRAVE:PowerExplorer:input managetrialoutliersRAVE:PowerExplorer:input findexportactiveelectrodesRAVE:PowerExplorer:input configureplotsRAVE:PowerExplorer:input downloadplotsunderlyingdataRAVE:PowerExplorer:input downloadhiressinglefigureRAVE:PowerExplorer:input downloadstatheatmapsRAVE:PowerExplorer:output resultsonsurfaceRAVE:PowerExplorer:output perelectrodestatisticaltestsRAVE:PowerExplorer:output activityovertimebyelectrodeRAVE:PowerExplorer:output activityovertimebyfrequencyRAVE:PowerExplorer:output activityovertimebytrialRAVE:PowerExplorer:output activityovertimebyconditionRAVE:PowerExplorer:output windowedavgRAVE:PowerExplorer:output infopanel
Power Explorer