Physics307L F09:People/Barron/labsum~Balmer
Balmer Series Lab Summary
Here is the lab manual page.
Here are my lab notes.
Partner: Justin Muehlmeyer
Introduction
In this lab, we ascertain the value of the Rydberg constant, R, using a constant-deviation spectrometer. Do to photoelectric effect, hydrogen gives off light in the visible spectrum through electrons jumping from energy levels with principle quantum number (n) higher than two to n=2. The relation of R to wavelength (λ) and n is given through this expression:
[math]\displaystyle{ \frac{1}{\lambda}=R(\frac{1}{2^{2}}-\frac{1}{n^{2}}), }[/math]
discovered empirically by Swiss high school teacher Balmer in 1885. Rydberg and Ritz later modified the above equation, giving rise to the possibility of other spectra series.
Approach
Matching color-specific spectra to values of the principal quantum number n gives many different values of R. The key is to find find the specific quantum numbers which reveal a fairly constant R over each color spectra. Using data-visualization tools in MATLAB, generating and comparing many Rs is a breeze. After ascertaining the proper values of n, one can generate an experimental value for R with a weighted mean.
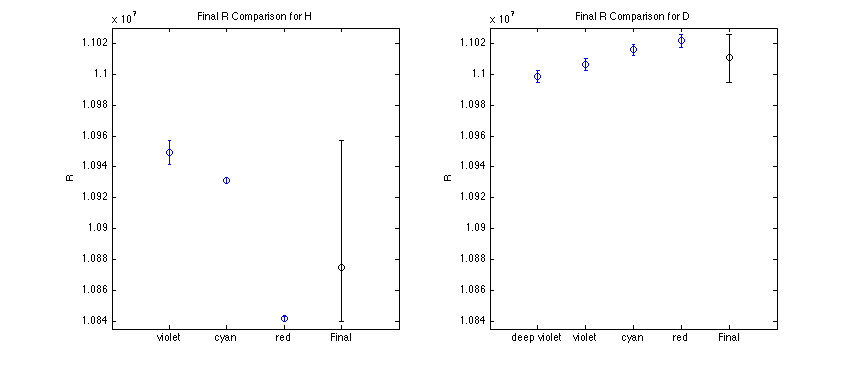
Final Results
inal R computed as a weighted mean, with error bars corresponding to the extrema of all the relevant data.
|
| Hydrogen [1/m] | Deuterium [1/m] |
|
Rfinal = 1.088e+07
|
Rfinal = 1.101e+07
|
The accepted Rydberg constant is [math]\displaystyle{ R=1.0967758\cdot 10^{7} m^{-1}, }[/math]
and doesn't appear to correlate with my uncertainty. Not a good showing overall.
Looking at the trends in R with increased wavelength readings, I believe this experiment has large systematic error - so much so that I didn't compute a statistical confidence interval on the final value. I believe this is the same situation as was discussed in the last lab lecture, where error bars generally disagree. With that in mind, I set my error to the extrema of the data errors.
In my data analysis, I saw fit to throw out information from yellow spectra in both Deuterium and Hydrogen. My thought process is in my notes.
